R E S E A R C H A R T I C L E
Open Access
Trends of main indicators of leprosy in
Brazilian municipalities with high risk of
leprosy transmission, 2001
–
2012
Lucia R. S. Freitas
1*, Elisabeth C. Duarte
2and Leila P. Garcia
3Abstract
Background:Leprosy incidence has reduced in recent years in Brazil, although the disease still persists as a public health problem in some regions. To investigate the trends of selected leprosy indicators in Brazilian municipalities with high risk of transmission is essential to provide effective control of the disease, yet this area has not been investigated. Methods:This is an ecological time-series study with multiple groups using Notifiable Diseases Information System (SINAN) data. All 692 municipalities of the states of Mato Grosso, Tocantins, Rondônia, Pará and Maranhão were included. The incidence rates of leprosy were calculated, as well as incidence rates in children under 15 years per 100,000 inhabitants and rates of new cases presenting grade-2 disabilities per 100,000 inhabitants. Joinpoint Regression was used to analyse the time trends of the different indicators studied. The spatial distribution of temporal variations of the indicators in the period was presented.
Results:Between 2001 and 2012, 176,929 leprosy cases were notified in the area studied, this being equivalent to 34. 6 % of total cases in Brazil. In the aggregate of municipalities, there was a reduction in incidence rate of leprosy from 89.10 to 56.98 new cases per 100,000 inhabitants between 2001 and 2012, with a significant reduction between 2003 and 2012 (APC:−6.2 %, 95 % CI:−7.2 % to−5.2 %). The incidence rate in <15 years also reduced significantly between 2003 and 2012 (APC:−5.6 %; 95 % CI:−7.2 % to−4.1 %). The rate of new cases with grade 2 disability remained stable between 2001 and 2012 (APC:−1.3 %; 95 % CI:−2.6 % to 0.1 %).
Conclusion:Despite the reduction in the leprosy incidence rate, strategies for controlling this disease need to be enhanced to enable early case detection, especially in hyperendemic municipalities, in order to prevent disability.
Keywords:Leprosy, Epidemiology, Ecological studies, Trends, Surveillance
Abbreviations:AAPC, Average annual percentage change; APC, Annual percentage change; BCG, Bacillus Calmette-Guérin; CAAE, Presentation of Certificate for Ethics Assessment; CI, Confidence interval; Datasus, Informatics Department of the Brazilian National Health System; ESRI, Environmental Systems Research Institute; IBGE, Brazilian Institute of Geography and Statistics; MDT, Multidrug therapy; SINAN, Notifiable diseases information system
Background
Leprosy persists as a significant health problem in several parts of the world. According to the official reports of 121 countries, 213,899 new cases were notified worldwide in 2014, 125,785 (59 %) of which occurred in India, 31,064 (15 %) in Brazil and 17,025 (8 %) in Indonesia. These
countries accounted for 81 % of total new cases notified globally [1].
Between 1 and 2 million people worldwide are currently estimated to have deformities and disabilities resulting from leprosy and it continues to be one of the main causes of neuropathy and disabilities among communicable diseases [2].
In Brazil, in 2013, were notified 31,044 new cases of leprosy and 2,439 new cases in children under 15 years. The new case detection rate was 15.44 cases per 100,000 inhabitants, the rate of new cases with grade 2 disability * Correspondence:lucia.rolim@gmail.com
1Programa de Pós-Graduação em Medicina Tropical, Núcleo de Medicina Tropical, Faculdade de Medicina, Universidade de Brasília, Brasília, Brazil Full list of author information is available at the end of the article
© 2016 The Author(s).Open AccessThis article is distributed under the terms of the Creative Commons Attribution 4.0 International License (http://creativecommons.org/licenses/by/4.0/), which permits unrestricted use, distribution, and reproduction in any medium, provided you give appropriate credit to the original author(s) and the source, provide a link to the Creative Commons license, and indicate if changes were made. The Creative Commons Public Domain Dedication waiver (http://creativecommons.org/publicdomain/zero/1.0/) applies to the data made available in this article, unless otherwise stated.
was 0.99 per 100.000 inhabitants, and the detection rate in children under 15 years was 5.03 cases per 100,000 inhabitants [3].
Following the introduction of multidrug therapy (MDT), the achievement of high Bacillus Calmette-Guérin (BCG) vaccination coverage in children and improvements in disease control, leprosy prevalence in Brazil decreased substantially from 180 cases per 100,000 inhabitants in 1988, to 26 cases per 100,000 inhabitants in 2008 [4]. Despite efforts to reduce the prevalence of the disease, these actions have apparently little effect on the reducing transmission and incidence [4–6]. Use of leprosy preva-lence as an indicator has been criticized since it is influenced by factors such as treatment duration and case identification. Alternative indicators for monitoring the disease have been suggested, such as the rate of new cases with grade 2 disability [2, 7].
The objective of this study is to describe the trends of the main indicators of leprosy in Brazilian municipalities with high risk of transmission in the period between 2001 and 2012.
Methods
This is an ecological time-series study with multiple groups (spatial trends) [8] of selected epidemiological indicators used to monitor leprosy between 2001 and
2012. The units of analysis used by this study were municipalities according to inclusion criteria.
Brazil is divided into five regions (North, Northeast, Midwest, Southeast and South), 26 states and a Federal District. It is South America’s largest country (8,515,767 km2). In 2010 it had 190.7 million inhabi-tants [9].
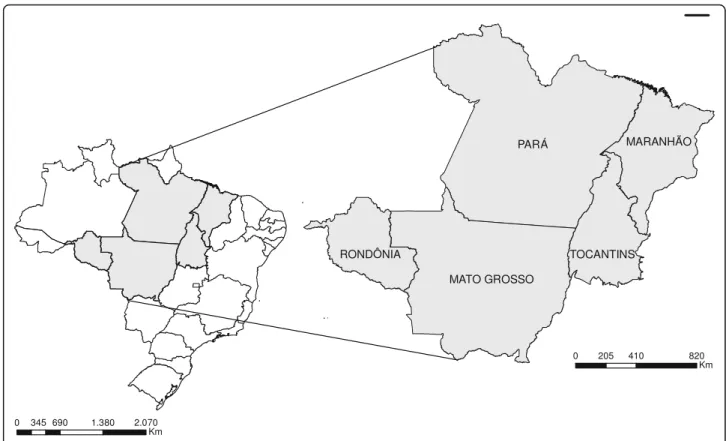
All 692 municipalities of the states of Mato Grosso, Tocantins, Rondônia, Pará and Maranhão, located in the country’s North, Northeast and Center-West regions, were included in the analysis (Fig. 1). The study area covers 2,998,569 km2and according to the 2010 demo-graphic census it had a total population of 20.1 million inhabitants, accounting for 10.6 % of the Brazilian population. These municipalities are located in what is considered to be a high risk area for leprosy transmis-sion, according to cluster analysis undertaken in 2009 by the Brazilian Ministry of Health [10]. Moreover, a study conducted in 2009–2011 found that 442 (48.4 %) of the total of 914 municipalities located in the Midwest and Northern regions had average incidence rates greater than 40.0 new cases per 100,000 inhabitants and were consid-ered to be hyperendemic [11].
The data were obtained from the Notifiable Diseases Information System (Sistema de Informação de Agravos de Notificação - SINAN).SINANis the main information
Fig. 1Study area: all municipalities of the states of Mato Grosso, Tocantins, Rondônia, Pará and Maranhão
system that records the compulsory notifications of sev-eral different diseases nationwide, including leprosy [12]. The following epidemiological indicators for leprosy were selected and calculated: incidence rate of leprosy per 100,000 inhabitants, incidence rate in children under 15 years per 100,000 children and rate of new case with grade 2 disabilities per 100,000 inhabitants. The criteria for grade 2 disability are: hands and feet: visible deform-ity or damage present; eyes: severe visual impairment (vision worse than 6/60), inability to count fingers at 6 meters), also includes lagophthalmos, iridocyclitis and corneal opacities [7]. In this study, we used the term in-cidence rate of leprosy as synonymous for the detection rate of leprosy, and implication of this is discussed latter in this manuscript.
These indicators were selected because they are used in monitoring leprosy by the control program in Brazil and for presenting the magnitude of occurrence of disease in the population. The size of the resident population used as the denominator was based on the 2010 Census and intercensal projections (2001–2012) produced by the Brazilian Institute of Geography and Statistics (IBGE) [13]. The parameter categories adopted by the Brazilian Ministry of Health [14] for interpreting each indicator were defined, namely: incidence rate of leprosy – low: <2.00 per 100,000 inhabitants; medium: 2.00 to 9.99 per 100,000 inhabitants; high: 10.00 to 19.99 per 100,000 inhabitants; very high: 20.00 to 39.99 per 100,000 inhabi-tants and hyperendemic:≥40.00 per 100,000 inhabitants); incidence rate of leprosy in children under 15 years – low: <0.50 per 100,000 children; medium: 0.50 to 2.49 per 100,000 children; high: 2.50 to 4.99 per 100,000 children; very high: 5.00 to 9.99 per 100,000 children and hyperendemic: ≥10.00 per 100,000 children). With regard to the rate of new cases with grade 2 disability, the categories used were based on approximate quartiles of the number of cases notified in the periods 2001–2003 and 2010–2012 – without cases: 0; high: >0 to <4 cases and very high:≥4 cases.
The rates were aggregated into four 3-year periods (2001–2003, 2004–2006, 2007–2009 and 2010–2012). Maps of the percentage change in the epidemiological indicators of leprosy were generated for the periods 2001–2003 and 2010–2012. Taking the periods 2001– 2003 and 2010–2012, two groups of municipalities were created for each indicator in accordance with the parame-ters defined for interpreting them: municipalities with indicators showing increases (percentage change >20 %); and all other municipalities–those with indicators show-ing reduction, maintenance or increase not greater than 20 % (percentage change≤20 %).
Joinpoint regression was used to calculate annual indicator variation between 2001 and 2012. This analysis method consists of segmented linear regression (joinpoint
regression) to identify points where trends change and to estimate annual percentage change (APC) and average an-nual percentage change (AAPC) considering the entire period of the series. Successive models were adjusted whereby in each model there were assumed to be a differ-ent number of trend change “points”, ranging from zero (where the trend is represented by a single straight seg-ment) up to no more than three, due to the quantity of observations. The model chosen was the one with the highest number of points maintaining statistical signifi-cance (p <0.05). Based on the estimated inclination for each straight segment (regression coefficient), annual change was calculated as a percentage and its statistical significance was estimated using the generalized linear model least squares method, assuming that rates follow Poisson distribution and that rate variation is not constant over time [15]. Confidence interval (95 % CI) limits were calculated for each straight segment (using estimated in-clination). During trend analysis of the rates of new cases with grade 2 disability, the rate for the year 2007 was removed because in that year there was a change in the information system regarding the definition of grade 2 disability and this could have caused trend inconsistency. This decision regarding the method is justified more clearly in the results section (Table 1).
Analyses were performed with the aid of Joinpoint ver-sion 3.5.1 (Statistical Research and Applications Branch, National Cancer Institute, Rockville, MD, USA), SatScan 9.3 (Kulldorff 2014), R 3.0.2 (R Core Team 2013) and ArcGis 9.2 (Environmental Systems Research Institute, Redlands, CA, USA) (ESRI 2010).
The Ethics Committee of the Health Sciences Faculty of the University of Brasília approved the project under number Presentation of Certificate for Ethics Assess-ment (CAAE) 20249613.9.0000.0030.
Results
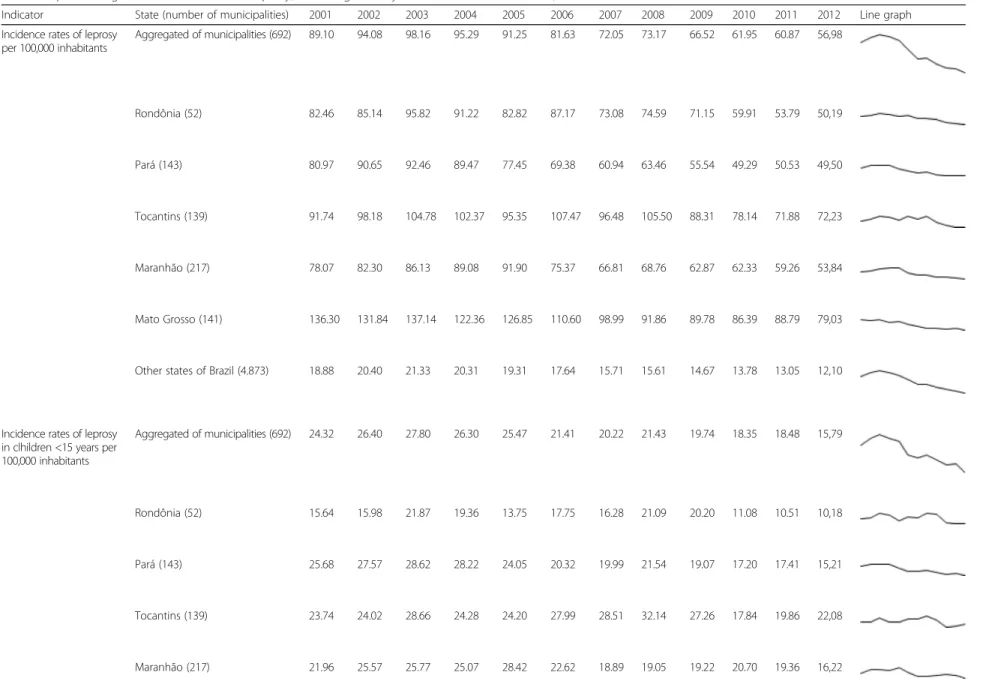
Between 2001 and 2012, a total of 176,929 cases of lep-rosy were notified in the municipalities studied, account-ing for 34.6 % of all new leprosy cases in Brazil in 10 % of the country’s population. In the aggregate of munici-palities, there was a reduction in incidence rate of leprosy from 89.10 new cases per 100,000 inhabitants in 2001 to 56.98 new cases per 100,000 inhabitants in 2012 (Tables 1 and 2). This reduction was statistically signifi-cant in the period 2003–2012 (APC:−6.2 %, 95 % CI:−7.2 to−5.2 %; Table 2). In all five states studied, there was also statistically significant reduction in incidence rates of leprosy, especially the state of Tocantins from 2008 to 2012 (APC: −9.7 %, 95 % CI: −15.2 to −4.0 %), and the state of Mato Grosso from 2001 to 2012 (APC:−6.2 %, 95 % CI:−7.2 to−5.2 %) (Tables 1 and 2).
In the aggregated of municipalities, the incidence rate in children under 15 years decreased from 24.32 to 15.79
Table 1Epidemiological indicators related to leprosy, according to the year of notification and states, 2001–2012
Indicator State (number of municipalities) 2001 2002 2003 2004 2005 2006 2007 2008 2009 2010 2011 2012 Line graph Incidence rates of leprosy
per 100,000 inhabitants Aggregated of municipalities (692) 89.10 94.08 98.16 95.29 91.25 81.63 72.05 73.17 66.52 61.95 60.87 56,98
Rondônia (52) 82.46 85.14 95.82 91.22 82.82 87.17 73.08 74.59 71.15 59.91 53.79 50,19
Pará (143) 80.97 90.65 92.46 89.47 77.45 69.38 60.94 63.46 55.54 49.29 50.53 49,50
Tocantins (139) 91.74 98.18 104.78 102.37 95.35 107.47 96.48 105.50 88.31 78.14 71.88 72,23
Maranhão (217) 78.07 82.30 86.13 89.08 91.90 75.37 66.81 68.76 62.87 62.33 59.26 53,84
Mato Grosso (141) 136.30 131.84 137.14 122.36 126.85 110.60 98.99 91.86 89.78 86.39 88.79 79,03
Other states of Brazil (4.873) 18.88 20.40 21.33 20.31 19.31 17.64 15.71 15.61 14.67 13.78 13.05 12,10
Incidence rates of leprosy in clhildren <15 years per 100,000 inhabitants
Aggregated of municipalities (692) 24.32 26.40 27.80 26.30 25.47 21.41 20.22 21.43 19.74 18.35 18.48 15,79
Rondônia (52) 15.64 15.98 21.87 19.36 13.75 17.75 16.28 21.09 20.20 11.08 10.51 10,18
Pará (143) 25.68 27.57 28.62 28.22 24.05 20.32 19.99 21.54 19.07 17.20 17.41 15,21
Tocantins (139) 23.74 24.02 28.66 24.28 24.20 27.99 28.51 32.14 27.26 17.84 19.86 22,08
Maranhão (217) 21.96 25.57 25.77 25.07 28.42 22.62 18.89 19.05 19.22 20.70 19.36 16,22
Freitas
et
al.
BMC
Infectious
Diseases
(2016) 16:472
Page
4
of
Table 1Epidemiological indicators related to leprosy, according to the year of notification and states, 2001–2012(Continued)
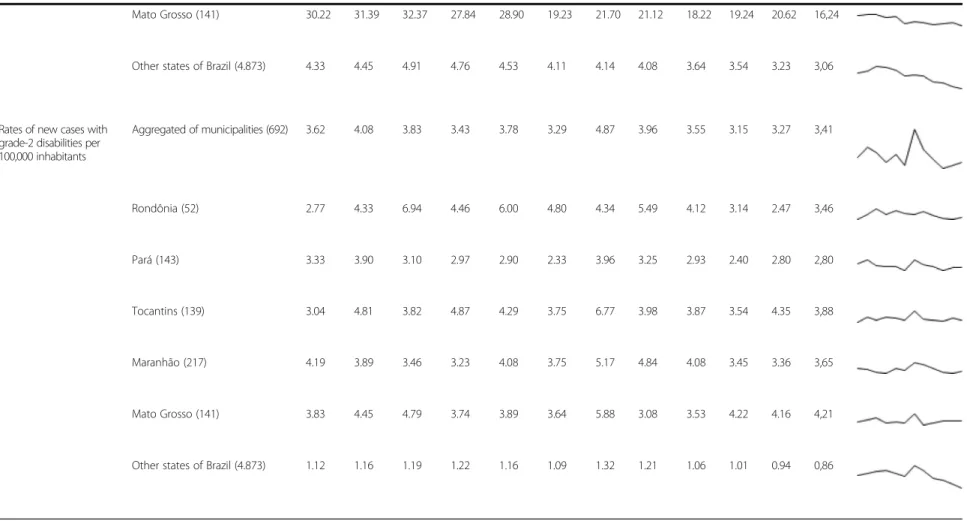
Mato Grosso (141) 30.22 31.39 32.37 27.84 28.90 19.23 21.70 21.12 18.22 19.24 20.62 16,24
Other states of Brazil (4.873) 4.33 4.45 4.91 4.76 4.53 4.11 4.14 4.08 3.64 3.54 3.23 3,06
Rates of new cases with grade-2 disabilities per 100,000 inhabitants
Aggregated of municipalities (692) 3.62 4.08 3.83 3.43 3.78 3.29 4.87 3.96 3.55 3.15 3.27 3,41
Rondônia (52) 2.77 4.33 6.94 4.46 6.00 4.80 4.34 5.49 4.12 3.14 2.47 3,46
Pará (143) 3.33 3.90 3.10 2.97 2.90 2.33 3.96 3.25 2.93 2.40 2.80 2,80
Tocantins (139) 3.04 4.81 3.82 4.87 4.29 3.75 6.77 3.98 3.87 3.54 4.35 3,88
Maranhão (217) 4.19 3.89 3.46 3.23 4.08 3.75 5.17 4.84 4.08 3.45 3.36 3,65
Mato Grosso (141) 3.83 4.45 4.79 3.74 3.89 3.64 5.88 3.08 3.53 4.22 4.16 4,21
Other states of Brazil (4.873) 1.12 1.16 1.19 1.22 1.16 1.09 1.32 1.21 1.06 1.01 0.94 0,86
Freitas
et
al.
BMC
Infectious
Diseases
(2016) 16:472
Page
5
of
new cases per 100,000 children between 2001 and 2012 and this reduction was statistically significant from 2003 to 2012 (APC:−5.6 %, 95 % CI:−7.2 to−4.1 %). There was also statistically significant reduction in the state of Pará between 2001 and 2012 (APC:−5.3 %, 95 % CI: −6.9 to −3.7 %) and in the states of Maranhão and Mato Grosso between 2001 and 2012 (APC:−3.5 %, 95 % CI: −5.6 to −1.4 % and APC:−5.9 %, 95 % CI:−7.8 to−3.9 %, respect-ively). On the other hand, the incidence rate of leprosy among children under 15 years remained stable in the states of Rondônia (APC:−3.0 %, 95 % CI:−7.5 to 1.7 %)
and Tocantins (APC:−0.9 %, 95 % CI:−4.0 to 2.3 %) be-tween 2001 and 2012 (Tables 1 and 2).
The rate of new cases with grade 2 disability was stable during the period, varying from 3.62 cases per 100,000 inhabitants in 2001 to 3.41 cases per 100,000 inhabitants in 2012. Statistically significant reduction only occurred in the state of Rondônia (APC:−7.8 %, 95 % CI:−13.9 to −1.4 %) between 2003 and 2012, and in municipalities located in other Brazilian states (not included in the aggregated data) (APC: −7.4 %, 95 % CI: −11.3 to −3.2 %) between 2008 and 2012 (Tables 1 and 2). Value
Table 2Joinpoint regression analysis of epidemiological indicators related to leprosy, 2001–2012
Indicator State Annual percentage change (APC) Average annual percentage change (AAPC) Period APC 95 % CI Intire period AAPC 95 % CI Incidence rates of leprosy
per 100,000 inhabitants Aggregated of municipalities 2001–2003 5.8 −5.3 a 18.1 2001–2012 −4.2* −5.9 a−2.4 2003–2012 −6.2* −7.2 a−5.2
Rondônia 2001–2004 4.7 −4.7 a 14.9 2001–2012 −4.1* −6.5 a−1.7
2004–2012 −7.2* −9.3 a−5.1
Pará 2001–2003 5.2 −13.1 a 27.3 2001–2012 −5.3* −8.3 a−2.3
2003–2012 −7.5* −9.3 a−5.8
Tocantins 2001–2008 0.6 −1.9 a 3.1 2001–2012 −3.3* −5.5 a−1.1
2008–2012 −9.7* −15.2 a−4.0
Maranhão 2001–2004 4.5 −5.0 a 15.0 2001–2012 −3.4* −5.8 a−1.0
2004–2012 −6.3* −8.3 a−4.2
Mato Grosso 2001–2012 −5.2* −6.2 a−4.3 2001–2012 −5.2* −6.2 a−4.3
Other states of Brazil 2001–2003 6.3 −1.4 a 14.6 2001–2012 −4.0* −5.2 a−2.8
2003–2012 −6.2* −6.9 a−5.5
Incidence rates of leprosy in children <15 years per 100,000 inhabitants
Aggregated of municipalities 2001–2003 6.0 −10.1 a 24.9 2001–2012 −3.6* −6.2 a−1.0
2003–2012 −5.6* −7.2 a−4.1
Rondônia 2001–2012 −3.0 −7.5 a 1.7 2001–2012 −3.0 −7.5 a 1.7
Pará 2001–2012 −5.3* −6.9 a−3.7 2001–2012 −5.3* −6.9 a−3.7
Tocantins 2001–2012 −0.9 −4.0 a 2.3 2001–2012 −0.9 −4.0 a 2.3
Maranhão 2001–2012 −3.5* −5.6 a−1.4 2001–2012 −3.5* −5.6 a−1.4
Mato Grosso 2001–2012 −5.9* −7.8 a−3.9 2001–2012 −5.9* −7.8 a−3.9
Other states of Brazil 2001–2003 7.9 −1.7 a 18.5 2001–2012 −2.7* −4.2 a−1.2
2003–2012 −4.9* −5.8 a 4.0
Rates of new cases with grade-2 disabilities per 100,000 inhabitants
Aggregated of municipalities 2001–2012 −1.3 −2.6 a 0.1 2001–2012 −1.3 −2.6 a 0.1
Rondônia 2001–2003 52.1 −33.8 a 249.0 2001–2012 0.9 −11.3 a 14.8
2003–2012 −7.8* −13.9 a−1.4
Pará 2001–2012 −2.2 −4.4 a 0.1 2001–2012 −2.2 −4.4 a 0.1
Tocantins 2001–2012 −0.4 −3.0 a 2.2 2001–2012 −0.4 −3.0 a 2.2
Maranhão 2001–2004 −0.4 −2.8 a 2.1 2001–2012 −0.4 −2.8 a 2.1
Mato Grosso 2001–2012 −0.3 −2.7 a 1.9 2001–2012 −0.3 −2.7 a 1.9
Other states of Brazil 2001–2008 0.2 −2.0 a 2.5 2001–2012 −2.6* −4.3 a−0.9
2008–2012 −7.4* −11.3 a−3.2
*Significantly different from 0 (p<0.05) 95 % CI: 95 % confidence intervals
inconsistency for this indicator in the year 2007 can be seen in Table 1, justifying its exclusion from the trend ana-lysis as described in the methods section.
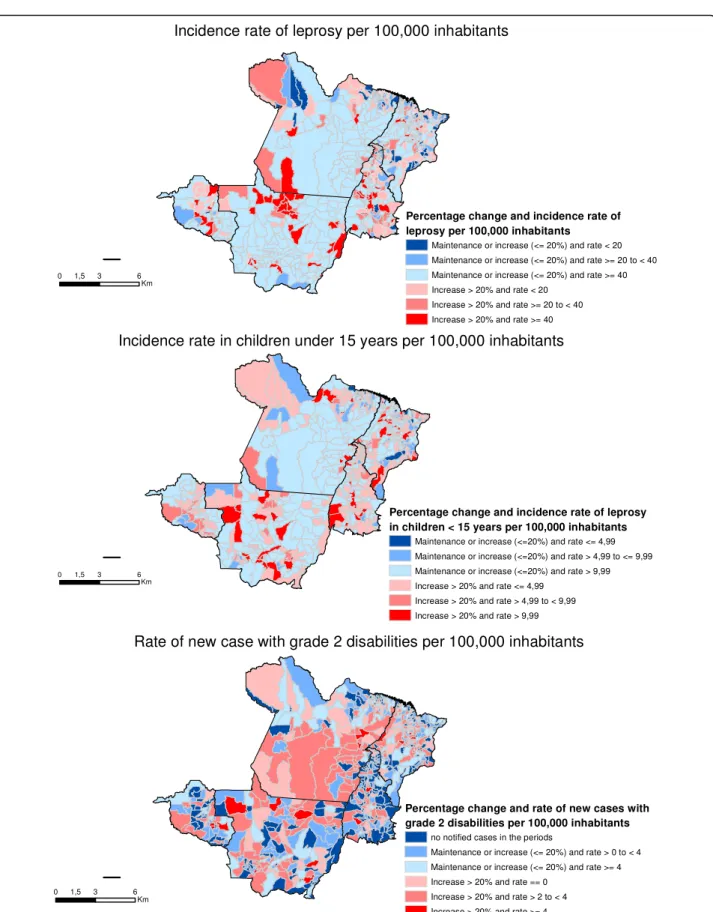
Figure 2 shows the change in the different study indi-cators, stratified by the initial rates of the baseline period (2001–2003). Thus, municipalities shown in red/pink scale are those that showed an increased (>20 %) of the rate, whereby red is the worst situation (because these municipalities presented high rates in the periods 2001– 2003 and 2010–2012). Municipalities shown in blue are those where the rate reduced, remained the same or only increased slightly (no more than 20 %), whereby dark blue is the best situation (for those municipalities had low rates in 2001–2003 and yet still showed a reduction in 2010–2012).
Between 2001 and 2003, 404 (58.4 %) municipalities of the aggregated were considered to be hyperendemic with regard to the incidence rate of leprosy. There was an in-crease of more than 20 % in the rate in 63 (9.1 %) of these municipalities (highlighted in red - Fig. 2-a). Dur-ing the same period, 288 (41.6 %) municipalities had moderate rates (low, medium or high) with regard to this indicator, and even so in 100 (14.5 %) municipalities percentage change was not greater than 20 % with regard to rate reduction, maintenance or increase (municipalities highlighted in dark blue–Fig. 2-a), when comparing the periods 2001–2003 and 2010–2012.
When analyzing the incidence rate in children under 15 years, 362 (52.3 %) municipalities were considered to be hyperendemic in the period 2001–2003. In 58 (8.4 %) of these municipalities the rate increased more than 20 % when comparing the periods 2001–2001 and 2010–2012 (municipalities highlighted in red–Fig. 2-b). With regard to this indicator, few municipalities (n= 9) had the best situation–low baseline rates and significant reduction in the period analyzed (highlighted in dark blue –Fig. 2-b).
With regard to rate of new cases with grade 2 disabil-ity, in the period 2001–2003, 51.6 % (357/692) of the municipalities did not notify grade 2 disability. 32.1 % (222/692) also had no notified cases in the period 2010– 2012 (municipalities highlighted in dark blue–Fig. 2-c). On the other hand, in the period 2001–2003, the rate of new cases with grade 2 disability in 184(26.6 %) was considered to be very high (≥4 per 100,000 inhabitants). Of these, the increase in this rate in 19 (2.8 %) munici-palities was >20 % when comparing 2001–2003 and 2010–2012 (municipalities highlighted in red - Fig. 2-c).
Discussion
In the period 2001–2012, the aggregated municipalities analysed in this study accounted for 34.6 % of new leprosy cases in just 10 % of the Brazilian population. In general, trend analysis of the aggregated data showed statistically
significant reduction in the incidence rate of leprosy and in the incidence rate in children under 15 years, although rates behaved differently between the states. On the other hand, the rate of new cases with grade 2 disability was stable during the period–suggesting late diagnosis–with continuing occurrence of cases with deformities or disabil-ities resulting from the disease in this studied aggregate.
Despite the reduction in the incidence rate of leprosy observed in this study, there are local hotspots of the disease in the country and thus maintaining disease in areas with high risk of transmission. Indeed, with regard to the leprosy incidence rate in Brazil between 2010 and 2012, 58.5 % (404/692) of the municipalities in the stud-ied area remained hyperendemic. A possible explanation for the identification of local hotspots of the disease may be the existence of non-human or environmental sources ofMycobacterium leprae[16–18].
Our study also found a relevant reduction in the inci-dence rate in children under 15 years. It is noteworthy that this rate has been used as an important indicator of active disease transmission. A study conducted in Zambia (Africa) using data covering the period 1991–2010 found there is active leprosy transmission among children. The authors highlight that in addition to serious shortfalls in the country’s leprosy control programme, active transmis-sion of the disease in children and late case diagnosis are still a cause for public health concern [19]. The incidence rate in children under 15 years in Brazil in 2012 was 4.8 new cases per 100,000 children. The aggregated data of our study found 22.2 new cases per 100,000 children. Although there are trends towards reduction, this result outlines a scenario of continuing transmission of the disease in the region studied and confirms that these aggregated municipalities form an area of high leprosy endemicity [20, 21].
Despite the falls in leprosy incidence in this aggregated study, the rate of new cases with grade 2 disability remained stable throughout the 12 year study period. This indicator has been used instead of leprosy preva-lence owing to its being a strong marker for mapping more severe cases of the disease and it’s not being influ-enced by operational factors [7]. The stability in the rate of new cases with grade 2 disability noted in this study was similar to that found in other studies [22–24]. This result may indicate some shortcomings in the control of the disease, such as failure to diagnose early and failure to accompany and/or monitor cases. The apparent in-consistency in the stability of this indicator given the reduction in the trends of incidence rate of leprosy and among children under 15 years may be related to detection bias and this will be discussed below.
This study has some limitations inherent to studies conducted using secondary data. In particular with regard to leprosy, case underreporting is expected given that the
Fig. 2Maps of the percentage change in the epidemiological indicators of leprosy, periods 2001–2003 and 2010–2012
disease begins in an insidious manner and its symptoms have multiple manifestations following a long asymptom-atic/oligosymptomatic stage, and at times requires specific health professional training and experience for diagnosis [25]. Incidence rates of leprosy therefore only take into ac-count“detected” cases of the disease and underreporting is more likely during the disease’s initial stage. Underre-porting of cases is expected especially in areas of poor ac-cess to health services. These factors may bias differently the study indicators, and the trends in states analyzed. This fact may justify, at least partly, the stability observed in rate of new cases with grade 2 disability (when underre-porting may be rarer) and the reduction in incidence rates of leprosy (where a high level of under-reporting is ex-pected). Moreover, leprosy has a complex transmission chain and this hinders the establishment of clear epi-demiological links to support the diagnosis stage [26, 27].
Another limitation relates to the change in rate of new case with grade 2 disability case definition criteria which had an impact on notifications made on the information system in 2007. With the aim of minimizing this limita-tion in this study, 2007 data was excluded given that it could influence the analysis of this indicator’s trends.
Adequate multidrug therapy (MDT) and early and ac-curate case diagnosis continue to be the main strategies for leprosy control [1, 28]. Nevertheless, based on the combination of biological and epidemiological evidence, Yadav and collaborators suggest that leprosy cannot be eliminated only through MDT, given that the disease’s microbiology is not yet totally understood [2]. New forms of control and detection are needed to combat transmis-sion more directly. One approach which may be promis-ing involves chemoprophylaxis in campaigns in schools located in high risk areas, as well as being targeted at groups such as those who have contact with the disease in their households [6, 29]. Indeed, recently the Brazilian Ministry of Health has been implanting strategies of this nature, the evaluation of which may provide insight into their effectiveness [3].
Conclusion
Despite the reduction in the leprosy incidence rate, the rate of new cases with grade 2 disability was stable during the study period. These findings suggest delays in case diagnosis and shortcomings in preventing disabilities, highlighting possible operational difficulties in controlling the disease. Therefore, there is a need to improve control strategies with the aim of preventing grade 2 disability cases, especially in hyperendemic municipalities, in order to reduce disease burden and prevent disabilities.
Acknowledgements
This research is part of the doctorate thesis of the first author and was supported by the Health Surveillance Secretariat of the Brazilian Ministry of Health (SVS/MS) and University of Brasilia.
Funding
Publication of this article was funded by the University of Brasilia, Brasilia, Brazil.
Availability of data and materials
All data used in this study are freely available in the website of the Informatics Department of the Brazilian National Health System (Datasus): http://datasus.saude.gov.br.
Authors’contributions
LRSF contributed to the data acquisition and analysis of the manuscript. LRSF, ECD and LPG contributed to the methodological study design, processing and manuscript preparation. All authors read and approved the final manuscript.
Competing interests
The authors declare that they have no competing interest.
Consent for publication
Not applicable.
Ethics approval and consent to participate
The study was conducted with leprosy cases data from the Notifiable Disease Information System (SINAN). According to the Brazilian ethical legislation, studies conducted with data from the national health information systems do not require patient informed consent. The study was approved by Ethics Committee of the Health Sciences Faculty of the University of Brasília - number CAAE 20249613.9.0000.0030.
Author details
1Programa de Pós-Graduação em Medicina Tropical, Núcleo de Medicina Tropical, Faculdade de Medicina, Universidade de Brasília, Brasília, Brazil. 2Núcleo de Medicina Tropical, Faculdade de Medicina, Universidade de Brasília, Brasília, Brazil.3Instituto de Pesquisa Econômica Aplicada, Brasília, Brazil.
Received: 2 October 2015 Accepted: 23 August 2016
References
1. World Health Organizanization (WHO). Global leprosy update, 2014: need for early case detection. Weekly epidemiological record, 90(36). Geneva: WHO; 2015. p. 461–76.
2. Yadav N, Kar S, Madke B, Dashatwar D, Singh N, Prasad K, et al. Leprosy elimination: a myth busted. J Neurosci Rural Pract. 2014;5:28–32. 3. Brasil. Ministério da Saúde. Secretaria de Vigilância em Saúde (SVS). Saúde
Brasil 2013: uma análise da situação de saúde e das doenças transmissíveis relacionadas à pobreza. Brasília: Ministério da Saúde; 2014.
4. Barreto ML, Teixeira MG, Bastos FI, Ximenes R, Barata RB, Rodrigues LC. Successes and failures in the control of infectious diseases in Brazil: social and environmental context, policies, interventions, and research needs. Lancet. 2011;377:1877–89.
5. Alencar CH, Ramos AN, Barbosa JC, Kerr LRFS, De Oliveira MLW, Heukelbach J. Persisting leprosy transmission despite increased control measures in an endemic cluster in Brazil: the unfinished agenda. Lepr Rev. 2012;83:344–53. 6. Scheelbeek PFD, Balagon MVF, Orcullo FM, Maghanoy A, Abellana J,
Saunderson PR. A retrospective study of the epidemiology of leprosy in Cebu: an eleven-year profile. PLoS Negl Trop Dis. 2013;7:e2444. 7. Alberts CJ, Smith WCS, Meima A, Wang L, Richardus JH. Potential effect of
the World Health Organization’s 2011–2015 global leprosy strategy on the prevalence of grade 2 disability: a trend analysis. Bull World Health Organ. 2011;89:487–95.
8. Kleinbaum DG, Kupper LL, Morgenstern H. Epidemiologic research: principles and quantitative methods. New York: Van Nostrand Reinhold; 1982. 9. Instituto Brasileiro de Geografia e Estatística (IBGE). Sinopse do Censo
Demográfico 2010. Brasília: Instituto Brasileiro de Geografia e Estatística; 2011. 10. Penna MLF, Wand-Del-Rey-de-Oliveira ML, Penna G. Spatial distribution of
leprosy in the Amazon region of Brazil. Emerg Infect Dis. 2009;15:650–2. 11. Freitas LRS, Duarte EC, Garcia LP. Leprosy in Brazil and its association with
characteristics of municipalities: ecological study, 2009–2011. Trop Med Int Health. 2014;19:1216–25.
12. Brasil. Ministério da Saúde, Secretaria de Vigilância em Saúde, Departamento de Vigilância Epidemiológica. Sistema de Informação de Agravos de Notificação–Sinan: normas e rotinas. Brasília: Ministério da Saúde; 2007. 13. Departamento de Informática do Sistema Único de Saúde (DATASUS).
Retrieved from DATASUS website: http://tabnet.datasus.gov.br/cgi/deftohtm. exe?ibge/cnv/popbr.def. Accessed 15 May 2014.
14. Brasil. Ministério da Saúde, Secretaria de Vigilância em Saúde, Secretaria de Atenção à Saúde. Portaria n. 125/SVS-SAS, de 26 de março de 2009. Define ações de controle da hanseníase (Ordinance No. 125/SVS-SAS of March 26, 2009. Defines actions to control leprosy). Brasília: Ministério da Saúde; 2009. 15. Kim HJ, Fay MP, Feuer EJ, Midthune DN. Permutation tests for joinpoint
regression with applications to cancer rates. Stat Med. 2000;19:335–51. 16. Truman RW, Singh P, Sharma R, Busso P, Rougemont J, Paniz-Mondolfi A, et
al. Probable zoonotic leprosy in the southern United States. N Engl J Med. 2011;364:1626–33.
17. Loughry WJ, Truman RW, McDonough CM, Tilak MK, Garnier S, Delsuc F. Is leprosy spreading among nine-banded armadillos in the southeastern United States? J Wildl Dis. 2009;45:144–52.
18. Wheat WH, Casali AL, Thomas V, Spencer JS, Lahiri R, Williams DL, McDonnell GE, et al. Long-term Survival and Virulence of Mycobacterium leprae in Amoebal Cysts. PLoS Negl Trop Dis. 2014;8:e3405.
19. Kapata N, Chanda-Kapata P, Grobusch MP, O’Grady J, Bates M, Mwaba P, Zumla A. Leprosy trends in Zambia 1991–2009. Trop Med Int Health. 2012;17:1289–93.
20. Penna MLF, de Oliveira MLVDR, Penna GO. The epidemiological behaviour of leprosy in Brazil. Lepr Rev. 2009;80:332–44.
21. Alencar CH, Ramos AN, dos Santos ES, Richter J, Heukelbach J. Clusters of leprosy transmission and of late diagnosis in a highly endemic area in Brazil: focus on different spatial analysis approaches. Trop Med Int Health. 2012;17:518–25.
22. Moreira MV, Waldman EA, Martins CL. Hanseníase no Estado do Espírito Santo, Brasil: uma endemia em ascensão? Cad Saude Publica. 2008;24:1619–30. 23. Tiwary PK, Kar HK, Sharma PK, Gautam RK, Arora TC, Naik H, et al.
Epidemiological trends of leprosy in an urban leprosy centre of Delhi: a retrospective study of 16 years. Indian J Lepr. 2011;83:201–8.
24. Monteiro LD, Alencar CHM, Barbosa JC, Braga KP, Castro MD, Heukelbach J. Physical disabilities in leprosy patients after discharge from multidrug therapy in Northern Brazil. Cad Saude Publica. 2012;29:909–20. 25. Limeira OM, Gomes CM, De Morais OO, Cesetti MV, Alvarez RRA. Active
search for leprosy cases in Midwestern Brazil: a serological evaluation of asymptomatic household contacts before and after prophylaxis with bacillus Calmette-Guérin. Rev Inst Med Trop. 2013;55:173–7.
26. Meima A, Smith WCS, Van Oortmarssen GJ, Richardus JH, Habbema JDF. The future incidence of leprosy: a scenario analysis. Bull World Health Organ. 2004;82:373–80.
27. Job CK, Jayakumar J, Kearney M, Gillis TP. Transmission of leprosy: a study of skin and nasal secretions of household contacts of leprosy patients using PCR. Am J Trop Med Hyg. 2008;78:518–21.
28. Huang WL, Jou R. Leprosy in taiwan, 2002–2011. J Formos Med Assoc. 2014;113:579–80.
29. Ekeke N, Chukwu J, Nwafor C, Ogbudebe C, Oshi D, Meka A, Madichie N. Children and leprosy in southern Nigeria: burden, challenges and prospects. Lepr Rev. 2014;85:111–7.
• We accept pre-submission inquiries
• Our selector tool helps you to find the most relevant journal
• We provide round the clock customer support
• Convenient online submission
• Thorough peer review
• Inclusion in PubMed and all major indexing services • Maximum visibility for your research
Submit your manuscript at www.biomedcentral.com/submit