Elsia Nascimento Belo ImbiribaI,II
Antônio Levino da Silva NetoI,II Wayner Vieira de SouzaIII
Valderiza PedrosaIV
Maria da Graça CunhaIV
Luiza GarneloI,II
I Instituto Leônidas & Maria Deane. Manaus,
AM, Brasil
II Universidade Federal do Amazonas.
Manaus, AM, Brasil
III Centro de Pesquisas Aggeu Magalhães.
Fundação Instituto Oswaldo Cruz. Recife, PE, Brasil
IV Fundação de Dermatologia Tropical e
Venereologia Alfredo da Matta. Manaus, AM, Brasil
Correspondence:
Elsia Nascimento Belo Imbiriba R. Teresina 176 –Adrianópolis 69057-050 Manaus, AM, Brasil E-mail: [email protected] ocruz.br Received: 03/25/2008
Revised: 12/09/2008 Approved: 02/16/2009
Social inequality, urban growth
and leprosy in Manaus: a spatial
approach
ABSTRACT
OBJECTIVE: To analyze the epidemiology of leprosy according to spatial distribution and living conditions of the population.
METHODS: Ecological study based on the spatial distribution of leprosy in the municipality of Manaus, Northern Brazil, from 1998 to 2004. The 4,104 cases identifi ed in the Sistema de Informações de Agravos de Notifi cação (Sinan –National Notifi cation System) were georeferenced according to the addresses in the 1,536 urban census tracts through four different sources: postal service (73.7% of addresses found), Property Registration Program (7.3%), Family Health Program (2.1%), and Instituto Brasileiro de Geografi a
e Estatística (Brazilian Institute of Geography and Statistics) data sheet (1.5%). Calculation of detection coeffi cient was performed based on the 2001 population. Local empirical Bayesian method was used for the spatial distribution analysis, in order to estimate leprosy risk, making rate variation shorter when they were calculated for small areas. Logistic regression was employed to analyze the association between geographical distribution and risk factors. The incidence of cases in children under 15 (severity indicator) and Social Need Index built from variables of the 2000 census were adopted as explicative variables.
RESULTS: The mean coeffi cient of detection was hyperendemic in 34.0% of the census tracts, and very high in 26.7%. Odds ratio was obtained for explicative variables and proved to be signifi cant. Low-income and incidence in children under 15 were combined to identify priority areas for intervention.
CONCLUSIONS: Spatial analysis of leprosy showed that the distribution of the disease is heterogeneous and is more strongly present in regions inhabited by more vulnerable groups.
DESCRIPTORS: Leprosy, epidemiology. Socioeconomic Factors. Geographic Information Systems, utilization. Urban Zones. Urbanization. Ecological Studies.
INTRODUCTION
In Latin America, Brazil ranks fi rst in the number of leprosy casesa and
eliminating this endemic disease is a challenge to public health policies, whose goal is reducing the prevalence rate to less than one case per ten thousand inhabitants.
a Organización Panamericana de la Salud. Situación de la lepra en la
a Fundação Alfredo da Matta. Situação epidemiológica e operacional da hanseníase no estado do Amazonas: relatório de ações do Programa
de Controle da Hanseníase no Amazonas. Manaus; 2004.
b Instituto Brasileiro de Geografi a e Estatística. Censos demográfi cos, 2000 [internet]. [cited 2004 Jul 17]. Available form:
http://www.ibge.gov.br/sidra
c Fundo das Nações Unidas para a Infância. Municípios brasileiros: crianças e suas condições de sobrevivência: censo demográfi co 1991.
Brasília: Unicef/IBGE; 1994.
Compared to the other states of the Northern region of Brazil, the state of the Amazonas has reported the lowest prevalence (2.30/10,000) and detection (3.23/10,000) rates in 2004. However, according to the standards of the Brazilian Health Ministry, these rates correspond to medium and high levels of endemicity, respectively. In the city of Manaus, the detection rate in 2004 was higher than the national rate, despite having dropped from 10.42 to 3.10/10,000 inhabitants between 1987 and 2004. As a result, Manaus is still considered to have a high ende-micity rate, which accounts for 46.2% of the new cases and 42.3% of the active cases across the state.a
More than half of the state population lives in Manaus, which also accounts for 98% of the state economy. This is a result of the implementation of the Tax Free Trade Zone in the 1960s, which implicated in the creation of the largest and most modern technological complex in Latin America. The circumstances intensifi ed the migra-tion fl ows towards the North of Brazil, especially to inner-state towns and to neighboring states such as Acre and Pará, and also towards the Northeast of the coun-try.12 The population growth rates per year between the
1970/1980 (10%) and 1990/2000 (4.9%) census periods made Manaus the biggest city in the Amazon region, with a population totaling 1 565 709 in 2004.5,11
The rapid growth rate Manaus underwent changed the spatial dimension and had repercussions in the dynamics of health issues, which justify the need of investigations concerning the urbanization process and the geographical distribution of leprosy. The assump-tions that the disease affects social classes and city districts differently and that the highest concentration of leprosy cases take place in locations with the worst living conditions were adopted as preliminary assump-tions. Upon the confi rmation of these assumptions, the public health service network could adopt the informa-tion as guidelines to determine which social inequality factors are connected to the major health problems across population strata.2
This article aimed at describing the epidemiology of leprosy according to spatial distribution associated to the living conditions of the population.
METHODS
This ecological study was based on 4,104 reported leprosy cases in the city of Manaus, Northern Brazil, between 1998 and 2004. The database of the Sistema
de Informação de Agravos de Notificação (Sinan
– National Information System for Notifi able Diseases), available through the Leprosy Control Program (PCH), was processed in an electronic spreadsheet. Inconsistent pieces of data, especially addresses, diagnosis and outcome of the cases, were checked against patients’ medical records obtained at the leprosy notifi cation centers in Manaus. In this study, the Brazilian Health Ministry’s parameters were adopted, according to which the endemic rate was classifi ed as: hyper-endemic (≥4.0/10,000 inhabitants); very high (4.0 –| 2.0/10,000); high (2.0 –|1.0/10,000); medium: (1.0 –| 0.2/10,000) and low: < 0,2/10,000.
Spatial analysis and georeferencing were adopted in assessing geographical distribution of leprosy detection in Manaus.9,10 Although it is common to adopt districts
as units to assess endemic disease distribution,2,7
this study looked into the census tracts,3,6 aiming at
obtaining more precision in calculating aggregate rates and more data stability.7
For statistical analysis the software Epi Info 3.3.2, R and Terra View were used, whereas Mapinfo was employed in building topic maps on georeferenced addresses in census tracts centroids, which adopted the geographical coordinate system (Lat Long) and Datum WGS84.
The Sistema de Informação Geográfica (SIG – Geographical Information System) was set up based on MapInfo in order to correlate the morbidity data recorded in Sinan to the population-based information from the 2000 Census.b
The map database used to georeference epidemio-logical and demographic data was made up of 1 582 census tracts established by the Instituto Brasileiro de
Geografi a e Estatística (IBGE – Brazilian Institute for Geography and Statistics). From this database, 46 tracts were discarded either because there were no residents or no information on permanent households based on the 2000 Census. As a result, 1 536 census tracts were examined. To fi nd the addresses in the census tracts, four sources were used: the postal services, Programa
de Cadastro de Logradouros (Cadlog – Property Registration Program),14Programa Saúde da Família
(PSF – Family Health Program), and IBGE forms.
Census tract socioeconomic information was used in fi nding the living conditions indicator (Índice de
a Mencaroni DA. Análise espacial da endemia hansênica no município de Fernandópolis/SP [doctoral dissertation]. Ribeirão Preto: Escola de
Enfermagem da USP; 2003.
children up to six years of age in Brazilian cities in 1991. To do this, Census 2000b variables were selected.
According to Mencaroni (2003),a these variables mirror
the living conditions and the quality of urban infrastruc-ture connected to endemic diseases such as leprosy. The variables selected from the IBGE database were: private permanent households (PPH), PPH population, PPH connected to water supply network, PPH connected to water supply network and at least one room, PPH with a bathroom or toilet, PPH connected the sewage disposal and rainwater network, PPH with no bathroom, people in charge of the PPH, people in charge of the PPH are illiterate, people in charge of the PPH have no schooling or less than one year of schooling, people in charge of the PPH have one year of schooling, schooling rate of the people in charge of the PPH, people in charge of the PPH with monthly income up to 0.5 minimum wage, people in charge of the PPH with monthly income between 0.5 and 1 minimum wage per month, people in charge of the PPH with no monthly income, monthly income of the people in charge of the PPH.
Based on the variables above the following census tract contextual indicators16 were produced: people
per household (Mordom), households with no bathroom (Domsban), households not connected to sewage disposal network (Domseg), households not connected to water supply network (Domsaga), head of household with no schooling or with less than one schooling year (Chefedu), illiterate head of household (Chefenalf), head of household with monthly income up to 1 minimum wage (Chefrend), head of household with no family income (Chefesemre), schooling years of head of household (Estudomed), average monthly income of tract (Rendamed).
To build the ICS, Akaike Information Criterion(AIC) statistics were used. It supplied criteria for choosing method for adjustment of linear regression models. The outcome variable was the leprosy detection rate. The explicative variables were the above-mentioned indicators. A stepwise regression was conducted using the StepAIC function, enabling all the identifi cation of all the possible combinations among explicative variables and the selection of the one that presented the highest explicative power.
Three out of the ten indicators were chosen: Mordom, Chefedu e Chefesemre.
To build the ICS based on the indicators selected in this study, census tracts were organized according to the rate of each indicator in isolation, thus establishing the score (Si) for each tract. The lowest value found (Vmin) corresponds to score 0, and the highest value, to score 1 (Vmax). Next, an interpolation was carried
out to obtain the scores for the remaining census tracts, using the formula Si=(Vobs - Vmin)/(Vmax - Vmin), to include all the variables in the same scale. ICS was calculated for each tract through arithmetic mean of the scores of each tract; each variable was multiplied by 100, that is ICS= 100 x ∑ Si / n, where “n” is the number of the chosen variables.16
In obtaining the mean detection rate, the numerator was the annual mean of the number of cases between 1998 and 2004, and the denominator was the projected population for the year 2001, corresponding to the middle of the period being investigated. The result of this division was multiplied by 10 000.
In the spatial analysis the incidence of leprosy, empirical Bayesian method, available in TerraView, was adopted, thus mitigating the effects of random
fl uctuation in detection rates resulting from calculating the rates for small areas.
The risk of occurrence of Hansen’s disease was calculated for each census tract based on the linear combination among the rates observed for the tracts and the mean rates observed in neighboring tracts.1,15
To obtain the risk rate, a matrix was created using tests based on contiguity and distance. The heterogeneous sizes of the tracts led us to adopt the distance criterion and to choose a radius of 850 meters, as a parameter for ‘neighboring’. The empirical method was employed in determining radius.
After categorization, the rates obtained through Bayesian method were used to validate detection as a risk indicator and used as dependent variables in regard to the census tracts. The association of the smoothed rates with the independent variables (cases in children under 15 and ICS), after being categorized, were measured by the odds ration obtained through the multiple logistic regression model.
The dependent variable, the smoothed mean detection rate, was dichotomized into the following categories: 0 for low to very high detection rate (0 to 4/10 000) and 1 for hyper-endemic detection rate (≥ 4/10 000). The independent variable, cases in children under 15 years, was divided into the following categories: 0 for tracts with no cases; 1 for tracts with one case, and 2 for tracts with two or more cases. The independent variable, Social Need Index (ICS), was classifi ed according to the following levels 0 for values from 0.109 to 0.260; 1 for values from 0.260 to 0.290; 2 for values from 0.290 to 0.330 and, 3 for values from 0.330 to 0.501.
criterion adopted was the simultaneous occurrence of to risk situations: ICS > 0,290 (medium-low and low living conditions) and the occurrence of at least one case in children under 15 years.
This study was approved by the Research Ethics Committee of the Fundação Alfredo da Matta (Report: 033, Registration: 027/2004).
RESULTS
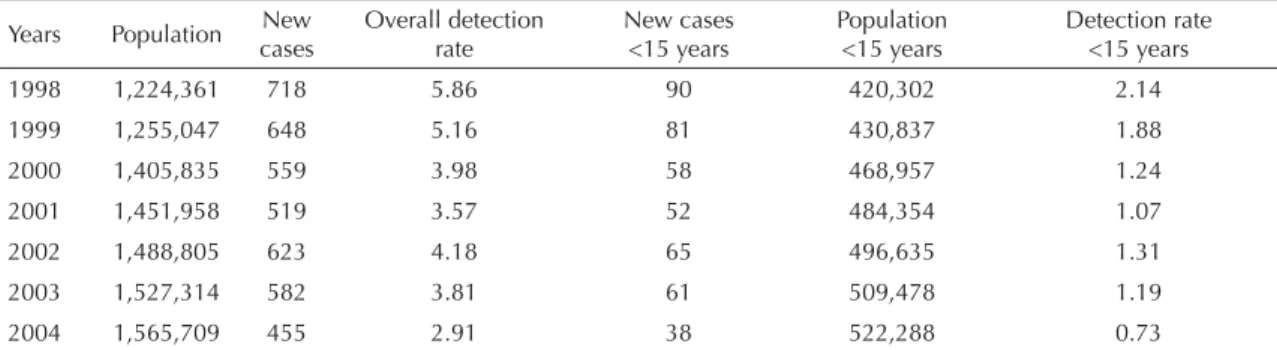
Between 1998 and 2004, the leprosy detection rate in Manaus ranged between hyper-endemic and very high (Table 1). The mean detection rate for the period was 4.21 per 10,000 inhabitants, which is considered hyper-endemic.
Children under 15 years of age accounted for 445 leprosy notifi cations or 10.8% of the cases. Between 1998 and 2003, the detection rate remained at hyper-endemic levels, and fell to very high (0.73) in 2004 (Table 1). According to the Brazilian Health Ministry, in this age group, a detection rate equal or above 1.0/10,000 is considered hyper-endemic; and between 0.5 and 1.0/10,000 it is considered very high.
In terms of operational classifi cation, 43.9% of the cases were multibacillary; 56.1% were paucibacillary, which, among children accounted for 71.5% of the cases.
In terms of distribution according to sex, 57% of the reported cases were occurred in men, in whom multi-bacillary forms prevailed, especially the dysmorphic kind. In women, paucibacillary leprosy prevailed,
especially tuberculoid leprosy. In regard to clinical forms, turberculoid leprosy prevailed, totaling 1,640 cases (40%), followed by dysmorphic leprosy, totaling 1,486 cases (36.2%). For 40 patients, this piece of infor-mation was not recorded in the Sinan database.
The impairment rate at diagnosis was assessed in 3 909 (95.3%) of the cases; out of which 11.1% (435) were in level 1 and 7.9% (307) in level 2.
Through georeferencing we located 3,467 cases (84.5%), of the total 4 104 addresses notifi ed, distrib-uted across 1 228 (79.9%) of the 1,536 census tracts. When comparing the strategies to locate addresses, it was found that the search through the postal services was the most successful accounting for 73.7% of the addresses. The Cadlog program found 7.3%; PSF 2.1%, and IBGE forms 1,5% of the addresses.
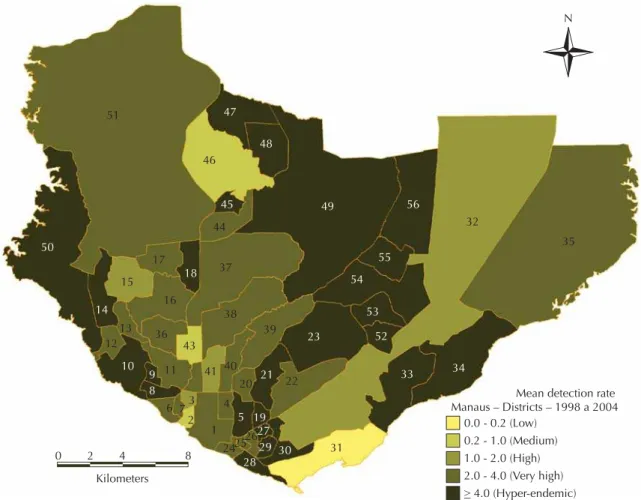
The analysis of the distribution of the mean leprosy detection rate per districts showed that 43% of them would be regarded as hyper-endemic; 46% had a very high endemic rate, and 2% a low endemic rate (Figure 1). The topic map shows that based on this analysis, the spatial distribution of the disease is imprecise, thus requiring a more accurate investigation in establishing intra-urban differences.
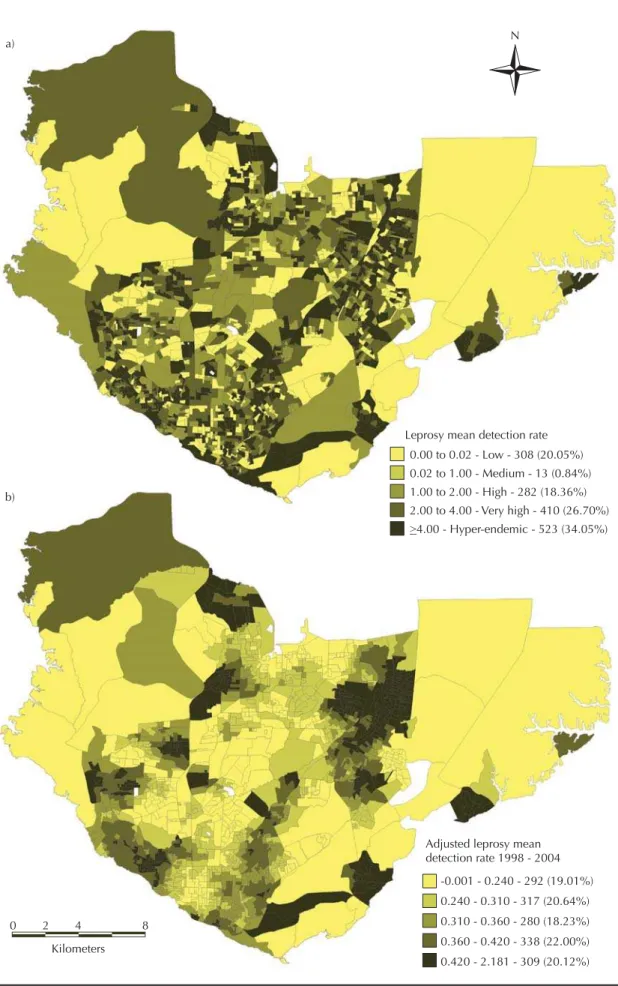
In an attempt to obtain more accurate results, the mean detection rate for leprosy was calculated per census tract. A variation between 0.66 and 24.60/10,000 inhabitants and the presence of agglomerations in the distribution of leprosy in Manaus were found. In addition, 34.0% of the census tracts presented
hyper-Table 1. New cases of leprosy per year and dectection rates. Manaus, Northern Brazil, 1998-2004.
Years Population New cases
Overall detection rate
New cases <15 years
Population <15 years
Detection rate <15 years 1998 1,224,361 718 5.86 90 420,302 2.14
1999 1,255,047 648 5.16 81 430,837 1.88 2000 1,405,835 559 3.98 58 468,957 1.24 2001 1,451,958 519 3.57 52 484,354 1.07 2002 1,488,805 623 4.18 65 496,635 1.31
2003 1,527,314 582 3.81 61 509,478 1.19 2004 1,565,709 455 2.91 38 522,288 0.73 Source: Sistema Nacional de Agravos de Notifi cação (SINAN)
Table 2. Results of the logistic regression model for validation of the risk indication. Manaus, Northern Brazil, 1998-2004.
Variable Number of cases Odds ratio 95% CI p
Under 15 years old
1 1,757 1,308; 2,359 0.000
2 or + 2,436 1,414; 4,198 0.001
Living condition
Average 1,665 1,136; 2,441 0.009 Average/Low 3,048 2,152; 4,317 0.000
endemic mean detection rates, 26.7% were considered very high, and only 20.0% of the census tracts presented low mean detection rates (Figure 2a).
The topic map of the distribution of rates (Figure 2a) show that neighboring census tracts had very different rates and that certain geographically distant tracts had similar rates.
After weighing the detection rate for each census tract by the mean rate of the neighboring tracts, Bayesian method produced adjusted and less unstable rates.1,15
The resulting topic map highlights the census tracts
that had the highest occurrence rates for leprosy (Figure 2b). The new pattern observed was more accurate in terms of leprosy detection, since it showed intra-urban differences that corresponded to the social inequalities identifi ed through the living conditions indicator.
The utilization of the Bayesian rate as a dependent vari-able, and the occurrence of leprosy in children under 15 and the ICS as independent variables showed that the chances of leprosy cases in a certain census tract increase in proportion to the number of cases in children under 15 and to the worsening of living conditions of the population (Table 2).
Figure 1. Mean detection rate of leprosy cases across districts. Manaus, Northern Brazil, 1998-2004.
Mean detection rate Manaus – Districts – 1998 a 2004
0.0 - 0.2 (Low) 0.2 - 1.0 (Medium) 1.0 - 2.0 (High) 2.0 - 4.0 (Very high)
> 4.0 (Hyper-endemic)
0 2 4
Kilometers 8
N
51
50
14
15
13 12
10 9 11
16 17
18 37
44 46
45 48 47
49
38 39
41 43
40
4 20
5
242526
27 19
2829 30
31 22
21 23
54
53
52
33 34 55
56
32
35
8
6 73
2 1 36
Manaus districts according to census tracts.
North zone: Districts: 44 – Colônia Santo Antônio; 45 – Novo Israel; 46 – Colônia Terra Nova; 47 – Santa Etelvina; 48 – Monte das Oliveiras; 49 – Cidade Nova.
East zone: Districts: 23 – Coroado; 32 – Distrito Industrial; 33 – Mauazinho; 34 – Colônia Antônio Aleixo; 35 – Puraquequara, 52 – Armando Mendes; 53 – Zumbi dos Palmares; 54 – São José Operário; 55 – Tancredo Neves; 56 – Jorge Teixeira. West zone: Districts: 6 – São Raimundo; 7 – Glória; 8 – Santo Antônio; 9 – Vila da Prata; 10 – Compensa; 11 – São Jorge; 12 – Santo Agostinho; 13 – Nova Esperança; 14 – Lírio do Vale; 50 – Ponta Negra; 51 – Tarumã.
Central-west zone: Districts: 15 – Planalto; 16 – Alvorada; 17 – Redenção; 18 – Bairro da Paz; 36 – Dom Pedro I.
South zone: Districts: 1 – Centro; 2 – Nossa Senhora Aparecida; 3 – Presidente Vargas; 4 – Praça 14 de Janeiro; 5 – Cachoeirinha; 19 – Raiz; 20 – São Francisco; 21 – Petrópolis; 22 – Japiim; 24 – Educandos; 25 – Santa Luzia; 26 – Morro da Liberdade; 27 – Betânia; 28 – Colônia Oliveira Machado; 29 – São Lázaro; 30 – Crespo; 31 – Vila Buriti.
Figure 2.a) Mean detection rate for leprosy cases according to census tracts. b) Local Bayesian analysis of the mean detection rate for leprosy cases according to census tracts. Manaus, Northern Brazil, 1998-2004.
Leprosy mean detection rate 0.00 to 0.02 - Low - 308 (20.05%) 0.02 to 1.00 - Medium - 13 (0.84%) 1.00 to 2.00 - High - 282 (18.36%) 2.00 to 4.00 - Very high - 410 (26.70%)
>4.00 - Hyper-endemic - 523 (34.05%)
Adjusted leprosy mean detection rate 1998 - 2004
-0.001 - 0.240 - 292 (19.01%) 0.240 - 0.310 - 317 (20.64%) 0.310 - 0.360 - 280 (18.23%) 0.360 - 0.420 - 338 (22.00%) 0.420 - 2.181 - 309 (20.12%)
a) N
b)
0 2 4
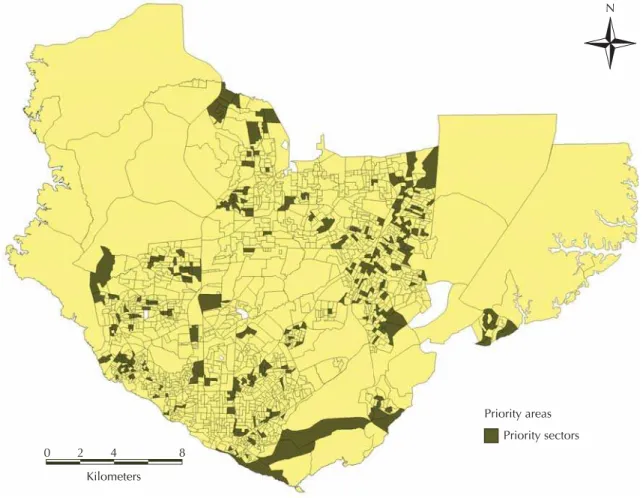
The topic map of the areas to be prioritized for interven-tions (Figure 3) shows 233 (15%) of the census tracts, which account for 17.4% of the studied population and 1,033 leprosy cases (29.8%) of the total. Out of the 1,033 cases, children under 15 account for 332 cases, which corresponded to 74.6% of the occurrence of the disease in this age bracket in the investigated period. The average detection rate in these areas was 6.1/10,000, and included tracts that presented the highest rate of 24.6/10,000.
DISCUSSION
Despite the marked population growth and chaotic spatial organization in the last 40 years in Manaus, population density did not increase. From 1970 to 2000 the number of inhabitants per hectare fell to 30 inhabit-ants/hectare in 1995, that is, a quarter of the population density of 1970 (112 inhabitants/Ha), which resulted in Manaus growing horizontally.12
The “peripheralization” reveals the inequalities that mark the organization of space.12 In Manaus, this phenomenon
is explained by the increase in the speculation of farm-land that produced enormous “demographic vacuums”,
at the same time as new areas began to be occupied.11
This kind of occupation moved the city from the south towards the north. The new areas, occupied by migrants coming from other regions and cities, added to the areas previously established and occupied by the population living in Manaus before the implementation of the Free Trade Zone.5,11 These events suggest that urbanization
and rapid growth affected the dynamics of the health problems, and may be able to explain the proliferation and distribution of the endemic disease in question.
The detection rate in children under 15 years is an indicator that mirrors the severity of the endemic level of leprosy in Manaus and early exposure to the
Mycobacterium. leprae.8,17 Children are affected more
frequently when there are cases of the disease in the family or when they reside in areas with high incidence rates.13,17 In Manaus, the variation of this rate bracket,
between hyper-endemic and very high, is an indication of the gravity of the problem in the city area. The preva-lence of tuberculoid leprosy in the general distribution of cases reinforces the assumption that the disease has a high transmission rate, since even individuals with a certain immune competence would be being affected.
Priority areas
Priority sectors N
0 2 4
Kilometers 8
The distribution of the detection rate across census tracts shows there is a signifi cant part of the population that is exposed to the disease, especially in areas with hyper-endemic and very high endemic rates. Together, these areas account for 60.7% of the census tracts and 62.6% of the population of Manaus.
The aggregate data and data analysis reveal different possible explanations for the spatial distribution of leprosy in Manaus. The comparison between the topic maps illustrating mean detection rate per district (Figure 1) and per census tract (Figure 2a) enables the visualiza-tion of the geographical heterogeneity of the endemic disease in question since they adopt a smaller unit of analysis, i.e. the census tract.
Although the mean detection rate distribution across census tract improves understanding on the spatial distribution of leprosy in Manaus, additional actions must be carried out to assess whether there is a spatial pattern, to identify areas with similar risk rates, and isolate the level of infl uence of the size of the spatial units. These units present a high variation in terms of detection rate due to the instability of the values obtained for small areas.1
Only the topic map containing the smoothed rates (Figure 2b) adequately illustrated the areas with higher risk rates. Considering the growth of the city took place in the direction that moves away from historical city center (in the south of city) towards the north, two risk patterns were identifi ed: one in central areas that have been occupied for a long time, and another in recently occupied areas.a
The concentration of census tracts with high leprosy rates in the southern area of the city, with a projection towards the contiguous western areas, shows an inci-dence pattern connected to the sociodemographic char-acteristics of the oldest part of the city. In this area, the endemic disease in question is consolidated, presenting high rates, which are compatible with the area’s high population density and poverty rates. On the other hand, the pattern established by the distribution of smoothed detection rates to the east and extreme northwest of the city, would correspond to the late urbanization process resulting from immigration.11,12
To explain the spatial distribution pattern of leprosy, we must consider that the geographical spread of the disease did not take place as a result of the mere dissemination from the original focus point in the historical center of town to neighboring areas towards more distant peripheral areas. The topic maps show that the rates found in the in-between areas neither correspond to the high endemic rates in the focus point,
nor to the levels in the distant peripheral areas in the east and north of the city.
Therefore, we are lead to conclude that the high rates in the distant peripheral areas would be connected to the urbanization process that took place after the imple-mentation of the Free Trade Zone. In these areas, trans-mission takes place due to a geographically dispersed population that has a high susceptibility rate (due to little prior contact with the bacillus), poor living conditions, and lack of access to health services. An example of this situation is the extreme north of the city, which is formed by the census tracts that include the districts of Colônia Santo Antônio, Terra Nova, Novo Israel, Santa Etelvina, and Monte das Oliveiras. Although this area is close to the western region of the city, its endemic profi le is closer to the profi le of the eastern area of the city, which includes the districts Zumbi dos Palmares, São José Operário, Tancredo Neves, and Jorge Teixeira.
In short, in the new and very far outskirts of the city, the endemic process is connected to the very low living conditions of the population. On the other hand, the endemic process observed in the old downtown area of Manaus and the nearer outskirts result from an increase of the consolidated focus point of the disease, in areas with high population density where the frequency of contact is higher.
Comparing Figures 2b and 3, we can notice that areas considered priority areas overlap according to the distribution of detection rates obtained through Bayesian method. The census tracts that ought to be prioritizes correspond, therefore, to those in which there are cases of children under 15 in addition to very poor living conditions, as identifi ed by the ICS.4,17,18
These areas are the ones with the highest endemic rates in Manaus, and thus require a differentiated approach from the health service network.
The results confi rm the seriousness of the leprosy situ-ation in Manaus. The spatial distribution of the cases has revealed a heterogeneous distribution of the disease, mirroring the differences in the urban occupation process and a concentration of the disease in areas inhabited by vulnerable population. There is a high unknown preva-lence, which is only observed with the implementation of control. Empirical Bayesian method was useful to capture the spatial effects resulting from the infl uence of neighboring tracts, which were illustrated by a clearer and better interpreted topic map.
A partnership between different entities, to create a centralized program to address the issue and to generate information systems capable of communicating, could lead to a rationalized use of the resources and improve-ments in controlling the disease.
a Levino A. Estudo da associação entre tuberculose e a infecção pelo HIV no município de Manaus – AM [master’s dissertation]. Rio de
1. Assunção RM, Barreto SM, Guerra HL, Sakurai E. Mapas de taxas epidemiológicas: uma abordagem Bayesiana. Cad Saude Publica. 1998;14(4):713-23. DOI: 10.1590/S0102-311X1998000400013
2. Barcellos C, Sabroza PC, Peiter P, Rojas LI. Organização espacial, saúde e qualidade de vida: análise espacial e uso de indicadores na avaliação de situações de saúde.
Inf Epidem SUS. 2002;11(3):129-38.
3. Barcellos C, Santos SM. Colocando dados no mapa: a escolha da unidade espacial de agregação e integração de bases de dados em saúde e ambiente através do geoprocessamento. Inf Epidem SUS. 1997;6(1):21-9.
4. Browne SG. The history of leprosy. In: Hasting RC. Leprosy. Edinburgh: Curchill Livingstone; 1985. p.53-87.
5. Carneiro Filho A. Manaus: fronteira do extrativismo: cidade, um histórico de dinâmica urbana amazônica. In: Rojas LBI, Toledo LM, organizadores. Espaço e doença: um olhar sobre o Amazonas. Rio de Janeiro: Fiocruz; 1998. p. I.6.1-I.6.5.
6. Carvalho MS, Cruz OG. Análise espacial por microáreas: métodos e experiências. In: Veras RP, Barreto ML, Almeida Filho N, Barata RB, organizadores. Epidemiologia: contextos e pluralidade. Rio de Janeiro:Fiocruz; 1998. p.79-89. (Série Epidemiológica).
7. Carvalho MS, Souza-Santos R. Análise de dados espaciais em saúde pública: métodos, problemas, perspectivas. Cad Saude Publica. 2005;21(2):361-78. DOI: 10.1590/S0102-311X2005000200003
8. Ebenezer L, Arunthathi S, Kurian N. Profi le of leprosy in children: past and present. Indian J Leprosy. 1997;69(3):255-9.
9. Lapa TM, Albuquerque MFPM, Carvalho MS, Silveira Júnior JC. Análise da demanda de casos de hanseníase aos serviços de saúde através do uso de técnicas de análise espacial. Cad Saude Publica. 2006;22(12):2575-83. DOI: 10.1590/S0102-311X2006001200008
10. Lapa T, Ximenes R, Silva NN, Souza W, Albuquerque MFPM, Campozana G. Vigilância da hanseníase em Olinda, Brasil, utilizando técnicas de análise espacial.
Cad Saude Publica. 2001;17(5):1153-62. DOI: 10.1590/S0102-311X2001000500016
11. Ribeiro Filho V. Manaus, crescimento demográfi co e espacial. Sesquicentenário da elevação de Manaus à categoria de cidade (1848 – 1998). Amazonia Cad. 1998;4:309-21.
12. Ribeiro Filho V. Mobilidade residencial em Manaus: uma análise introdutória. Manaus: Editora da Universidade do Amazonas; 1999.
13. Selvasekar A, Geetha J, Nisha K, Manimozhi N, Jesudasan K, Rao PS. Childhood leprosy in an endemic area. Leprosy Rev. 1999;70(1):21-7.
14. Skaba DA, Carvalho MS, Barcellos C, Martins PC, Terron SL. Geoprocessamento dos dados da saúde: o tratamento dos endereços. Cad Saude Publica. 2004;20(6):1753-6. DOI: 10.1590/S0102-311X2004000600037
15. Souza WV, Barcellos CC, Brito AM, Carvalho MS, Cruz OG, Albuquerque MFM, et al. Aplicação de modelo bayesiano empírico na análise espacial da ocorrência de hanseníase. Rev Saude Publica. 2001;35(5):474-80. DOI: 10.1590/S0034-89102001000500011
16. Souza WV, Ximenes R, Albuquerque MFM, Lapa TM, Portugal JL, Lima MLC, et al. The use of socioeconomic factors in mapping tuberculosis risk areas in a city of northeastern Brazil. Rev Panam Salud Publica. 2000;8(6):403-10. DOI: 10.1590/S1020-49892000001100005
17. Talhari S, Neves RG. Dermatologia tropical: hanseníase. 3.ed. Manaus: Gráfi ca Tropical; 1997.
18. Trautman JR. Epidemiological aspects of hansen’s disease. Bull N Y Acad Med. 1984;60(7):722-31. REFERENCES