PIXAIR DRONE INSTITUTE
An Institute to promote the learning of aerial photography, which will promote the academic tourism in Portugal, help in the formation of destination image and promote sustainable tourism in Portugal.
Asma Sheikh
2019
PIXAIR DRONE INSTITUTE
An Institute to promote the learning of aerial photography, which will promote the academic tourism in Portugal, help in the formation of destination image and promote sustainable tourism in Portugal.
Asma Sheikh
A project submitted to the School of Tourism and Maritime Technology of Polytechnic Institute of Leiria in partial fulfillment of the requirements for the master’s degree in Sustainable Tourism Management
Business plan conducted under the supervision of
Professor Doctor Michael Schön and Professor Doctor Rui Martins.
2019
i Dedication and Motivation
Pixair Institute is dedicated to all Drone and Aerial Photography enthusiasts, who seek professional institute where they can learn and gain all the skills and knowledge required for professional Aerial photography, from the most experienced and skillful team of drone instructors, with the latest and best quality equipment, flexible learning at affordable price within Europe, without the need to travel far to other countries across the world.
I would like to express my gratitude towards my Professors for guiding me and turning my concept into reality, without their guidance and help I would have never turned this concept into a real business plan.
Furthermore, I would like to thank all the participants, pilots, instructors and educational institutes for helping me and providing me with valuable insight during my research process, it has really helped me to complete my research topic and design my business plan successfully.
Lastly, I would like to thank my husband, my son and my dear family for supporting me, and providing me with help and information required in the field of UAV’s and my entire journey.
ii Abstract
This business plan is focused on promoting sustainable academic tourism and destination image of Portugal. Pixair Institute acts as a medium for achieving this by attracting international students, promoting student mobility and providing the students in Portugal the opportunity to, learn UAV pilot skills, aerial photography and enhance their career opportunities, maintaining sustainability by keeping the guiding principles required for economic, environmental and socio-cultural sustainability.
Pixair focuses on providing attractive training services, with the cutting-edge equipment and expert staff, at a reasonable cost and flexible learning hours in the most attractive city of Portugal, Lisbon. The aim of Pixair is to combine the concept of achieving academic tourism by encouraging student mobility, and create destination image of Portugal, with aerial photography services through UAV, and promote Lisbon as a competitive destination for providing aerial photography and UAV pilot skills, compared to other institutes around the world.
The plan focuses on analyzing the needs of Portugal, in terms of social, economic and environmental aspects and designing its structure and objectives required. Focusing on using an approach required for planning business model, such as Business Model Canvas determining the external market and internal environment by conducting questionnaires, competitor analysis and using it efficiently to plan effective strategies required for implementing the plan.
Lastly designing a work plan and milestones required as a benchmark for analyzing the business financial projections for the next 5 years to determine the profitability and feasibility of Pixair.
Pixair received a good response from students, photographers, and businesses for providing this opportunity in Portugal by promoting academic and sustainable tourism in Portugal by encouraging and promoting this new niche-segment of tourism in Portugal.
Keywords
iii Index Page
Dedication and Motivation………. i
Abstract……….. ii
Table of contents………... iii
List of Tables and Figures………...ix
Introduction……….….….. 1
Chapter 1 Literature Review Tourism….………..……….…… 2
1.1 General view of tourism………….……….……2
1.2 Portugal as tourism destination………..………3
1.3 International Academic Tourism………..………...7
1.4 Portugal as Academic tourism destination………...………...8
1.5 Student Mobility Programs……….………...10
1.6 Erasmus Process………10
1.7 Bologna Process………..………...16
Chapter 2 Destination Image 2.1 Role of Destination Image in Tourism Industry……….……….………...17
2.2 Impact of Destination Image on Tourist’s Perceptions…….……….…….…...18
2.3 Destination Image Formation and Structure………..……….…..……19
Chapter 3 Photography Tourism 3.1 Photography………..……….……….…..20
iv
3.2 Photography and Tourism………...…….………..….21
3.3 Photography and decision-making process of tourist……….………....22
Theoretical Framework of Photography in Tourism. 3.4 Photo Quality and Assessment…...……….….23
3.4.1 Hue and Scene Composition………...….24
3.4.2 Affective and Cognitive Organism in Tourism……….……...25
3.4.3 Link between Colour and Affective Organism………...…26
3.4.4 Link between Colour and Cognitive Organism………..…..26
3.4.5 Aesthetic Evaluation in Photography……….……..27
3.4.6 Visual Style of Processing……….…...27
3.4.7 Affective and Cognitive Organism and General Attitude………...28
Aerial Photography 3.5 Rising trend of Aerial Photography and use of UAV’S drones……….……. 28
3.5.1-Winged UAV for Military Usage / Unwinged UAV for Non-Military Usage……….29
3.5.2 Commercial benefits of UAV’s for companies………..…...29
3.5.3 Unwinged Drones Multi-copters and Quadcopters…….………..……29
3.5.4 Advantages of Aerial Photography by Drones……….……….30
3.5.5 Unwinged Drones for Aerial Photography……….………...32
Critical Analysis 3.6 Arguments against Photography……….…. 33
3.6.1 Market Analysis for Photography and destination Image formation……….……33
3.7 Achieving Sustainable Academic and Aerial Photography Tourism in Portugal……….37
Chapter 4
v
4.1 Methodology……...….………...38
4.2 Social Needs……….………..…...39
4.3 Economic Needs……….………...40
4.3.1 Economic Outlook………...……….………... 41
4.3.2 Life Quality Index………..………….42
4.3.3 Recent Macro Economic Development and Short-term Prospects………..…...43
4.3.4 Growth in Tourist Arrival………...…………...….44
4.4 The Environmental Needs………...45
Chapter 5 Business Model Plan 5.1 Mission Statement………..……….………... 45
5.2 Vision Statement……….…….………..….46
5.3 Business Description………..………..……...46
5.4 Business Operational Structure………...…46
5.5 The Business Model………..………...…47
5.6 The Canvas Model…….………..………...………...…..48
5.6.1 Business Model Pattern………..…...55
5.6.2 Unbundled Business Model Pattern………..…...56
5.6.3 Unbundled business model pattern for Pixair………..…....57
5.6.4 The Long Tail Business Pattern………..…...58
5.6.5 The Design Method………..58
5.6.6 The Empathy Map Customer Segment Relationship………..….59
5.6.7 Ideation Customer Driven, Offer Driven………...63
5.6.8 Customer-Driven for Pixair………..………...64
vi
5.6.10 “What If” Team composition………..……...66
5.6.11 Steps for designing a final business model plan for Pixair……….…...67
Chapter 6 Planning Strategy 6.1 Understanding the External Environmental Forces…………...……….…....68
6.1.1 Competitor Analysis………..………..69
6.1.1.1 Competitor Analysis of Drone Institutes………..70
6.1.1.2 Competitor Analysis of Drone Manufacturer………...75
6.1.2 Focus Group Discussion Research Design, Data collection………79
6.1.3 Focus Group Discussion Four Major Steps……….………...….80
6.1.4 Competitor and External Market Analysis Outcome……….….81
6.2 The Swot Analysis…….……….….………..…82
6.3 Pixair Swot Analysis ……….……….…….…….….84
6.4 Differentiated Strategy Planning………84
6.4.1 Activity Strategy Map……….85
6.5 Implementation of Strategies…………...………...86
Chapter 7 Process Method 7.1 Business Model Design Process………87
7.1.1Workplan………..………...88
7.1.1.2Milestones and Gantt Chart…….………...89
7.2 Financial Projections………...………..91
7.2.1 Financial Projections Bar Graph………....93
vii
7.3 Conclusion ………93
7.4 Limitations and Recommendations…….………..94
7.4.1 Future Research………..95
Bibliography………...96
Appendices Appendix.1………...108
Appendix.2…………..……….…...110
List of Tables and Figures: Table.1 Regional Results of Tourist arrivals……….…4
Table.2 Actual Tourism versus Tourism 2023 forecast………....5
Table.3 Portugal direct contribution of Travel and Tourism to GDP………...5
Table.4 Portugal Total contribution of Travel and Tourism to GDP………....6
Table.5 Portugal direct contribution of Travel and Tourism to employment………...7
Table.6 Comparison of expenses for International Students in Portugal………..9
Table.7 Erasmus + Annual report 2017………11
Table.8 International Student mobility response for Portugal………..12
Table.9 Erasmus student mobility statistics 2016……….13
Table.10 Outgoing number of students from Portugal and worldwide……….14
Table.11 Outgoing training staff mobility from Portugal and worldwide……….15
Table.12 Represent the area of studies of Audio/Visual and Media Production Students………16
Table.13 Winged UAV’S and Unwinged UAV’S………29
Table.14 Advantages of UAV for Aerial Photography………30
Table.15 Survey………34
viii
Table.17 Survey………35
Table.18 Survey………36
Table.19 Representing social needs OECD Portugal………39
Table.20 Social spending public % of GDP of OECD 2018……….40
Table.21 OECD Economic outlook GDP………..41
Table.22 OECD Product Market Regulation Indicators………42
Table.23 Better Life index……….42
Table.24 OECD Economic Outlook………..43
Table.25 Share of Exports by Sector and Destination………44
Table.26 Business Objectives………46
Table.27The Empathy Map Customer Segment………60
Table.28 The Trainers………61
Table.29 The Travel Agency……….62
Table.30 Competitor Analysis of Drone Institutes………70
Table.31 Competitor Analysis of Drone Manufacturers………75
Table.32Workplan……….88
Table.33 Gantt Chart……….90
Table.34 Financial Projections for Aerial Photography and Videography year (2019-2023)………..91
Table.35 Financial Projections for Number of students 8,10,15 for year (2019-2023)………92
Figure 1 Tourism..………..9
Figure 2 S-O-R Model………..24
Figure 3 S-O-R Model……….……...………..25
Figure 4 Aerial Photography Course………..………..31
Figure 5 Course Syllabus…….………..………..31
Figure 6 Customer Demand Cycle……….………..48
ix
Figure 8 Unbundled Business Model Pattern……….………...57
Figure 9 Customer Driven for Pixair…...……….64
Figure 10 Offer Driven for Pixair……….….………...65
Figure 11 The Environmental Forces………...68
Figure 12 The Swot Analysis………...82
Figure 13 Swot Analysis of Pixair……….………..84
Figure 14 Activity System Map.………..85
Figure 15 Business Model Design Process………..87
Figure 16 Milestones……….………...89
1 Introduction
This business plan is based on the idea of creating an Institute in Portugal in the field of Unmanned Aerial Vehicle (UAV) pilot training to trainers and professionals at beginning, intermediate and advanced levels for aerial photography, which plays an important role in the formation of destination image and promote sustainable tourism in Portugal.
The Business Plan of Pixair Institute which stands for “Pixels Resolution in Air” has the aim to fill the gap for the need for drone pilot training for “Aerial Photography,” which can be used to build a career in film making and videography, as well as to provide individual services for companies regarding the aerial photoaged, it also plays a major role for creating
Destination Image formation essential for promoting tourism in Portugal.
It also plays a major role in promoting “Academic tourism” in Portugal, by encouraging
student mobility and exchange programs, as well as encourage the students to study within
Portugal rather than going outside, by providing training and education facilities in this new emerging field of UAV pilot training and aerial photography at an affordable price, with expertise staff and certification resulting in a more sustainable tourism in Lisbon Portugal, by being beneficial economically, environmentally and socio-culturally.
The aim of this Business plan is to achieve Sustainable academic tourism in drone pilot
training as well as to promote destination image formation through the art of aerial photography and promote tourism of Portugal, which can be achieved through Pixair Institute.
Our Institute will provide the students and the photographers the opportunity to learn the skills and knowledge required for flying and capturing aerial photography, which can be used for enhancing their career, provide independent services or for professional photography.
2 Chapter 1
Literature Review
The focus of this chapter is to elaborate the literature linked to this research for a better understanding between the relation of tourist and photography (Lo, McKercher, Lo, Cheung, & Law, 2011). specifically, aerial photography and how photography can be used effectively for the formation of destination image for promoting their destination. To understand the broad perspective of tourism and academic tourism, destination image formation, photography in general, the theoretical framework and market analysis to see whether there is a link between all three components sustainable tourism, aerial photography and destination image formation.
1.1 Tourism
‘Etymology’ of the word tourist was first used by Griffiths, R. & Griffiths, G. E. (1772), and tourism by Douglas A. Harper in 1811. The word tour which is originated from the Latin word, ‘tornare’ and attained from Greek ‘tornos.’
Represents a lathe or circle; movement around a central circle or axis which was later spelt as ‘one’s turn’, whereas the suffix -ism is defined as ‘an action or process; while the suffix -ist represents ‘one that performs a given action’, when these words are aligned with tour it forms an act of moving around the circle where the starting and ending point is the same, similarly tour represents a journey in which there is a round trip.
Tourism Industry plays a major role in influencing a notable part of the economic and non-economic activities in developed and developing countries all over the world represented by
UNWTO, (World Tourism Barometer). The total International Tourism Arrival worldwide
is estimated to reach 1.4 billion two years ahead of the long-term forecast of UNWTO issued in 2010. The tourism industry contributes to the economy by providing significant benefits such as increased job employment, encouraging political legitimacy and deployment of economic capital. (Blanke & Chiesa, 2013; Nunkoo, 2015; Hesam et al., 2016; Saarinen, 2006). The focus of many tourist destinations for long term success is to create a strong destination image. (Ritchie & Ritchie, 1998; Caldwell & Freire, 2004). In order to increase the revenues and overall image of destination for tourism, the focus of managers and destination marketers is to create strong destination branding (Gretzel et al., 2006).
3
The tourism industry worldwide is facing huge competition growth (Blanke & Chiesa, 2013); as a result of this increased competition, there is a need for continuous innovative and differentiative services to attract customers and overtake competitors to provide a competitive edge for themselves, (Buhalis, 2000).
Many destinations nowadays are using strategies and Destination Marketing Organizations (DMO); to attract tourists and become irreplaceable tourist destination, (Pike & Page, 2014). In order to achieve this, it is important to use various marketing strategies to build a strong brand (Morgan et al., 2003).
According to tourists’ perception, a destination with a strong image and identity has higher preferability compared to other destinations with beautiful landscapes (Ilieș & Ilieș, 2015; Mao, 2008).
Governments also encourage tourism-related events as a source for regional development, as such events have the capacity to generate favorable commercial outcomes for host destinations (Van de Wagen, 2005; Getz, 2007), and within the last 20 years there is a significant difference in quality of life and regional differences with transition in various economies. (Bartlett et, al; 2010). The conventional belief and link between regional development and tourism can be seen long before in existing studies such as Sharpley & Telfer (2002), Rayan (2010) and Stabler et al. (2010).
1.2 Portugal as Tourism Destination
Portugal has experienced tourism long back since the 12th century, when Sintra and Evora were known as popular vacation sites for aristocrats, (Costa et al., 2014).
Tourism industry is playing a crucial role in the contribution of Gross Domestic Product of Portugal, over the last several years there has been a steady rise in tourist activity in Portugal, according to a report of UNWTO (United Nations World Tourism Organization World
Tourism Barometer, volume 17. 2019)i.
The number of international tourist arrivals in 2018 has increased by 6 % compared to 2017, whereas international tourism receipts have increased by 3.2%, and $17,119 million US dollars. Showing a gradual rise from $18,200 million US dollars to $21,200 million US dollars (UNWTO, tourism highlights 2019).
4
Tourism is the most productive sector of Portugal, representing a rise of (+11%) growth in receipts then in arrivals, (UNWTO, Tourism Barometer 2019), 10.4% in Travel and Tourism GDP creating 1/10 jobs which is 9.9% of global employment (WWTC, Economic Impact 2018). A direct contribution of Travel and tourism to GDP was €13.2 billion, 6.8% of total GDP in 2017, which is expected to rise 2.6% pa from (2018-2028). Total contribution of €33.5 billion expected to rise by 2.4% pa, 20.5% GDP in 2028, creating total employment of 20.4% of employment of (967,500) and is expected to rise by 1.3% pa to 1,151,000 in 2028, (World Travel and Tourism council 2018).
The tourism industry plays a strategic role in the economy, environment, and culture and can be considered soon to be the main contributor to the conservation of the natural environment of Portugal.
Since Portugal is in Southern Mediterranean Europe below in Table 1 are the statistics regarding the increased tourism arrivals and receipts, in comparison to Western Europe and Central Europe the Southern/Mediterranean Europe shows most recovery with leading countries such as Turkey, Italy and Spain with increased arrivals.
Table 1 International Tourist Arrivals and Receipts.
5 Table 2 Actual Trends Vs Tourism 2030 Forecast-World.
Source World Tourism Organization (UNWTO) January 2019 page 2 of 7.iii
We can see that in Table 2 there is a gradual rise in all, trend, actual and forecasted tourist arrivals, the trend tourist arrivals from 1995-2010 shows 525 million international tourist arrivals, whereas the actual international tourist arrivals from 1995 to 2019 were 1.4 billion and estimated to rise to 1.8 billion by 2030.
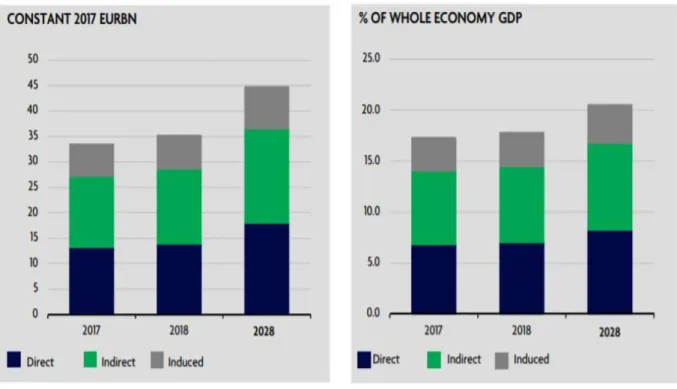
Table 3 Direct Contribution of Travel & Travel to GDP.
6 Table 3 represents the direct contribution of travel and tourism to GDP, and economic growth
of Portugal, and rose from 6 billion euro from 2008 to 13.8 billion euro in 2018 and estimated to grow to 18 billion euro by 2028. And % of whole economy GDP rose from 3.1% in 2008 to 7 % in 2018 and expected to rise to 8.2% by 2028.
Table 4 Portugal: Total Contribution of Travel and Tourism to GDP.
Source Travel & Tourism Economic Impact 2018 page 7 of 24.v
Table 4 shows the total contribution of Travel and Tourism to GDP was 33.5 billion Euro in
2017, which is expected to grow by 5.1% to 35.2 billion euro in 2018.
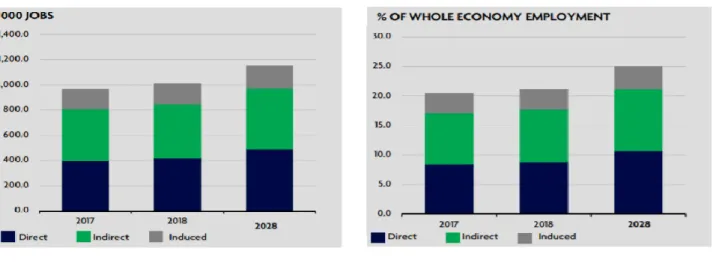
7 Table 5 Portugal: Total Contribution of Travel and Tourism to Employment.
Source World Travel & Tourism Council Economic Impact 2018 page 8 of 24.vi
Table 5 Represents the total contribution of Travel and Tourism in Portugal to employment,
and we can see a gradual rise in employment with passing years, direct rise in 2017 from o to 400,000 jobs, indirect rise from 400’000 to 800,000 and induced from 800’000 to 960,000 jobs. Whereas in 2018 its has reached to 1,000,000 plus and is expected to rise to 1,160,000 in 2028. Contributing to 25% of whole economy employment by 2028.
1.3 International Academic Tourism
Nowadays an increasing trend of student mobility for higher education is seen, where the students go to other countries for higher education other than their country of residence also known as “International Academic Tourism” from European and Non-European countries due to the easy access of student mobility programs, and scholarships available which provide students and researchers the chance to learn about new cultures, languages and gain new experience (Rodriguez et al., 2012).
There is a common belief that this type of distinct tourism is for all students of higher education institutes living outside their original destination for a time period of less than one year, with the main purpose of completing their degree level courses or language courses organized by these institutions.
8
The World Tourism Organization (WTO) which acts as a sub-organization of United Nations Organization, states that tourism is described as a travel for recreational, leisure, educational, health, business and other purposes [UNWTO statistics Guidelines: 2010].
UNWTO (United Nations of World Tourism Organization) defines tourists as individuals, “traveling to and residing in places outside their usual residential environment for not more than one consecutive year for leisure, business and other purposes” (International
Recommendations for Tourism Statistics 2008).
There are many factors for engaging in tourism activities and ways to determine what effects destinations interest, as stated by UNWTO’s declaration of “ and other purposes” in the definition of tourism mentioned above. However, globalization resulted in new trends rising in tourism sector compared to the conventional trends, and therefore academic tourism has experienced a steady rise in demand in recent years as a result of internationalization of education system itself (Munch & Hoch 2013).
It has been seen that in Europe academic tourism is promoted by offering more mobility programs or programs specially designed for international students, resulting in better economy due to the influx of visitors in the campus, more consumption of goods and services benefiting the economy. Academic tourism differs from conventional tourism based on few factors such as nature of stay and pattern of consumption of goods and services which are similar to the residents and the nature of accommodation is preferably shared apartments, hostels, bedsits with families etc., (Pawlowska & Martínez Roget, 2010; Pawlowska 2011).
1.4 Portugal as an Academic Tourism Destination
Globalization has resulted in easy mobility and more opportunities for students to study in countries other than their resident country. Similarly, the researchers and professionals seek to attain and exchange more knowledge and experience from each other in a multilingual environment, resulting in greater demand for International exchange programs in the universities and institutes.
However mostly for such events and conferences the time of formal communication and meeting is limited, resulting in the need for organizing social activities and tours for more interaction and exchange of knowledge, which is preferred by many researchers through social activities such as according to (Pelucio-Grecco MC, 2015: 4:2)“ I attended a congress in
9
Portugal, where the participants were shown tour sites, church and castle, resulting in great information being exchanged and future opportunities developed.”
According to Economic and Innovation Councilor of Lisbon city council (Graca Fonseca); “the current executive of Lisbon city has defined that one of her most important strategies is to have many collaborations with other universities to make Lisbon as one of the competitive cities for Academic tourism” (W Student Housing Review (PDF). (2013) Lisbon: Worx).
Lisbon city has 140,000 students currently residing in it and 16,000 researchers in various academic fields (Worx, 2013). The number of international students in universities in Portugal
rose by 30% from (2013-2017).vii
In 1994, The WTO described three forms of tourism in its recommendations on Tourism Statistics and can be described below as:
Figure 1 Different types of Academic Tourism.
Domestic Academic Tourism: where the resident students travel within the country for
academic purposes.
Inbound Academic Tourism: where the non-resident students travel in the given country
for academic purposes.
Outbound Academic Tourism: where the resident students travel outside the given country
for academic tourism.
Table 6 Comparison between student expenditure in UK and Portugal.
10 Table 6 represents a comparison between total budget of doing an MBA in UK and MBA in
Portugal, with a total difference of €9,600. Portugal being cost friendly in all aspects compared to UK (accommodation, other expenses and tuition).
1.5 Student Mobility Programs
In the last few decades there has been an increase in student mobility worldwide, which provides students the opportunity to study abroad and take their degree whether graduate or postgraduate and enhances student’s overall growth and competence building (Brandenburg, et. al., 2014; Cubillos & Ilvento, 2012; Douglas & Jones-Rikkers, 2001; House of Lords Select Committee, 2012; Jacobone & Moro, 2014; Findlay, A.M. and King, R. 2010; Messer & Wolter, 2007).
Student mobility provides opportunity to learn new languages, socialize, experience new culture and educational systems. The increase in student mobility programs, provided in the form of student grants, scholarships, etc., Play a big motivational role in student mobility, (Rodriguez et al., 2012).
1.6 Erasmus Process
“ERASMUS known as (European Region Action Scheme for the Mobility of the University Students) was founded in 1987, promotes student mobility with a constant rise in the number of students participating in exchange programs with the budget of €2.6 billion.
With an increase in funding of 13% compared to 2016, Erasmus provided student grants for training and studying abroad to 797,000, 84,700 organizations (Erasmus + Annual report
2017).
Erasmus program has supported 9 million people to study, train, volunteer and gain
professional experience since its inception in 1987 (Erasmus + Annual report 2017).ix
2017 was considered a successful year for International Dimension of Erasmus+ .
Where 23,000 higher education students from worldwide came. With total of 306 projects, with
2700 organizations for a budget of €146.8 million. In 2017 mobility was included in 65% of
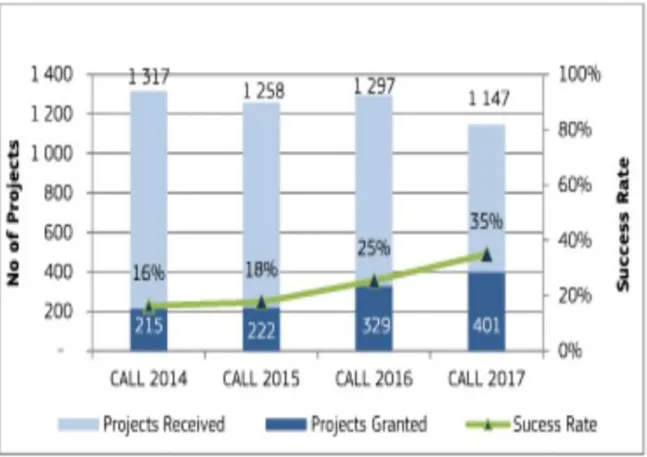
11 Table 7 Adult Education Trend between year 2014-2017.
Source Erasmus + Annual Report 2017 page 50 of 102.x
Table 7 represents the statistics for Projects received, Granted and the success rate. 16% projects were received in 2014 with a gradual rise to 35% in 2017, the projects granted also rose from 215 in 2014 to 401 in 2017 and a rise in success rate from 16% in 2014 to 35% in 2017.
Erasmus: is considered the first Facebook page in the field of student mobility with an
12 Table 8 International Students visiting Portugal.
Source Direção Geral de Estatísticas de Educação e.xi
Table 8 represents the international student mobility for Portugal, with total of 26,570 students in 2013/14 and 37,174 in 2016/17, which shows a positive trend and a rise for in incoming students to Portugal in the past years.
With the success of ERASMUS program there is a clear relationship between academic tourism and globalization, according to statistics the five top destinations which believe mobility programs have led to strengthened European attitude are Southern and Eastern Europe (each 85%), Bulgaria (90%), Portugal (89%) and Italy (87%), followed by the United Kingdom with 88% (Erasmus Impact Study Regional Analysis January 2016).
According to Erasmus + The Eu program for education, training, youth and sport (2014-2020), a total budget of €14.7 billion is allocated of which 2/3 budget is for learning opportunities abroad, whereas 1/3 budget is for partnerships and reforms of education and youth sector. Providing opportunity to 3.7% of young people within Europe, to tackle youth unemployment and support people with less opportunities. (European Commission, 2018. Erasmus + General Factsheet page 1 of 2).xii
However, the event organizers need to keep in mind that apart from organizing academic conferences, training workshops and higher education courses they need to build an attractive element to attract the academic tourists, by not only focusing on the quality of the sessions arranged but also keeping in consideration the facilities for the tourist’s sites and managing a good social network to attract them.
13
Resulting in the rise and promotion of academic tourism which is a great opportunity for the tourism industry as well as academic seekers and researchers worldwide and has a lot of potential for promoting destinations as well as entrepreneurs.
Table 9 Statistics of student mobility and exchange programs worldwide.re
Source Student Mobility statistics 2016.xiii
Table 9 represents the tertiary graduates from different countries worldwide, Portugal
representing 28% of inbound students from Europe, 26% from Oceania, 4% from North America, 32% from Caribbean, Central and South America and 11% from Asia. The greatest number of student mobility from Europe and lowest from North America.
14 Table 10 student mobility from different countries for year 2014-2017.
Source: The outgoing student number from Portugal as well as other countries.xiv
Table 10 Represents the outbound number to students from Portugal to other countries, 107
in 2014/15, 147 in 2015/16, 176 in 2016/17 and total cumulative of 430. Erasmus+ UK Higher Education Mobility
Table 5. Outgoing student numbers by host country
Host Country Code Study Work Total Study Work Total Study Work Total Study Work Total
Agrentina AR 0 0 0 3 0 3 4 0 4 7 0 7 Austria AT 208 134 342 213 94 307 232 134 366 653 362 1,015 Australia AU 0 0 0 8 0 8 2 0 2 10 0 10 Belgium BE 194 142 336 186 171 357 156 202 358 536 515 1,051 Bulgaria BG 2 25 27 2 22 24 7 31 38 11 78 89 Brazil BR 0 0 0 9 0 9 12 0 12 21 0 21 Canada CA 0 0 0 0 0 0 9 0 9 9 0 9 Chile CL 0 0 0 1 0 1 4 0 4 5 0 5 China CN 0 0 0 3 0 3 23 0 23 26 0 26 Cyprus CY 32 59 91 37 68 105 32 48 80 101 175 276 Czech Republic CZ 150 26 176 203 71 274 197 72 269 550 169 719 Germany DE 1,266 861 2,127 1,312 941 2,253 1317 1,004 2321 3,895 2,806 6,701 Denmark DK 267 41 308 322 69 391 355 89 444 944 199 1,143 Estonia EE 19 2 21 24 7 31 10 10 20 53 19 72 Spain ES 2,036 1,254 3,290 2,131 1,403 3,534 2153 1,614 3767 6,320 4,271 10,591 Finland FI 205 34 239 193 34 227 169 40 209 567 108 675 France FR 2,414 1,773 4,187 2,388 1,812 4,200 2173 1,700 3873 6,975 5,285 12,260 Greece EL 25 64 89 10 50 60 25 84 109 60 198 258 Croatia HR 17 2 19 17 2 19 12 7 19 46 11 57 Hungary HU 73 17 90 73 21 94 66 46 112 212 84 296 Ireland IE 55 209 264 54 251 305 51 289 340 160 749 909 Israel IL 0 0 0 0 0 0 2 0 2 2 0 2 India IN 0 0 0 0 0 0 4 0 4 4 0 4 Iceland IS 16 5 21 29 2 31 26 4 30 71 11 82 Italy IT 768 295 1,063 687 375 1,062 748 454 1202 2,203 1,124 3,327 Liechtenstein LI 1 3 4 0 1 1 0 5 5 1 9 10 Lithuania LT 2 14 16 4 18 22 8 38 46 14 70 84 Luxembourg LU 4 17 21 1 11 12 1 21 22 6 49 55 Latvia LV 3 13 16 6 8 14 2 11 13 11 32 43 Morocco MA 0 0 0 0 0 0 2 0 2 2 0 2 Montenegro ME 0 0 0 0 0 0 2 0 2 2 0 2 Macedonia MK 0 0 0 0 1 1 2 2 4 2 3 5 Macau MO 0 0 0 0 0 0 1 0 1 1 0 1 Malta MT 61 91 152 49 161 210 72 129 201 182 381 563 Mexico MX 0 0 0 1 0 1 2 0 2 3 0 3 Malaysia MY 0 0 0 2 0 2 13 0 13 15 0 15 Netherlands NL 650 224 874 701 285 986 840 349 1189 2,191 858 3,049 Norway NO 136 24 160 167 35 202 223 41 264 526 100 626 New Zealand NZ 0 0 0 0 0 0 2 0 2 2 0 2 Peru PE 0 0 0 1 0 1 0 0 0 1 0 1 Poland PL 64 20 84 69 34 103 75 51 126 208 105 313 Portugal PT 107 43 150 147 72 219 176 111 287 430 226 656 Romania RO 5 24 29 5 26 31 9 18 27 19 68 87 Serbia RS 0 0 0 0 0 0 2 0 2 2 0 2 Russia RU 0 0 0 1 0 1 8 0 8 9 0 9 Sweden SE 367 49 416 442 72 514 376 128 504 1,185 249 1,434 Singapore SG 0 0 0 1 0 1 0 0 0 1 0 1 Slovenia SI 23 4 27 17 7 24 18 8 26 58 19 77 Slovakia SK 11 1 12 5 5 10 4 20 24 20 26 46 Thailand TH 0 0 0 3 0 3 0 0 0 3 0 3 Turkey TR 68 14 82 78 21 99 25 10 35 171 45 216 Taiwan TW 0 0 0 0 0 0 4 0 4 4 0 4 United States US 0 0 0 1 0 1 34 0 34 35 0 35 Uruguay UY 0 0 0 0 0 0 1 0 1 1 0 1 South Africa ZA 0 0 0 0 0 0 2 0 2 2 0 2 Total 9,249 5,484 14,733 9,606 6,150 15,756 9,693 6,770 16,463 28,548 18,404 46,952 2014/15 2015/16 2016/17 Total Cumulative
15 Table 11 Outgoing number of staff for training from different countries year 2014-2017.
Source Represents the number of outgoing staff for training from Portugal as well as other
countries.xv
Table 11 represents outbound staff for training from Portugal in 2014/15 around 45, 2015/16 around 68 and 2016/17 around 50, showing a gradual rise in outbound academic tourism from 2014-2016, and a fall in 2016-2017.
Erasmus+ UK Higher Education Mobility
Table 4. Outgoing staff numbers by host country
Host Country Code Teach Train Total Teach Train Total Teach Train Total Teach Train Total
Albania AL 0 0 0 1 0 1 1 0 1 2 0 2 Armenia AM 0 0 0 0 0 0 2 0 2 2 0 2 Agrentina AR 0 0 0 3 0 3 1 2 3 4 2 6 Austria AT 34 24 58 36 29 65 21 30 51 91 83 174 Australia AU 0 0 0 0 0 0 1 1 2 1 1 2 Azerbaijan AZ 0 0 0 0 0 0 1 1 2 1 1 2
Bosnia and Herzegovina BA 0 0 0 1 1 2 6 2 8 7 3 10
Bangladesh BD 0 0 0 0 0 0 1 0 1 1 0 1 Belgium BE 49 21 70 50 55 105 46 33 79 145 109 254 Bulgaria BG 32 1 33 25 4 29 17 0 17 74 5 79 Brazil BR 0 0 0 2 0 2 6 3 9 8 3 11 Botswana BW 0 0 0 0 0 0 1 1 2 1 1 2 Belarus BY 0 0 0 0 0 0 2 1 3 2 1 3 Canada CA 0 0 0 0 0 0 0 3 3 0 3 3 Chile CL 0 0 0 1 0 1 4 1 5 5 1 6 China CN 0 0 0 6 1 7 33 25 58 39 26 65 Cuba CU 0 0 0 0 0 0 2 0 2 2 0 2 Cyprus CY 19 9 28 14 23 37 15 15 30 48 47 95 Czech Republic CZ 41 16 57 41 29 70 39 34 73 121 79 200 Germany DE 197 87 285 190 109 299 178 150 328 566 346 912 Denmark DK 40 34 74 46 40 86 28 58 86 114 132 246 Algeria DZ 0 0 0 0 0 0 1 1 2 1 1 2 Estonia EE 13 2 15 8 13 21 10 8 18 31 23 54 Egypt EG 0 0 0 0 2 2 2 5 7 2 7 9 Spain EL 50 7 57 56 15 71 51 23 74 157 45 202 Finland ES 151 86 237 164 178 342 155 217 372 470 481 951 France FI 110 75 185 101 80 181 86 110 196 297 265 562 Greece FR 147 45 192 124 67 191 138 94 232 409 206 615 Georgia GE 0 0 0 1 0 1 1 6 7 2 6 8 Croatia HR 10 3 13 8 4 12 7 5 12 25 12 37 Hungary HU 27 12 39 17 20 37 19 22 41 63 54 117 Indonesia ID 0 0 0 0 0 0 4 0 4 4 0 4 Ireland IE 4 12 16 9 15 24 16 26 42 29 53 82 Israel IL 0 0 0 2 0 2 2 4 6 4 4 8 India IN 0 0 0 6 6 12 11 10 21 17 16 33 Iceland IS 11 12 23 13 11 24 9 32 41 33 55 88 Italy IT 124 36 160 151 64 215 129 88 217 404 188 592 Jordan JO 0 0 0 0 0 0 0 1 1 0 1 1 Japan JP 0 0 0 2 2 4 0 6 6 2 8 10 Kazakhstan KZ 0 0 0 0 5 5 7 8 15 7 13 20 Lebanon LB 0 0 0 0 2 2 1 0 1 1 2 3 Liechtenstein LI 0 0 0 1 0 1 1 0 1 2 0 2 Sri Lanka LK 0 0 0 0 0 0 3 3 6 3 3 6 Lithuania LT 23 1 24 13 11 24 9 8 17 45 20 65 Luxembourg LU 0 3 3 0 0 0 2 1 3 2 4 6 Latvia LV 12 6 18 6 8 14 9 6 15 27 20 47 Morocco MA 0 0 0 0 0 0 1 2 3 1 2 3
Moldova (Republic of) MD 0 0 0 0 0 0 0 1 1 0 1 1
Montenegro ME 0 0 0 1 0 1 3 1 4 4 1 5 Macedonia MK 0 0 0 1 0 1 1 0 1 2 0 2 Macau MO 0 0 0 2 0 2 1 3 4 3 3 6 Malta MT 21 25 46 27 17 44 25 25 50 73 67 140 Malawi MW 0 0 0 0 0 0 2 0 2 2 0 2 Mexico MX 0 0 0 1 0 1 0 0 0 1 0 1 Malaysia MY 0 0 0 3 0 3 8 10 18 11 10 21 Netherlands NL 75 43 118 82 100 182 67 105 172 224 248 472 Norway NO 31 36 67 50 41 91 43 33 76 124 110 234 New Zealand NZ 0 0 0 0 0 0 0 1 1 0 1 1 Peru PE 0 0 0 1 0 1 1 0 1 2 0 2 Pakistan PK 0 0 0 0 0 0 0 1 1 0 1 1 Poland PL 53 9 62 57 20 77 46 25 71 156 54 210 Palestine PS 0 0 0 0 0 0 3 5 8 3 5 8 Portugal PT 28 17 45 41 27 68 24 26 50 93 70 163 Paraguay PY 0 0 0 0 0 0 1 0 1 1 0 1 Romania RO 15 7 22 15 16 31 25 7 32 55 30 85 Serbia RS 0 0 0 2 1 3 3 3 6 5 4 9 Russia RU 0 0 0 9 2 11 20 23 43 29 25 54 Sweden SE 60 49 109 53 64 117 42 74 116 155 187 342 Slovenia SI 16 3 19 19 9 28 14 20 34 49 32 81 Slovakia SK 1 7 8 5 3 8 7 1 8 13 11 24 Thailand TH 0 0 0 7 3 10 4 4 8 11 7 18 Turkey TR 29 9 38 27 12 39 13 7 20 69 28 97
Tanzania (United Republic of) TZ 0 0 0 0 0 0 0 2 2 0 2 2
Ukraine UA 0 0 0 1 0 1 5 11 16 6 11 17 Uganda UG 0 0 0 0 0 0 0 3 3 0 3 3 Uruguay UY 0 0 0 0 0 0 0 1 1 0 1 1 United States US 0 0 0 1 0 1 5 10 15 6 10 16 Uzbekistan UZ 0 0 0 2 0 2 3 2 5 5 2 7 Vietnam VN 0 0 0 0 0 0 3 3 6 3 3 6 Kosovo XK 0 0 0 0 0 0 3 1 4 3 1 4 South Africa ZA 0 0 0 0 0 0 3 1 4 3 1 4 Total 1,423 697 1,022 1,505 1,109 2,614 1,454 1,455 2,909 4,382 3,261 7,643 2014/15 2015/16 2016/17 Total Cumulative
16 Table 12 Outgoing number of students for Audio-Visual Techniques year 2014-2017.
Source The number of outgoing students in the field of audio/visual and media production
and represents the trend in the field of Photography.xvi
Table 12 represents outgoing number of students in field of media and audio/visual of 132 on
2014/15, 152 in 2015/16 and 144 in 2015/16, which shows an increase in demand for audio/visual and media production programs.
1.6 Bologna Process
Another student mobility program known as the ‘BOLOGNA’ process across European Institutes has also favored the inflow of academic tourism (Brenn-White & Van Rest, 2012).xvii
“Bologna Process was founded in 1999, by 29 European countries ministers responsible for higher education. However, it originally started in the Sorbonne Conference and Declaration
of 1998.”xviii It has been adopted by 48-member states and regarding ministerial meetings and
agreements by European countries has one objective “to ensure more proportionate,
consistent and rational higher education systems in Europe,”xix declared by (European Higher
Education Area EHEA). And focuses on 4 key points, “Implementation of key commitments,
learning and teaching, employability and social inclusion.”xx
Table 7. Outgoing student numbers by subject area Subject Area Description
Accounting and taxation 58 0.39% 46 0.29% 35 0.21% 139 0.30%
Agriculture 8 0.05% 0 0.00% 0 0.00% 8 0.02%
Agriculture, forestry, fisheries and veterinary 1 0.01% 0 0.00% 0 0.00% 1 0.00%
Agriculture, not elsewhere classified 2 0.01% 6 0.04% 6 0.04% 14 0.03%
Agriculture, not further defined 0 0.00% 5 0.03% 6 0.04% 11 0.02%
Architecture and construction 94 0.64% 0 0.00% 0 0.00% 94 0.20%
Architecture and construction, not elsewhere classified 5 0.03% 20 0.13% 21 0.13% 46 0.10%
Architecture and construction, not further defined 21 0.14% 85 0.54% 121 0.73% 227 0.48%
Architecture and town planning 95 0.64% 132 0.84% 102 0.62% 329 0.70%
Arts 172 1.17% 0 0.00% 0 0.00% 172 0.37%
Arts and humanities 129 0.88% 0 0.00% 0 0.00% 129 0.27%
Arts and humanities, inter-disciplinary programmes 80 0.54% 188 1.19% 76 0.46% 344 0.73%
Arts, not elsewhere classified 44 0.30% 81 0.51% 108 0.66% 233 0.50%
Arts, not further defined 52 0.35% 272 1.73% 495 3.01% 819 1.74%
Audio-visual techniques and media production 132 0.90% 152 0.96% 144 0.87% 428 0.91%
Biochemistry 57 0.39% 59 0.37% 76 0.46% 192 0.41%
17
The Bologna-programme has provided great support in legitimizing the universities to reach higher International standard, (Brenn-White & Van Rest, 2012). “results show that currently in Portugal there are approximately 362,000 students, of which 34% are from Lisbon, and 20% from Porto, around 37,000 foreign students responding to total rise of 10% from past, with majority coming from former Portuguese colonies, Spain and Italy ( Students Housing in
Portugal, CBRE 2018),xxito help “facilitate the exchange of students at higher education
institutions and degree programs depending on their personal preferences and skills sets” (Munch & Hoch 2013).
Once we have observed the trend of academic tourism and the role of student mobility in assisting the academic tourism, we will look closely into the factors that helps a student to choose the destination with good reputable institution, affordable price, course offered, and destination image. Below we will see in detail the role of destination image for tourism.
Chapter 2
Destination Image
2.1 Role of Destination Image in Tourism Industry
Destination Image has been one of the most researched topics over the past few years, and has been defined in various definitions and ways, Phelps (1986: p.168) describes “destination image is a sum of beliefs, ideas and impressions that a person has of destination”. Reynolds 1965:70 explains Image as the formation of mental expression derived from few impressions based upon information received.
In terms of Destination Image, the flood of information input is derived from external factors such as advertisements, brochures, social media, friends and family, magazines. Travel agencies, websites, news, documentaries, photographs, literature, movies, etc., Moreover by “visiting the destination itself, the image will be modified further based upon feelings and emotions from experience and information” (Echtner & Ritchie 2003: p.38).
Similarly Reynolds, (1965:p.70), states that the word “Image” often represents the reputation associated with it regarding ”what people believe about the institution or individual, versus character, what the individual or institution are in actual.” in terms of travel and tourism destination, there is an endless search on consumers side, (Leemans 1994: p.23 ).
18
Gathering all the information the consumer creates an “Image or Prototype” represents the travel experience, (Tapachai & Waryszak 2000: p.37), since tourism industry offers intangible services, the image plays a big role in promoting the tourism destination then the reality, (Gallarza et al.2002: p.57).
The overall destination Image demonstrated by information will play a big role in influencing the perceived destination Image by consumers. However, consumers also perceive Image based on certain attributes, functional consequences, and physiological characteristics which consumers often link with specific destination or service, (Echtner & Ritchie (1993): p. 4; Padgett & Allen (1997): p. 50; Tapachai & Waryszak (2000):p.38), and hence the demonstrated Image of destination affects both the destination Positioning and consumers buying behaviors.
2.2 Impact of Destination Image on Tourists’ Perception
The realm of tourism over the last few years is being one of the most studied and researched topics (Echtner & Ritchie, 2003: p.38, Stepchenkova & Morrison 2008, Pan & Xiang, 2011). Hunt (1975:1), defines Destination Image as “an image a person or persons hold regarding a state they do not reside in.”
Crompton (1979: p.18), describes “destination image as a result of perceptions, ideas or beliefs a person has of destination.” Phelps (1986:168) defines destination image as “perception of a place”, From the above definitions we can conclude that a destination image is based on the perceptions and ideas that are formed in a person’s mind based on different factors, knowledge and information collected represented or portrayed regarding the destination to tourists through various sources.
There are various approaches for the formation of a destination image, (Campo, Brea & Muñiz, 2011). Baloglu & Brinberg (1997) and other authors (e.g. Baloglu & McCleary, 1999), defines destination image as a conception based on two components, Cognitive and Affective.
Cognitive defines the information or knowledge a tourist has regarding the destination that is attained naturally or through external media.
The affective component that is based upon the feelings of tourists regarding the destination whether positive, negative or neutral. Echtner and Ritchie (1991, 1993), defines the destination image concept with the help of a three-dimensional framework based on (attribute – holistic,
19
functional-psychological and common-unique), the attribute features regarding the actual image whereas stereotype image is what a person perceives regarding a destination, and the functional features regarding the variance between measurable and intangible attributes of a destination.
2.3 Destination Image Formation and Structure
The destination Image can be formed based on two forms of information, naturally occurring which are often captured by non-tourism organizations such as Television, news, local people, geography etc., or induced that is captured by tourism organization for promotional purposes in the form of magazines, brochures, booklets, etc., Gunn (1972), and can be differentiated into structured that uses semantic differentials to measure attributes of images.
However, it fails to represent the holistic impression (Echtner & Ritchie, 1993) or unstructured and do not use any standardized scales. Instead, it uses a free approach to describe the complexity of the images by the respondents (Bovin, 1986). However, in order to avoid any false results, it is safe to use standardized scale and open-ended questions for measuring the destination image.
Tourism destinations use promotional and marketing communication strategy to influence destination image (Beerli & Martín 2004: p. 667; Fridgen 1984: p. 25-26; Gartner 1993: p.197-201). It is believed that destinations can impact image formation through secondary and indirect resources with consumers, also known as “vicarious experiences” (Kim & Richardson 2003), which plays a role inducing imagination such as Motion pictures, Tv shows, media, etc., (Cohen-Hattab & Kerber, 2004).
However, tourism promotions in-terms of destination image building is dependent on many other factors that are often seen as biased in nature and influence decision making as well as perceived images.
Baloglu and McCleary (1999: 869), focus on examining the relationship between image, behavior, destination Image and other variables such as destination preference and visitation intention, destination knowledge and preceding visitation experiences, the geographical location of tourists, nature of trip, situational or secular impact, image displayed by destination, and tourist’s sociodemographic characteristics.
20
A destination image can be build based on various factors and strategies, however the strategy focus on the tourism “product” created by the tourism development strategy using the authenticity and identity of the place, whether real or staged, (Cohen 1988; Cohen-Hattab & Kerber 2004; MacCannell 1973).
Building a tourism Image by using the marketing and communication or vicarious experiences also known as “induced destination image formation agents” Gartner (1993: p. 197-201). Which can be further enhanced with the help of internet. However, if the destination image formed fails to deliver the portrayed real destination’s identity it can create a tourism strategy gap.
Secondly, even before a tourist visits a destination an image can be perceived in their mind through advertisements and secondary place communications which can be resolved through person’s identity, (Baloglu & McCleary 1999; MacKay & Fesenmaier 2000; Sirgy & Su 2000), which can be due to situational influences or physically environmental, (Gartner & Hunt 1987), self-determining agents Gartner (1993: 201-203), interaction with customers directly or indirectly (Riedl et al. 2002) or can be the spontaneous or approached Organic Agents in Gartner’s terminology (1993: 203-204).
The above knowledge helps to build up tourist’s quality expectations regarding the destination, once the importance of destination image formation is known we will look closely into the formation of image and the role photography plays in its formation.
Chapter 3
Photography and Tourism
3.1 Photography
Photographs are often used as an essential tool by marketers and businesses to attracttourists
through the eye of the camera by capturing images and beauty of the destination in the form of brochures, travel websites, billboards, videos, vlogs. Similarly, it is also observed that tourists use photography as decision-making tool too while deciding for visiting a destination, representing a significant impact photographs have on tourism which results in marketers to invest more in this visual stimulation tool as part of their marketing tool and focusing on professional photographs, colors and techniques to attract tourists.
21 3.2 Photography and Tourism
The tourism industry requires exposure and destination image formation to represent the destination to tourists, as due to lack of knowledge regarding the destination it is hard for them to relate or get attracted to a place that’s when photography and videography places a huge role in destination image formation and promoting tourism states Madison (2010: 1).
Despite the universal benefits of photography in measuring tourists' experience (Urry, 1990, 1992), recently performing it (Dinhopl & Gretzel, 2016; Tribe & Mkono, 2017), the present tourism research still predominantly focuses on texts (Balomenou & Garrod, 2014).
Photography is seen as a fainted resource of research data for tourism, As in 1970’s and 1980’s many social scientists avoided considering visual data for their academic research for tourism, resulting in consistent reliance on textured data compared to visual data for academic research of tourism.
However, it has been seen that a tourist experience relies on elements of performance, (Haldrup & Larsen, 2009, 2001; Scarles, 2011,2012). Which are absent in other forms of search such as interviews, questionnaires, and observation (Latham, 2003).
Photographs are a legal way of inquiry not just along with text (Pink, 2013), and provides tourism researchers and companies with a different perspective to embrace the expression of experience (Bell & Davison, 2013; Emmison & Smith, 2000).
Although through photography the realization of few characteristic such as “the feeling,” cannot be demonstrated directly (Simpson, 2011), however other features such as “its descriptive and aesthetic features” works together as “equal music of rationality and emotion in their making” (Spencer, 2010: 202).
Thus, photographs are believed to achieve a multisensory effect for transmitting composite meanings as well as visualizing recognition. However, despite all the connections photographs tend to be underused in tourism research (Balomenou et al., 2017; Grimwood, Arthurs, & Vogel, 2015; Smith et al., 2015).
Travelling is often associated with the best memories of tourists; therefore, photographs are an essential part of most of the tourist’s activities done by tourists to capture those moments (Cederholm, 2004). Photographs are also believed to capture independent moments in time
22
(Rakić & Chambers, 2012), resulting in static images by interrupting the three-dimensional scenes of that time.
However, these images act as unnatural stimuli with the ability to access and arouse deep emotional reactions of the audiences (Goldstein, 2007). Technologies and social media inventions enabled photography to be viewed instantly by many people and made it an important factor for documentary and photography (Ferdous, 2014).
It is observed that tourism and photography are interlinked (Lo et al., 2011). Similarly, many tourist destinations attract the tourists by capturing beautiful destination images in the form of photographs (Jenkins, 2003) and is used by many marketers as a major marketing tool for attracting tourists. (Cederholm, 2004).
Websites provide a great opportunity for tourists to have visual information from them and see the destination images itself (Cao et al., 2010). It is seen that visual colors and images of a photograph also plays a major role in advertisement recognition (Percy & Rossiter, 1983).
3.3 Photography and decision-making process of tourists
Photographs are seen to play an important role in the decision-making process of tourists, influencing their behavior and indicating the satisfaction of tourism places (Garrod, 2008,2009). Various photographs can represent various angles and attractions of tourist destination such as some photographs represents the natural landscapes and scenic architecture (Shavely et al., 2006).
Some represent wonderful scenery and geographic locations (Cao et al., 2012). While some use graphic effects and various lightening to attract tourists (Lynn et al., 2013). However, there is still ongoing research done to prove the strength and capability that different photographs have on tourist behavior of decision making.
Although it is seen that professional photographs influence tourism decision making, but due to the lack of knowledge regarding which specific elements of photographs (angles, colors or effects) attracts and lead to tourism motivation might result in limited outcome.
Some researchers such as (Luo et al. (2011), proposed a Photo Quality Assessment with the help of global feature which portrays the quality of landscape photograph using Hue composition and Scene composition, to determine the aesthetic evaluation on the reaction of
23
tourists towards photographs (Galanter, 2012). In order to convey the destination image in the most competitive way to attract tourists, marketers need to aim for photographs representing the best view and image of the destination to attract tourists (Tuohino & Pitkanen, 2004). It is seen that every element of a photograph has an emotional influence on a tourist, whether it is the technique of capturing the colors, composition, the media used or the scenery (Albers & James, 1988).
Travel and Tourism Businesses spend a lot of budget every year to advertise and promote their travel destination by creating a competitive edge and brand awareness (Ali Shah & Akbar, 2008). However, due to the lack of effective photographs used for advertisements, the overall efficiency and money invested for advertisement can fail and go in vain.
Up till now, there is very minimal research done on photography, especially aerial photography and its link to consumer behavior perspectives, and on the view of tourists. Therefore, the intention of this research is to examine the impact of Aerial Photography on tourists’ intentions for destination image formation whether for pleasure or academic purposes, by analyzing the difference between tourists or consumers perspective towards visiting Portugal when viewing a normal photograph and aerial photograph.
The previous paragraph provides general information and background regarding the link between photography and tourism, later in this paragraph, we will see more detailed literature review, broad perspective of theoretical framework, photography in tourism and tourists’ perspectives regarding aerial photography or normal photography for destination image formation in the form of surveys.
Theoretical Framework of Photography in Tourism 3.4 Photo Quality and Assessment
If we look at S-R Model, which focuses on Stimulus-Response (Mehrabian and Russell, 1974), later proposed a well-known model known as Stimulus-Organism-Response (S-O-R), in which the model focuses on Consumer Behavior on various aspects (Chang et al., 2011, Kim & Lenon, 2013, Thang & Tan, 2003).
A Stimulus is seen as an external factor or view consisting of (time and space) and (elements or objects) that belong to those situations (Belk, 1975, 2011). Stimulus is believed to have a
24
direct effect on human perceptual thinking and physiological feeling which is called organism (Bagozzi, 1986).
Representing the overall behavioral response as final action according to S-O-R Model. (Mehrabian & Russell, 1974).
Figure 2 S-O-R Model
Source: Situational Variables and Consumer Behaviours, Journal of consumer research.xxii
Belk (1975b) extended SOR concept by dividing the stimulus construct in two separate dimensions; situations and objects.
Situation Time Combination Situation Space Behavioral
Situation reflects the relation between a holistic environment at a time, whereas objects are elements that represent the consumer's response, and is a significant source of behavior influence (Belk, 1975a,2011). Hence all the situations representing time, space and objects affect the organism and produces a response due to internal reaction.
3.4.1 Hue and Scene composition
Differentiates the theoretical framework of Belk (1975b, 2011), based on stimulus
Time: aerial photographs taken at different times of the day, and night for comparison. Space: beach seen geographically as space.
Situation: is represented by destination images.
Object: will be used to determine the color tones of the photographs.
25 Figure 3 The revised S‐O‐R model by Belk (1975b).
Response
Source S-O-R Model.xxiii
*Luo et al. (2011), focused on content-based quality assessment and proposed a model to measure the quality assessment of landscape photographs. Whereas the regional features focus on clarity of subject area and its background, Global feature focus on hue and scene composition all these components play a role in capturing image and destination image formation.
Hue composition focuses on color composition schemes and is considered an element of
landscape photographs (Luo et al., 2011).
The color design process focuses on selecting objects of the same color scheme tones or
provided the option of selecting contrast colors by selecting different color scheme tones (Tokumaru et al., 2002). Example of hue composition can be explained as taking multiple photographs at different times of the day in various color tones representing a byproduct of the time of the day with varied quality of the photograph, whereas scene composition focuses on spatial structure and semantic lines of the photograph for attracting audiences (Luo et at., 2011).
3.4.2 Affective and cognitive organism in tourism
Affective and Cognitive organisms have been lately studied a lot and supported by a lot of literature (Gross, 2002; Michel & Shoda, 1995; Oliver, 1993) representing that tourism destinations have both affective and cognitive components and Tourists respond affectively and cognitively to a travel destination (Baloglu & Brinberg, 1997).
Decrop (1999), states cognitive component as an internal process of brain activity relating the internal processing believing and understanding which promotes learning & attitude.
Organism
Situation•
26
Whereas Affective component shows the internal feelings and emotions of people associated with products and travel destinations, affective & cognitive components play a significant role in forming destination image and attracting tourists (San Martin & Del Bosque, 2008). It is believed that “tourists travel for pleasure” which states a feeling of happiness and represents human emotions and gestures (Mogilner et al., 2012), plays a major role in affecting their emotions and choices. Because they tend to make choices when they are happy and tend to select those products that provide them happiness, relaxation, and peace. (Mogliner et al., 2012) states happiness as a by-product of excitement and relaxation.
The cognitive component represents information from tourists representing their belief, understanding, and perception (Decorp, 1999).
Pearce (2011) explain the various motivations for tourist travel. (Baloglu & Brinberg, 1997), states that affective component is more powerful compared to the cognitive component for tourism destination.
3.4.3 Link between color and Affective Organism
(Babin et al., 2003), states that every color tone differs from each other due to various wavelengths which emit different hues and can secrete effective factors which result in various emotional responses. Therefore, the photographers use the colors and tones of photographs in an artistic way to provoke the emotions and moods of the viewers through their artwork (Luo et al., 2011). Hence the professional photographers focus on manipulating the specific colors to bring the desired results and photographs required for attracting tourists and forming destination image (Luo & Tang, 2008).
3.4.4 Link between color and Cognitive organism
Professional photographers spend a lot of time to find the perfect angle and location to capture the desired color tone for perfect photograph (Simon, 2011) and manipulate the viewers (Gallagher et al., 2004). Photographs tend to be influential by portraying nature and realism and could make people deviate from stress (Goldman & Papson, 1996).
27 3.4.5 Aesthetic Evaluation in Photography
According to (Crilly et al., 2004), people demonstrate aesthetic impressions, and might take an impression of them aesthetically by finding them visually attractive for example many tourists by looking at destination images of Portugal might find it attractive tourist place compared to other destinations which can be positive or negative depending on the neuro-esthetic circuits in human brain (Calvo-Merino et al., 2010). Moreover, can rate the stimulus object aesthetically into various categories such as attractive/unattractive, beautiful/not beautiful, pleasing/unpleasing, relaxing/not relaxing (Lam & Mukherjee, 2005).
Neuroesthetics circuits play a big role in providing aesthetic impression towards stimuli by activating the ability to judge, evaluate and interpret effectively (Calvo-Merino et al., 2008). However, it varies for different photographs such as landscape photographs angles and techniques for capturing, various color tones, light, and composition.
All is believed to create aesthetic perceptions (Datta et al., 2006). It is believed that in tourism industry beach photographs are considered most attractive amongst the tourists (Phillips & House, 2009), and are believed to be the top cognitive features to attract tourists to travel to destinations (Baloglu & Mangaloglu, 2001). Hence many destinations consider such attributes to create destination images of beautiful places and attract tourists to travel and re-visit their destinations again (Rittichainuwat et al., 2001).
3.4.6 Visual Style of Processing
There are various styles and ways people process information some are better at visual while others are better at verbal processing (Ramsey & Deeter-Schmelz, 2008), different individuals have varied cognitive styles to process information, visualizer and verbalizer are the two main styles understudy and contribute to the discipline (Kozhevnikov et al., 2005). That’s why we are exposed daily to verbal and visual style of marketing to determine the consumer's way of processing information (Ramsey & Deeter-Schmelz, 2008), and while considering photography it is essential to focus on style of processing and angles and lights that play a significant role in influencing.
28 3.4.7 Affective & Cognitive Organisms and General Attitude
As mentioned earlier above colors and objects both play a significant role in demonstrating as external stimuli and attract tourists to visit the destinations (Josiam et al., 1999). Pike & Ryan 2004 states the importance of cognitively develop information and affectively evaluate it for destination positioning as they both play a major role in attracting tourists and influencing their choice and attitude (Del Bosque & San Martin, 2008). Attitude can be described as a response to a person, object or other choices or agreement and disagreements that influences the behavior of a person (Hassanein & Head, 2007).
Kim & Morris (2007), states consumers tend to respond more positively towards affective construct compared to cognitive construct in terms of attitude. (Huang and Hsu 2009) show a positive connection between affective factors such as pleasure and enjoyment and attitude variables, or one of the push factors to influence the tourists to seek opportunities to visit other unique destinations (Kim 2007). To seek pleasure and relaxation which is considered as motivation for travel (Pearce & Lee, 2005; Rojek 1993). And hence making escape as one of the travel motivations as a cognitive dimension of attitude.
Aerial Photography
3.5 Rising Trend of Aerial Photography and the use of UAV’S drones
Drones are aerial robots that carry visual sensors, navigation systems, cameras and sometimes even equipped with weapons. They come in all shapes and sizes and with various names known as remotely piloted aircraft or unmanned aerial vehicles or drones. Unmanned Aerial Systems (UAS) are the aircrafts that can fly without pilots or manned crew and can be programmed to “Auto Pilot” systems to fly a safe flight, UAV and Drones all are identified under same category, that are designed to fly a route autonomously or designed to be flown a route remotely by external pilot. The idea of building UAV generated since World War 1 and World War 2, and initially were operated through TV and Radio signals, and then eventually adopted a more strategic approach to form better remotely operated versions of UAV.
UAV acts as a source for providing information worldwide instantaneously and can be used to deliver things or to be reused and equipped with different implements. UAV’s are operated by pilots on the ground and can be operated through several different spots at varying distance and fly a pre-designed route by autopilot system.