Received March 31, 2010 and accepted April 13, 2011. Corresponding author: luciano_lslima@hotmail.com
Composition and fatty acid profile of milk from cows on pasture subjected
to licuri oil supplement
1Luciano dos Santos Lima2, Ronaldo Lopes Oliveira3,7, Adriana Regina Bagaldo4, Américo Fróes Garcez Neto5, Cláudio Vaz Di Mambro Ribeiro3, Dante Pazzanese Duarte Lanna6
1Pesquisa financiada pela FAPESB.
2Programa de Pós-Graduação em Ciência Animal nos Trópicos, UFBA. 3Departamento de Produção Animal, UFBA, Salvador, BA.
4Centro de Ciências Agrárias, Ambientais e Biológicas, UFRB, Cruz das Almas, BA. 5Laboratório de Nutrição Animal/UFPR, Palotina-PR.
6Departamento de Nutrição e Crescimento Animal, ESALQ, Piracicaba, SP. 7 Bolsista do CNPq.
ABSTRACT - The objective of this study was to determine the best level of oil licuri concentrate on dairy cows. The best level was determined through an analysis of the milk’s chemical composition and fatty acid profile. Sixteen lactating cows from the Holstein × Zebu cross breed kept on Tanzania grass pastures were divided into four 4 × 4 Latin squares, which were formed by four experimental periods of 21 days. The 21-day experimental periods were divided into 17 days for adaptation and four days for collection. Cows received three kg of concentrate per day, at the time of milking. Treatments consisted of four types of feed containing the following levels: 0, 1.5, 3.0, and 4.5% inclusion of dry matter (DM) licuri oil concentrate. The licuri oil levels changed the fatty acids’ profile with a linear increase in the short-chain fatty acid and medium and linearly reduced the concentration of LCFA. The highest level of licuri oil was 4.5% of DM concentrate, which changed the composition of milk through an increase in the percentage of fat and total solids. This result is of prominent notice to the dairy industry.
Key Words: licuri, lipids, ruminants
ISSN 1806-9290 www.sbz.org.br
Introduction
The evaluation of new animal feed ingredients must be conducted to generate more information, to increase food options and mainly to focus on regional characteristics of raw material production to reduce the cost of feed and the likely environmental impacts (Macedo et al., 2008).
It is within this context that several studies (Rossato et al., 2009; Costa et al., 2009; Fernandes et al., 2009; Santos et al., 2009) have aimed to improve the nutritional composition of foods, mainly those of animal origin, intended for human consumption. The fatty acids (FA) profile is important in determining milk quality because both its quantity and food’s lipid composition have a great influence on human health (Nörnberg et al., 2006). However, when using the lipid supplement it is possible to achieve the same goal without compromising the animals’ health; also, it is possible to produce modifications in the milk’s fatty acid depending on the lipids used (Kay et al., 2006). Additional lipids can alter milk composition and physicochemical characteristics, such as those with high levels of saturated fatty acids (SFA). The supplement of diets with oils may have different results in the production and milk
composition as well as in the levels of proteins, fats, total solids and other milk components (Baumgard et al., 2007; Palmquist & Jenkins, 1980). Many studies have been conducted in this research area in recent years (Rossato et al., 2009; Costa et al., 2009; Fernandes et al., 2009; Santos et al., 2009).
Licuri [Syagrus coronata (Martius) Beccari] is a major
palm from the semiarid region of northeastern Brazil and is well adapted to the savanna regions. It has a great potential in terms of food, ornamentation and animal feed. However, this culture is still explored in extraction. According to Crepaldi et al. (2001), nutritional analysis of licuri fruit reveals a noticeable the lipid content (49.2% of the fruit pulp). Because information on the licuri is scarce or nonexistent in the literature and due to its occurrence in the Brazilian Northeast, it is important to understand the effects of using extracted oil from this fruit in animal feed (Silva et al., 2011; Silva et al., 2010; Borja et al., 2010). The objective of this experiment was to find the optimum level of licuri oil supplement (0.0, 1.5, 3.0 and 4.5% of dry matter) for dairy cows and to determine the chemical composition parameters, the milk fatty acid profile, the atherogenicity index and the relationship between fatty acids.
Material and Methods
The experiment was conducted between June and September 2007, on the Fazenda Experimental of Universidade Federal da Bahia (12° 23' 57.51" S, 38° 52' 44.66" W) in the municipality of São Gonçalo dos Campos, Bahia, which is located 108 km from Salvador, in the north-central region of Bahia and micro-region of Feira de Santana (Recôncavo).
The total area of the experiment was 8 hectares, consisting of Panicum maximum cv. Tanzania I pastures,
which were divided into 10 paddocks of 8000 m2 and surrounded by electrified wire. All of the paddocks contained troughs for the mineral mixture supply and water. The pasture was managed in a rotational system, with four days of occupation and 36 days of rest. This rotation system respected the average forage supply of 10% of the body weight in dry matter (Table 1), through a put and take system, in which the regulating animals were used to maintain the desired supply. A reserved area of 3 ha was used for the regulator animal’s inhabitance. The monitoring of pasture DM availability was performed with ten random releases of a square with an area of 1 m2 in the paddock before the animals’ entry and exit. The difference in the amount of forage in the animals’ entry and exit was used to determine the rate of grass growth, which is necessary for the calculation of the load adjustment. Sixteen multiparous lactating cows were used. These cows were Holstein × Zebu crossbreds with an average weight of 500±72 kg. They were
also between the 45th and 90th days of lactation and were identified by ear rings. The cows had an average production of 8 liters of milk/day and were divided into four 4 × 4 Latin squares (four treatments × four periods × four animals in each treatment). The experiment was divided into four experimental periods of 21 days that consisted of 17 days of adaptation and 4 days of data collection.
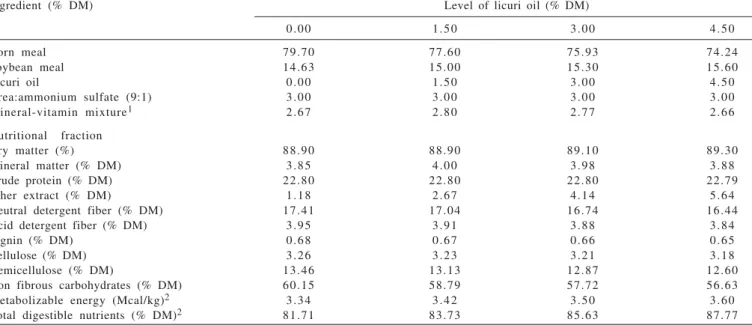
The treatments were levels of licuri oil in concentrate compounds that also contained corn meal, soybean meal and urea. The addition of licuri oil was done in levels of 0.0, 1.5, 3.0, and 4.5% in the dry matter concentrate (DM) (Tables 2 and 3). The supplements were balanced to meet the cows’ nutritional requirements according to the National Research Council (NRC, 2001). Three kilograms of concentrate supplement/cow/day were offered, divided into two meals a day (at 6 a.m. and 16 p.m.).
The animals were mechanically milked twice daily (at 6 a.m. and 16 p.m.), when they received the concentrate diet. In the last four days of each experimental period, the milk production was evaluated.
To analyze milk chemical composition, 150-mL samples were collected at each milking of each animal. These samples were then packed in previously identified plastic bottles and sent to the Laboratório de Inspeção e Tecnologia do Leite, EMEV/UFBA. For each sample, the crude protein, fat and total solids were evaluated by an infrared analyzer (BENTLEY, 2000). The content of the dry extract solids were obtained by subtracting the percentage of the fat in the percentage of the total solids.
To analyze the milk fat’s fatty acid profile, a sample was collected from each animal per milking, which was subsequently frozen and analyzed at the Laboratório de Nutrição e Crescimento Animal, Escola Superior de Agricultura Luiz Queiroz (ESALQ), USP.
In determining the concentrates’ fatty acid profile, feed ingredients and forage, the method described by Rodriguez-Ruiz et al. (1998) was applied. Then, the fatty
Item Experimental period
1st 2n d 3rd 4th
Forage mass (kg DM/ha)1 8 9 8 7 7 4 2 4 7 4 4 8 6 3 8 0
Forage offer (% DMLW)2 10.30 10.36 10.34 10.07
1Kilograms of dry matter per hectare; 2Dry matter live weight percentage. Table 1 - Forage mass and offer supplies available during the
trial periods for lactating cows subjected to licuri oil supplement
Chemical composition Ingredient
Corn meal Soybean meal Licuri oil Extrusa
Dry matter (%) 88.80 88.55 100.00 33.76
Mineral matter (% DM) 0.35 6.18 0.00 9.80
Crude protein (% DM) 8.94 49.72 0.00 12.02
Ether extract (% DM) 1.10 2.10 100.00 1.51
Neutral detergent fiber (% DM) 19.77 11.29 0.00 73.77
Acid detergent fiber (% DM) 3.46 8.16 0.00 41.06
Lignin (% DM) 0.74 0.65 0.00 10.61
Cellulose (% DM) 2.71 7.51 0.00 30.45
Hemicellulose (% DM) 16.32 3.12 0.00 32.71
Non-fibrous carbohydrates (% DM) 69.83 30.71 0.00 2.89
acid profile was estimated by gas chromatography that used a 100-m capillary column of fused silica (CP-Sil 88), hydrogen as carrier gas (1.0 mL/min), a flame ionization detector (FID), an injector temperature at 250 oC and a detector at 300 oC and a samples injection ratio of 50:1. The protocol race started with 70 oC and was maintained for four minutes, then raised 13 oC/min up to 175 oC and was maintained for 27 minutes, followed by another rise of 4 oC/min up to 215 oC and maintained for over 9 minutes, and finally an elevation of 7oC/min to 230 oC and was maintained for another 5 minutes.
In determining the profile of fatty acids in milk fat, the lipids were extracted by a mixture of organic solvents (hexane:isopropanol) as described by Hara & Radim (1978). The lipid fraction was methylated with a basic solution of methoxide sodium, according to Christie (1982), with adaptations by Chouinard et al. (1998). The changes were introduced to reduce the oxidative processes during the process of extraction and hydrolysis as well as to improve the hydrolysis of the milk fat’s phospholipids. The fatty acid profile was determined by gas chromatography using a 200-m capillary column of fused silica (Varian CP-2571), hydrogen as carrier gas (1.8 mL/min), a flame ionization detector (FID), an injector temperature of 250 oC, a detector temperature of 300 oC, and samples injection ratio of 20:1. The race protocol for the milk’s fatty acids began with 100 oC and was kept for seven minutes, then raised 10 oC/min to 165 oC and was continued for five minutes followed by
another increase of 0.5 oC/min to 210 oC and maintained for another 10 minutes, and finally an elevation of 5 oC/min to 240 oC and maintained for another five minutes. The identification of fatty acids occurred by comparing their retention times with those observed in the trade patterns (C4-C22), as the 18,919-1AMP - Supelco, methyl ester mixture of 37 fatty acids, and standard butter (CRM 164 -Commission of the European Community Bureau of Reference, Brussels, Belgium).
The fatty acids were estimated by the means of pure commercial standards: 05632 - SIGMA, methyl ester mixture of conjugated linoleic acid cis-9, trans-11 and trans-10, cis-12; V1381 - SIGMA, acid methyl ester vaccenic;
D2659 - SIGMA-methyl ester of docosahexaenoic acid
cis-4, 7, 10, 13, 16, 19 (DHA), E2012 - SIGMA-methyl ester
of eicosapentaenoic acid cis-5, 8, 11, 14, 17 (EPA). A
standard butter reference (CRM 164) was also used to calculate the recovery factors of the short-chain fatty acids. From the fatty acid profile, the atherogenicity index (AI) was calculated, as proposed by Ulbricht & Southgate (1991), to relate the profile of fatty acids with the risk of cardiovascular disorders, through the equation:
IA = [C12:0 + (C14:0 × 4) + C16:0] / (Total unsaturated fatty acids)
where: C12 = the percentage of lauric acid in relation to TFA; C14 = the percentage of myristic acid in relation to TFA; and C16 = the percentage of palmitic acid in relation to TFA.
Ingredient (% DM) Level of licuri oil (% DM)
0.00 1.50 3.00 4.50
Corn meal 79.70 77.60 75.93 74.24
Soybean meal 14.63 15.00 15.30 15.60
Licuri oil 0.00 1.50 3.00 4.50
Urea:ammonium sulfate (9:1) 3.00 3.00 3.00 3.00
Mineral-vitamin mixture1 2.67 2.80 2.77 2.66
Nutritional fraction
Dry matter (%) 88.90 88.90 89.10 89.30
Mineral matter (% DM) 3.85 4.00 3.98 3.88
Crude protein (% DM) 22.80 22.80 22.80 22.79
Ether extract (% DM) 1.18 2.67 4.14 5.64
Neutral detergent fiber (% DM) 17.41 17.04 16.74 16.44
Acid detergent fiber (% DM) 3.95 3.91 3.88 3.84
Lignin (% DM) 0.68 0.67 0.66 0.65
Cellulose (% DM) 3.26 3.23 3.21 3.18
Hemicellulose (% DM) 13.46 13.13 12.87 12.60
Non fibrous carbohydrates (% DM) 60.15 58.79 57.72 56.63
Metabolizable energy (Mcal/kg)2 3.34 3.42 3.50 3.60
Total digestible nutrients (% DM)2 81.71 83.73 85.63 87.77
1Guaranteed levels (per kg of product): calcium – 200.00 g; phosphorous – 60.00 g; magnesium – 20.00 g; sulfur – 20.00 g; sodium – 70.00 g; potassium – 35.00 g; copper – 700.00 mg; iodine – 40.00 mg; cobalt – 15.00 mg; iron – 700.00 mg; manganese – 1,600.00 mg; zinc – 2,500.00 mg; selenium – 19.00 mg; chromium – 10.00 mg; fluoride (max) – 600.00 mg; vitamin A – 200,000.00 U.I.; vitamin E – 1.500.00 U.I.; vitamin D3 – 50.000.00 U.I.
2Estimated according to the NRC (NRC, 2001).
The ratios between total unsaturated fatty acids (Insat) and saturated (Sat) and omega-6 (n-6) and
omega-3 (n-3) were also calculated. The fatty acid profiles
of the concentrates and extrusas were analyzed by gas chromatography in the Laboratório de Nutrição e Crescimento Animal, Escola Superior de Agricultura Luiz Queiroz - USP (Table 4).
The experiment was designed in four Latin squares (4 × 4), each one with four animals, four periods and four levels of licuri oil in the concentrate. The data were subjected to analysis of variance and regression, using the GLM (General Linear Models) procedure of the SAS 9.1.2® statistical program (2004) and adopting a significance level of 5%.
Results and Discussion
The results of the milk’s physical and chemical analyses found in this study (Table 5) are within the range of values recommended by the Regulamento de Inspeção Industrial e Sanitária de Produtos de Origem Animal (BRASIL, 1980). This finding shows that milk characteristics do not change when cows on pasture consume licuri oil concentrate. Therefore, cows produce milk with a normal composition, as described by the law, which can be used by the dairy industry.
The linear increase (P<0.05) in daily milk production (Table 5) is the result of the cow’s higher intake of the concentrates, stimulated with increasing levels of licuri oil supplement in this experiment, that even without increasing DM intake, promoted better DM and EE digestibility. A higher intake of concentrates probably provided an increased synthesis of propionic acid, which is a precursor of glucose. Glucose, in turn, is related to the synthesis of lactose, which is responsible for the increase in the volume of the milk produced (Costa et al., 2009).
There was a linear increase (P<0.05) in milk fat when the cows were fed licuri oil; this result is due to increased activity of the enzyme complex fatty acid synthase because this oil has in its composition 83.02% of fatty acids of short and medium chains, which may have stimulated the enzyme activity in the mammary gland. The milk fatty acids are synthesized in three ways: de novo synthesis, mobilization of body fat and fatty acids from the bloodstream. The AG, up to 14 carbons, are formed from the de novo synthesis and palmitic acid is derived from the three previous mechanisms (Grummer, 1991). The long-chain fatty acids are absorbed into the bloodstream and can be metabolized in the mammary gland. According to Palmquistand Jenkins (1980), the de novo synthesis of milk fat from ruminants can be enhanced when the lipid source is composed mostly by short-chain Fatty acids Licuri oil level (% DM) Extrusa
0.00 1.50 3.00 4.50
C6:0 0.00 0.03 0.05 0.08 0.00
C8:0 0.00 0.45 0.52 0.54 0.00
C10:0 0.03 0.37 0.71 1.14 0.93 C12:0 1.65 3.96 9.48 15.54 2.21 C14:0 0.52 3.23 5.88 6.90 2.85 C15:0 0.04 0.03 0.05 0.05 0.31 C16:0 34.02 23.92 19.54 15.80 5.47 C16:1 n-9 0.05 0.07 0.07 0.09 0.00 C18:0 7.38 6.95 5.20 4.69 9.43 C18:1 t-6 0.13 0.17 0.03 0.02 0.00 C18:1 c-9 29.97 33.04 29.29 26.47 4.47 C18:1 c-11 1.57 1.33 1.44 2.41 1.89 C18:1 c-12 0.80 0.89 1.04 1.26 1.27 C18:1 c-13 0.38 0.51 0.70 2.03 0.31 C18:2 n-6 21.97 22.70 22.91 19.38 4.70 C18:3 n-6 0.86 0.54 0.38 0.26 40.58 C18:3 n-3 0.44 0.39 0.37 0.29 17.05 CLA1 0.00 1.25 2.11 2.77 8.31
C20:3 0.19 0.20 0.25 0.28 0.22
1 Conjugated linoleic acid.
Table 4 - Concentrate profiles and extrusa fatty acid profiles, as percentages of the total fatty acids
SEM = standard error of the mean; R2 = coeficiente de determinação.
Variable Licuri oil level (% DM) SEM Regression equation R2
0.00 1.50 3.00 4.50
Milk production, kg 8.36 8.91 9.06 9.07 1.00 Y^ = 8.40 + 0.57x 0.64
Fat, % 3.81 3.86 3.92 3.95 0.36 Y^ = 3.81 + 0.03x 0.96
g/day 323.63 346.02 353.19 371.38 9.91 Y^ = 326.00 + 10.03x 0.51
Protein, % 3.82 3.78 3.64 3.49 0.56 Y^ = 3.85 – 0.075x 0.65
g/day 320.81 339.26 334.66 326.83 0.40 Y^ = 330.39
-Total solids, % 11.67 11.87 12.05 12.07 0.35 Y^ = 11.70 + 0.1x 0.61
g/day 9 8 0 1 0 6 0 1 0 9 0 1 1 0 0 58.3 Y^ = 999 + 26x 0.85
Dry extract, % 7.93 8.06 8.06 8.11 0.30 Y^ = 8.04
-g/day 6 6 0 7 2 0 7 3 0 7 4 0 45.6 Y^ = 712.5
-Protein/fat ratio 0.99 0.97 0.94 0.87 0.04 Y^ = 1.00 – 0.02x 0.92
fatty acids and an average metabolism that occurs by the increased activity of the enzyme fatty acid synthase.
In this research, there was increased digestibility of DM, even with reduction in the forage:concentrate ratio and reduced intake of NDF. This increased DM digestibility suggests the occurrence of compensation with a higher production of acetic acid, which is a precursor of milk fat. In addition, the ether extract concentrated in licuri oil, ranging from 1.18% to 5.64% of the DM, is below the maximum recommended for feeding to ruminants, which is 6% to 7% of the total diet (NRC, 2001). Thus, no damage on digestibility was observed in the diet.
The results of this experiment were different from those found in other studies of milk fat. In experiments with cows fed diets containing fish oil (rich in linoleic and linolenic acid) as a source of lipids,Bu et al. (2007) and Abughazaleh & Holmes (2007) reported they had found no statistical difference when they supplemented concentrate for cows on pasture with added lipids.They explained that these results were promoted by reducing the de novo synthesis in the mammary gland, which was inhibited by high concentrations of unsaturated fatty acids of additional sources. These authors also reported that, in general, the saturated fat increase has no effect on the concentration of milk fat, while reducing the synthesis of unsaturated fat in the milk, which characterizes the main difference between these studies and the present experiment, the chemical characteristics of oils used, in licuri oil mainly, saturated fatty acids and fish oil, which has in its composition greater amount of unsaturated fatty acids.
There was a linear effect (P<0.05) in the concentration of cow milk proteins when supplemented with the licuri oil, but not in its production. This result is explained by the dilution effect of the higher volume of milk produced with the addition of oil. However, the causes of the reduction in protein content when the addition consists of lipids are not yet fully established. The results observed in this study indicate that supplement with lipids could reduce the uptake of amino acids due to the low response of breast tissue to insulin (Kay et al., 2006). Thus, the most acceptable proposal to explain the reduction in the milk’s protein content with lipid supplement is the lack of insulin response by the mammary gland. Palmquistand Moser (1981) observed that the clearance rate of plasma glucose was negatively related to the increase in insulin concentration induced by a glucose overload. Consequently, diets rich in triglycerides could cause an insulin resistance, which slows the uptake of amino acids by the mammary tissue for the synthesis protein (Wu and Huber, 1994). These justifications are related to this study because the plasma glucose levels measured in
these animals were above the levels established as normal for cattle. Wu et al. (1993) tested three sources of fat and found that supplement reduced the protein content in milk (3.13, 3.05, and 2.97) but did not reduce its production, for control or supplemented diets with tallow or palm fatty acids or crystallized fat. The results were explained by the lowest intake of amino acids available for uptake by the mammary gland, a situation resulting from lower microbial protein synthesis in the rumen. The linear increase (P<0.05) percentage of total solids in milk (Table 5) shows that, as it raised the level of licuri oil, the fat content of milk also increased and, even with the reduction in protein content, it positively influenced the solid milk fraction.
The presence of oil linearly reduced (P<0.05) the protein/fat ratio, which is of great interest to the industry and dairy producers in regions where there are quotas for fat. This fact is related to increases in fat content and the reduction in milk protein, which are influenced by the increase in daily milk production caused by the oil levels in the concentrate. A linear increase (P <0.05) of licuri oil levels provided in the concentrate was observed to increase the levels of butyric acid, caproic, caprylic, capric and lauric milk, which was attributed to the improvement in DM digestibility, provided by the inclusion of licuri oil. Thus, it is possible that it reached the proportions of acetate and beta-hydroxybutyrate, which are important precursors in the synthesis of short chain fatty acids and medium.
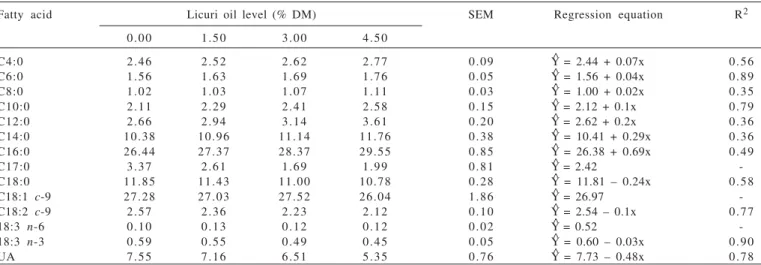
The increase (P<0.05) in the levels of myristic and palmitic acids (Table 6) may be related to the increase in milk fat in animals subjected to supplement with concentrate containing licuri oil because myristic and palmitic acids are major saturated fatty acids (57.81%) that make up this oil as well as the addition of carbon, which is promoted by the enzyme system elongases, and the fatty acid chains of shorter length (Gallo et al., 2007).
According to Baumgard et al. (2007), palmitic acid has an important relationship to increased serum cholesterol, and thus, it is recommended in small amounts in animal products. Palmatic acid may also be related to indexes that assess its risk to human health. Thus, the linear increase in the concentration of this fatty acid in milk from cows fed licuri oil may be another risk factor for coronary heart disease in men.
The levels of licuri oil added to the feed linearly decreased (P<0.05) the levels of stearic acid but did not affect (P>0.05) the levels of oleic acid in milk. Part of the stearic acid is transformed into oleic acid by the action of the enzyme
are formed (such as the oleic acid),which improves the milk fatty acid profile.
C18: 1 cis-9, known for its hypocholesterolemic property,
was the monounsaturated fatty acid present in greater quantity but was not influenced by the addition of licuri oil in the concentrate (P>0.05). This fatty acid is also a product of the desaturase enzyme’s activity. According to Beaulieu et al. (2002), the activity of thisdesaturase enzyme is responsible for the desaturation of carbon atoms 16 to 18 on the saturated fatty acids, converting them into their corresponding monounsaturated forms, with a double bond at carbon 9. The C18: 1 cis-9 in the milk probably did not
differ compared with the reduced concentrations of its precursor C18: 0, which lowered as the oil was included in the concentrate; thus, this finding reflects the decline of its precursor, possibly by the action of elongases.
The concentrations of fatty acids C18: 3 n-6 in milk
were not statistically different (P>0.05) between the levels of licuri oil (Tables 3 and 6.), while the concentration of fatty
acids C18: 3 n-3 and linoleic had a linear effect. Thus,
including licuri oil, mantaining of the forage:concentrate ratio above 80% and increasing in DM digestibility may have favored the development of fibrolytic microorganisms that biohydrogenate the UFA, reducing its level in milk. The UFA levels were not affected by the licuri oil (P>0.05); however, the levels of PUFA linearly decreased (Table 7), which are results that reflected the fatty acid profile of the concentrate on the metabolism of fatty acids in milk. UFA and PUFA are not synthesized by the mammary tissue of ruminants and their concentration in milk depends strictly on the amount absorbed from the bloodstream, by the mammary gland, and the FA that did not suffer biohydrogenation in rumen. Therefore, with the increased level of licuri oil, encouraging greater consumption of concentrate (greater amount of saturated fatty acids) and less of forage (greater amount of unsaturated), the availability of UFA obtained by the mammary gland for milk fatty acid composition may also have been reduced, providing these effects.
Item Licuri oil level (% DM) SEM Regression equation R2
0.00 1.50 3.00 4.50
Unsaturated 30.55 30.07 30.36 28.74 1.20 Y^ = 29.93
-Saturated 69.40 69.93 69.64 71.26 1.04 Y^ = 70.07
-Monounsaturated 27.28 27.03 27.52 26.04 1.92 Y^ = 26.97
-Polyunsaturated 3.27 3.04 2.84 2.70 0.96 Y^ = 3.25 – 0.03x 0.48
Unsaturated/saturated1 0.44 0.43 0.44 0.41 0.14 Y^ = 0.43
-Short chain2 7.15 7.47 7.49 8.22 0.65 Y^ = 7.13 + 0.23x 0.55
Medium chain3 39.48 41.27 42.65 44.92 1.85 Y^ = 39.42 + 1.18x 0.79
Long chain4 45.76 44.11 43.05 41.50 1.93 Y^ = 45.70 – 0.92x 0.49
n- 35 0.59 0.55 0.49 0.45 0.10 Y^ = 0.52
-n- 66 2.67 2.49 2.35 2.25 0.11 Y^ = 2.65 – 0.1x 0.80
n-6/n-37 5.04 4.55 4.88 5.01 0.17 Y^ = 4.87
-A I8 2.31 2.47 2.51 2.79 0.20 Y^ = 2.3 + 0.1x 0.61
1 Saturated and unsaturated fatty acids ratio; 2 Short-chain fatty acids (less than 11 carbons); 3 Medium-chain fatty acids (11 to 16 carbons); 4 Long-chain fatty acids (over 16 carbons); 5 n-3 – omega 3; 6 n-6 – omega 6; 7n-3 and n-6 fatty acids ratio; 8 Atherogenicity index; SEM =Standard error of the mean; R2 = coeficiente de determinação. Table 7 - Percentages of fatty acids grouped in milk fat (g/100 g fat) of cows on pasture submitted to licuri oil supplement
Fatty acid Licuri oil level (% DM) SEM Regression equation R2
0.00 1.50 3.00 4.50
C4:0 2.46 2.52 2.62 2.77 0.09 Y^ = 2.44 + 0.07x 0.56
C6:0 1.56 1.63 1.69 1.76 0.05 Y^ = 1.56 + 0.04x 0.89
C8:0 1.02 1.03 1.07 1.11 0.03 Y^ = 1.00 + 0.02x 0.35
C10:0 2.11 2.29 2.41 2.58 0.15 Y^ = 2.12 + 0.1x 0.79
C12:0 2.66 2.94 3.14 3.61 0.20 Y^ = 2.62 + 0.2x 0.36
C14:0 10.38 10.96 11.14 11.76 0.38 Y^ = 10.41 + 0.29x 0.36
C16:0 26.44 27.37 28.37 29.55 0.85 Y^ = 26.38 + 0.69x 0.49
C17:0 3.37 2.61 1.69 1.99 0.81 Y^ = 2.42
-C18:0 11.85 11.43 11.00 10.78 0.28 Y^ = 11.81 – 0.24x 0.58
C18:1 c-9 27.28 27.03 27.52 26.04 1.86 Y^ = 26.97
-C18:2 c-9 2.57 2.36 2.23 2.12 0.10 Y^ = 2.54 – 0.1x 0.77
18:3 n-6 0.10 0.13 0.12 0.12 0.02 Y^ = 0.52
-18:3 n-3 0.59 0.55 0.49 0.45 0.05 Y^ = 0.60 – 0.03x 0.90
UA 7.55 7.16 6.51 5.35 0.76 Y^ = 7.73 – 0.48x 0.78
SEM = standard error of the mean; UA = unidentified fatty acids; R2 = coeficiente de determinação.
Licuri oil added to the concentrate of cows does not affect (P>0.05) the concentration of unsaturated fatty acids, saturated and monounsaturated or the ratio unsaturated/saturated (Table 7).However, the addition of licuri oil linearly decreased (P<0.05) the concentration of polyunsaturated fatty acids (PUFA) in the milk. Wood et al. (2003) recommended that the ratio of unsaturated/saturated fat in a human diet be above 0.4. Thus, even with reductions in the concentration of acids, the ratios of unsaturated/ saturated fat at all levels were above the recommended rate. As for the length of the carbon chain, the concentrations of short chain fatty acids (SCFA) and medium chain fatty acids (MCFA) were higher (P<0.05) for animals under the licuri oil supplement. The opposite behavior was observed for the concentrations of long chain fatty acids (LCFA) as the lipid supplement to the diet linearly decreased (P<0.05) the concentrations of these fatty acids in the milk fat.
Additionally, short chain fatty acids (less than 11 carbons) and medium chain fatty acids (11-16 carbons) are derived from de novo synthesis, which was stimulated and there was an increase (P<0.05) in the fatty acid chain with these extensions, acetate and to a lesser extent ß-hydroxybutyrate, which are the sources of carbon. The long-chain fatty acids (LCFA) absorbed from the bloodstream reduced with the increasing levels of licuri oil, without obtaining the mammary gland substrates for the fatty acid composition of milk.
For dairy industries, the increase in SCFA is interesting, especially if the target of that milk production is cheese because this increase in SCFA is responsible for increasing aroma and flavor in cheese production and for increasing the yield in butter production (Lee et al., 2006). The increase of unsaturated fatty acids, along with the reduction of saturated fats, supports the lowering of blood cholesterol in humans (Duarte et al., 2005) and causes a positive impact on human nutrition.Specifically, the increase of unsaturated fatty acids contributes to the prevention of chronic diseases as well as to improving the image of dairy products to consumers. Thus, several indexes or ratios are used to indicate greater or lesser influence on the susceptibility of these dietary disorders.
In this research, there was no difference between the treatments for the n-6/n-3 ratio, and all values are above the
maximum recommended by Wood et al. (2003), who showed values below 4 in milk as beneficial to human health. The
n-6/n-3 ratio is an important indicator of the nutritional
quality of milk because it has an influence on risk factors related to the emergence of cancer, heart disease and the formation of thrombi or clots that can lead to heart attacks (Enser et al., 2001).
Regarding the atherogenicity index (AI), there was a linear increase (P<0.05) of the addition of licuri oil in the concentrate, which resulted in increased levels of C12: 0, C14: 0 and C16: 0 in milk. These saturated fatty acids have a positive influence on the LDL plasma levels, also called “bad cholesterol”(Chardigny et al., 2008), so the lower the value of this index, the more beneficial the product is to human health.
The amount of fatty acids transferred from the diet to milk fat is directly related to the type of supplement used. Therefore, the manipulation of lactating cows’ diet, depending on the goal proposed for the final product, can be a way to control the nutritional characteristics and/or physical-chemical properties of milk fat.
Conclusions
The optimum level of licuri oil in the concentrate for cows on pasture is 4.5% of DM. In this level, increases in the percentages of fat and total solids were observed. This finding is important to the dairy industry and regions where the price of milk varies according to its composition. The addition of licuri oil in the concentrate has undesirable effects on milk fatty acid profile, increasing the concentration of the saturated fatty acids and the atherogenicity index, which may be related to increased risk of coronary heart disease in men.
References
ABUGHAZALEH, A.A.; HOLMES, L.D. Diet supplementation with fish oil and sunflower oil to increase conjugated linoleic acid levels in milk fat of partial grazing dairy cows. Journal of Dairy Science, v.90, p.2897-2904, 2007.
BAUMGARD, L.H.; KEATING, A.F. Facts and myths about the effects of milk fatty acids on human health. In: FOUR STATE DAIRY NUTRITION AND MANAGEMENT CONFERENCE, 2007, Dubuque. Anais… Dubuque: 2007. p.59-63.
BEAULIEU, A.D.; DRACKLEY, J.K.; MERCHEN, N.R. Concentrations of conjugated linoleic acid (cis-9, trans-11 octadienoic acid) are not increased in tissue lipids of cattle fed with high concentrate diet supplemented with soybean oil. Journal of Animal Science, n.3, v.80, p.847-861, 2002.
BORJA, M.S.; OLIVEIRA, R.L.; RIBEIRO, C.V.M.R. et al. Effects of feeding licury (Syagrus coronate) cake to growing goats.
A s i a n - A u s t r a l i a n J o u r n a l A n i m a l S c i e n c e, v.23, n.11, p.1436-1444, 2010.
BRASIL. Ministério da Agricultura. R.I.I.S.P.O.A. Regulamento da inspeção industrial e sanitária de produtos de origem a n i m a l. (Aprovado pelo decreto nº 30690, de 20.03.52, alterado pelo decreto nº 1255, de 25.06.52). Brasília, 1980. 6 6 p .
CHARDIGNY, J.M.; DESTAILLATS, F.; MALPUECH-BRUGÈRE, C. et al. Do trans fatty acids from industrially produced sources and from natural sources have the same effect on cardiovascular disease risk factors in healthy subjects? Results of the trans Fatty
Acids Collaboration (TRANSFACT) study. American Journal of Clinical Nutritional, v.87, p.558-66, 2008.
CHOUINARD, P.Y.; GIRARD, V.; BRISSON, G.J. Fatty acids profile and physical properties of milk fat from cows fed calcium salts of fatty acids with varying unsaturation. Journal o f D a i r y S c i e n c e, v.81, p.471-481, 1998.
CHRISTIE, W.W. A simple procedure for rapid transmethylation of glycerolipids e cholesterol esters. J o u r n a l o f L i p i d Res earch, v.23, p.1072, 1982.
COSTA, R.G.; QUEIROGA. R.C.R.E.; PEREIRA, R.A.G. Influência do alimento na produção e qualidade do leite de cabra. Revista Brasileira de Zootecnia, v.38, p.307-321, 2009.
CREPALDI, I.C.; ALMEIDA-MURADIAN, L.B.A.; RIOS, M.D.G. et al. Composição nutricional do fruto de licuri (Syagrus coronata (Martius) Beccari). Revista Brasileira de Botânica, v.24, n.2, p.155-159, 2001.
DUARTE, L.M.D.; STUMPF JUNIOR, W.; FISCHERS, V. et al. Efeito de diferentes fontes de gordura na dieta de vacas Jersey sobre o consumo, a produção e a composição do leite. Revista Brasileira de Zootecnia, v.34, n.6, p.2020-2028, 2005. ENSER, M.; SCOLLAN, N.; GULATI, S. et al. The effects of
ruminally-protected dietary lipid on the lipid composition and quality of beef muscle. In: INTERNATIONAL CONGRESS OF MEAT SCIENCE AND TECHNOLOGY, 47., 2001, Kraków, Poland. Proceedings... Kraków, 2001. v.1, p.12-13.
FERNANDES, A.R.M.; SAMPAIO, A.A.M.; HENRIQUE, W. et al. Composição química e perfil de ácidos graxos da carne de bovinos de diferentes condições sexuais recebendo silagem de milho e concentradoou cana-de-açúcar e concentrado contendo grãos de girassol. Revista Brasileira de Zootecnia, v.38, n.4, p.705-712, 2009.
GALLO, S.B.; SIQUEIRA, E.R.; ROSA, G.T. Efeito da nutrição da ovelha e do cordeiro sobre o perfil de ácidos graxos do músculo
Tricepsbrachii de cordeiros. Revista Brasileira de Zootecnia, v.36, n.6, p.2069-2073, 2007.
GRUMMER, R.R. Effect of feed on the composition of milk fat.
J o u r n a l o f D a i r y S c i e n c e, v.74, p.3244-3257, 1991. HARA, A.; RADIN, N.S. Lipid extration of tissues of low-toxicity
solvent. Analytical Biochemistry, v.90, n.1, p.420-426, 1978. KAY, J.J.; ROCHE, J.R.; MOORE, C.E. et al. Effects of dietary conjugated linoleic acid on production and metabolic parameters in transition dairy cows grazing fresh pasture. Journal of Dairy Research, v.73, n.3, p.367-377, 2006.
LEE, J.H.; KANNAN, G.; KOUAKOU, B. Concentration and distribution of conjugated linoleic acids and trans-fatty acids in
small ruminant milk and meat lipids. Journal of Food Lipids, v.13, p.100-111, 2006.
MACEDO, V.P.; SILVEIRA, A.C.; GARCIA, C.A. et al. Desempenho e características de carcaça de cordeiros alimentados em comedouros privativos recebendo rações contendo semente de girassol.Revista Brasileira de Zootecnia, v.37, n.11, p.2041-2048, 2008. NATIONAL RESEARCH COUNCIL - NRC. Nutient requirement
of dairy cattle. 7.ed. Washinton, D.C.: Nacional Academic Press, 2001. 381p.
NÖRNBERG, J.L.; LÓPEZ, J.; STUMPF JÚNIOR, W. et al. Desempenho de vacas Jersey suplementadas com diferentes fontes lipídicas na fase inicial da lactação. Revista Brasileira de Zootecnia, v.35, n.4, p.1431-1438, 2006.
PALMQUIST, D.L.; MOSER, E.A. Dietary fat effects on blood insulin, glucose utilization, and milk protein content of lactating cows. Journal of Dairy Science, v.64, n.8, p.1664-1670, 1981. PALMQUIST, D.L.; JENKINS, T.C. Fat in lactation rations: review.
Journal of Dairy Science, v.63, p.1-14, 1980.
RODRIGUES-RUIZ, J.; BELARBI, H.; SÁNCHEZ, J.L.G. et al. Rapid simultaneous lipid extraction and transesterification for fatty acid analyses. Biotechnology Techniques, v.12, n.9, p.689-691, 1998. ROSSATO, L.V.; BRESSAN, M.C.; RODRIGUES, E.C. et al. Composição lipídica de carne bovina de grupos genéticos taurinos e zebuínos terminados em confinamento. Revista Brasileira de Zootecnia, v.38, n.9, p.1841-1846, 2009.
SANTOS, L.D.; FURUYA, W.M.; SILVA, T.S.C. et al. Ácido linoléico conjugado em dietas para pacu: tempo de deposição, desempenho e perfil de ácidos graxos. Revista Brasileira de Zootecnia, v.38, n.6, p.980-988, 2009.
SILVA, T.M.; OLIVEIRA, R.L.; BARBOSA, L.P. et al. Preliminary study on meat quality of goats fed levels of licury oil in the diet. Asian-Australian Journal Animal Science, v.24, n.8, p.1112-1119, 2011.
SILVA, T.M.; OLIVEIRA, R.L.; BARBOSA, L.P. et al. Body components of young crossbred Boer goats fed licury oil (Syagruscoronata) in the diet. Arquivo Brasileiro de Medicina Veterinária e Zootecnia, v.62, n.6, p.1448-1454, 2010. STATISTICAL ANALISYS/STAT - SAS. SAS user ’s guide:
statistics. Release 9.1.2 Cary: SAS, 2004. 1500p.
ULBRICHT, T.L.V.; SOUTHGATE, D.A.T. Coronary heart disease: seven dietary factors. Lancet, v.338, p.985-992, 1991. WOOD, J.D.; RICHARDSON, R.I.; NUTE, G.R. et al. Effects of
fatty acids on meat quality: a review. Meat Science, v.66, p.21-32, 2003.
WU, Z.; HUBER, J.T.; SLEIMAN, F.T. et al. Effect of three supplement fat sources on lactation and digestion in dairy cows.
Journal of Dairy Science, v.76, n.11, p.3562-3570, 1993. WU, Z.; HUBER, J.T. Relationship between dietary fat supplement
and milk protein concentration in lactating cows: a review.