Vet erinary World, EI SSN: 2231- 0916
Available at w w w.vet erinaryw orld.org/ Vol.7/ Novem ber- 2014/ 12.pdf
Vet erinary World, EI SSN: 2231- 0916 966
RESEARCH ARTI CLE Ope n Acce ss
Th e u se of N a
+a n d K
+ion con ce n t r a t ion s a s pot e n t ia l dia gn ost ic
in dica t or s of su bclin ica l m a st it is in da ir y cow s
Abdul Wahid Haron1,3, Faez Firdaus Jesse Abdullah1,3, Abdulnasir Tij j ani2, Yusuf Abba2, Lawan Adam u1, Kont o Moham m ed1,
Aisyah Munira Moham m ed Am ir1, Moham m ad Abubakar Sadiq1 and Mohd Azm i Mohd Lila2
1. Depart m ent of Vet erinary Clinical St udies, Universit i Put ra Malaysia, 43400 UPM Serdang, Selangor, Malaysia; 2. Depart m ent of Vet erinary Pat hology and Microbiology, Universit i Put ra Malaysia, 43400 UPM Serdang, Selangor, Malaysia; 3. Research Cent re for Rum inant Disease, Facult y of Vet erinary Medicine, Universit i Put ra Malaysia, 43400
UPM Serdang, Selangor, Malaysia
Cor r e spon din g a u t h or : Abdul Wahid Haron, e- m ail: wahidharon@gm ail.com , FFJA: j esseariasam y@gm ail.co, AT: nasirvet 69@gm ail.com , YA: yabbavet @gm ail.com , LA: [email protected] , KM: kont om oham m [email protected] ,
AMMA: aisyahm unira@gm ail.com , MAS: m asadiqvet @gm ail.com , MAML: azm i@upm .edu.m y
Re ce ive d: 08- 07- 2014, Re vise d: 12- 10- 2014, Acce pt e d: 21- 10- 2014, Pu blish e d online: 16- 11- 2014
doi: 10.14202/ vet w orld.2014.966- 969. H ow t o cit e t h is a r t icle : Haron AW, Abdullah FFJ, Tij j ani A, Abba Y, Adam u L, Moham m ed K, Am ir AMM, Sadiq MA, Lila MAM ( 2014) The use of Na+ and K+ ion concent rat ions as pot ent ial diagnost ic
indicat ors of subclinical m ast it is in dairy cow s, Vet erinary World7( 11) : 966- 969.
Abst r a ct
Aim: This study was conducted to evaluate the concentrations of sodium (Na+) and potassium (K+) ions in milk of lactating dairy cows with and without subclinical mastitis as putative indicators for detecting subclinical mastitis in dairy cows.
Materials and Methods: Thirty seven lactating dairy cows were screened for the evidence of subclinical mastitis
using California mastitis test (CMT). The lactating dairy cows were categorized as CMT-Positive (CMT-P; n=20) and CMT-Negative (CMT-N; n=17) based on whether they were positive or negative for CMT using a standard kit. The CMT-P lactating dairy cows were further sub divided into subclinical 1+ (S1+; n=6), subclinical 2+ (S2+; n=9), and subclinical 3+(S3+; n=5). Direct microscopy somatic cell count (SCC) was used to determine the SCC using Wright’s stain. The samples were filtered and diluted at 1:100 dilutions before being measured for the concentrations of Na+ and K+ using atomic absorption spectrophotometer.
Results: There was a significant increase (p<0.05) in SCCs and Na+ concentration in the milk of CMT-P dairy cows, with a mean Log10 SCC score of 5.35±0.06 cells/ml and mean Na+ concentration of 232±19.1 mg/dL. However, there was a significant reduction (p<0.05) in the concentration of K+ (123±7.6 mg/dL) in the milk samples of the CMT-P cows. There were significant differences (p<0.05) in SCC, Na+ and K+ concentrations between milk samples from the CMT-N dairy cows and CMT-P subgroups; S1+, S2+, and S3+ respectively. Potassium (K+) concentration had a significant strong negative correlation with sodium (Na+) concentration (r=−0.688; p<0.01) and weak positive correlation with SCC (r=−0.436; p<0.01). The sensitivity of using Na+ and K+ concentrations as detection indices for sub-clinical mastitis is 40% and 90%, respectively, while the specificity of each was 100%.
Conclusion: This study thus shows that evaluation of Na+ and K+ concentrations from milk samples of dairy cows with sub clinical mastitis can be of immense diagnostic benefit and will compliments detection using CMT alone.
Keywords: potassium ion, sodium ion, somatic cell count, subclinical mastitis.
I n t r o du ct ion
Mastitis is defined as an inflammation of the mammary gland. Mastitis can be divided into two broad categories: Clinical; where changes in the milk and the udder can be visually detected, and subclini-cal; where the changes can be more subtle and require the use of laboratory tests to detect it [1]. The somatic cell count (SCC) of milk is widely used to monitor udder health and milk quality. The SCC is a count used to screen epithelial cells that have been shed from the lining of the gland and white blood cells (leucocytes) that have entered the mammary glands in response to injury or infection [2]. Lymphocytes, macrophages and polymorphonuclear cell counts can identify inflammatory processes in quarters with low
SCC that are otherwise considered healthy [3]. During the inflammatory process, a significant increase in SCC is due to the influx of neutrophils into milk from the infected tissue [4]. Changes in the permeability of the membranes would lead to increased leakage of blood components into the udder and changes in the composition of milk [5].
An increase in the SCC is used as an indicator of udder health for management and selection purposes, as well as for certification of milk quality [6,7] reported a significant alteration with an increase in Na+, Cl− and
a decrease in K+ from milk of Holstein Haryana Cross
cows with subclinical mastitis. In another study by Gera et al. [8], a significant increase in iron, zinc and cobalt were observed in milk from a cow with subclin-ical mastitis [9] reported that amino acid levels sig-nificantly increases in cows with subclinical mastitis, with a measured value 20 times higher than in normal cow milk. A study by Ambade et al. [10] also stated that there was a significant increase in the pH and Copyright : The aut hors. This art icle is an open access art icle licensed
Available at w w w.vet erinaryw orld.org/ Vol.7/ Novem ber- 2014/ 12.pdf
Vet erinary World, EI SSN: 2231- 0916 967
lactate dehydrogenase content from milk of cows with clinical and subclinical mastitis. Several studies have been done on the effects of SCM on electrolyte con-centration in cow milk. In Malaysia, there is a paucity of information on evaluation sodium and potassium ions as putative diagnostic indicators for detection of subclinical mastitis.
Therefore, the aim of this study is to evaluate sodium (Na+) and potassium ion (K+) concentrations
from milk samples of cows with sub clinical mastitis and to use them as putative indicators for the detection of subclinical mastitis in dairy cows.
M a t e r ia ls a n d M e t h ods
Et h ica l a ppr ova l
The study protocol followed the ethical guide-lines on the proper care and use of animals and had been approved by the Institutional Animal Ethics Committee Universiti Putra Malaysia. Reference number: PM/IACUC/FYP-2013/FPV.043 and FPV/ FYP/2013/059
An im a l se le ct ion a n d de t e ct ion of su bclin ica l m a st it is 37 lactating dairy cows from five dairy herds in Selangor were randomly selected for this study. Milk samples (5 ml) were collected from each lactating cow and screened for subclinical mastitis using the California mastitis test (CMT) kit. Negative milk sam-ples (CMT-N) showed no or trace reaction, while the positives samples (CMT-P) were rated as 1+, 2+ and 3+ based on whether the reaction was weak, distinct or strong respectively. The positive animals were then subsequently divided into three groups as subclinical 1 (S1+); subclinical 2 (S2+) and subclinical 3 (S3+) for ease of categorization [10].
D ir e ct m icr oscopy SCC
10 μl of milk sample was pipetted onto a clean glass slide. The milk was then spread using a spreader to form a circular smear of about ±1.5 cm in diameter. The slides were air dried overnight and then stained with Wright’s stain. Somatic cells were counted from 30 microscopic fields using 40×10 magnifications. The SCC per ml was calculated by multiplying the mean SCC per microscopic field with the dilution factor.
Ele ct r olyt e e va lu a t ion
20 ml milk solution with dilution of 1:100 was prepared, filtered using filter paper and then left to recondition at room temperature before being ana-lyzed using atomic absorption spectrophotometer for electrolyte content in mg/dL.
St a t ist ica l a n a lysis
The SCC was reduced to Log10SCC and used as an independent t-test and also ANOVA was used with Tukey Kramer to test for the significant differences in means of SCC, Na+ and K+ concentrations between
milk samples from the CMT-P and CMT-N dairy cows while, pairwise correlation coefficient was used to test for the linear relationship between SCC, Na+
and K+ concentrations using the statistical software
package (JMP® 11. NC: SAS Institute Inc. USA) Analyses were considered as significant at p<0.05. Receiver operating characteristic curve was used to test for the sensitivity and specificity of Na+ and K+ as
potential markers using MedCalc Statistical Software version 14.8.1 (MedCalc Software bvba, Ostend, Belgium; http://www.medcalc.org; 2014).
Re su lt s
Following CMT, it was observed that 17 cows were CMT-N, 20 were CMT-P. The CMT-P dairy cows comprised of S1+=7, S2+=9 and S3+=4.
The means o f the variables SCC, Na+
concen-tration and K+ concentration between the CMT-P and
CMT-N lactating dairy cows are shown in Table-1. There was a significant increase (p<0.05) in the SCC and Na+ concentration in the CMT-P dairy cows
com-pared to SCC and Na+ concentration in the CMT-N
dairy cows.
The K+ concentration was lower in the CMT-P group than observed in the CMT-N dairy cows.
Table-2 shows the SCC, Na+ and K+
concentra-tions of milk samples from the CMT-N group and the CMT-P sub divisions (S1+,S2+ and S3+). There were significant differences (p<0.05) in the SCC, Na+
and K+ concentrations between the CMT-N and the
CMT-P sub-divisions (S1+, S2+ and S3+). The mean Log10 SCC from the CMT-N group is lower than those from the CMT-P sub-divisions; S1+, S2+ and S3+. The Na+ concentrations from the CMT-N group is
equally lower compared to those of the CMT-P sub-di-visions S1+, S2+ and S3+. The K+ concentration was
found to be higher in the CMT-N group as compared to the CMT-P sub-divisions: S1+, S2+ and S3+. These results show a significant difference (p<0.05) between CMT-N and CMT-P with an increase in Na+ content
and decrease in K+ content. There were significant
dif-ferences (p<0.05) in SCC between the CMT-N group and those from the CMT-P sub-divisions.
The Pearson ’s correlation coefficient between the SCC, Na+ and K+ concentrations showed a weak
positive correlation (r=0.270, p<0.01) between SCC and Na+ concentration, while K+ concentration had
a significant weak negative correlation with SCC (r=−0.436, p<0.01).
The reference detection range of Na+
concentra-tion from CMT-N cows with 95% confidence interval was 75.4-91.6 mg/dL, while those of positive cows
Ta ble - 1 : Mean± SEM of SCC, Na+ and K+ concent rat ions
in m ilk from CMT- N and CMT- P dairy cow s.
Pa r a m e t e r s CM T- N CM T- P
Log10SCC 4.72a± 0.10 5.35b± 0.06
Na+ ( m g/ dL) 141a± 23.4 232b± 19.1
K+ ( m g/ dL) 195a± 14.0 123b± 17.6
Available at w w w.vet erinaryw orld.org/ Vol.7/ Novem ber- 2014/ 12.pdf
Vet erinary World, EI SSN: 2231- 0916 968
ranged from 106.5 to 159.5 mg/dL. Furthermore, the 95% confidence interval detection range for K+
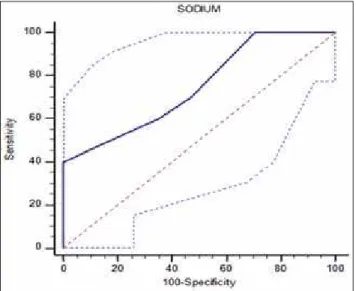
con-centration was 187-204 mg/dL in CMT-N cows and 106.7-138.5 mg/dL in CMT-P cows. The sensitivity and specificity of using Na+ as a diagnostic
indica-tor in CMT-P cows is 40% and 100%, respectively, while that of K+ is remarkably high at 90% and 100%
(Figures-1 and 2).
D iscu ssion
T he concentrations of many minerals are altered during mastitis, and these changes can play significant roles in determining the industrial quality of the milk and diagnosis of sub-clinical mastitis [11]. Potassium, the most abundant mineral in milk, leaks out of milk through the paracellular pathway. Consequently, its concentration decreases. Conversely, sodium found in high concentrations in the blood leaks into the milk and increases the concentration above normal [12,13]. The significant increase (p<0.05) observed in the mean SCC in the milk samples from CMT-P dairy cows as compared to those from CMT-N cows in this study may be due to inflammation associated with mastitis, which could result in the influx of neutrophils giving rise to increase SCC [4,5]. The increase in Na+
con-centrations and decrease in K+ observed among the
CMT-P dairy cows corroborates the reports of [14,15]. They reported that during a mastitic event, damage to the epithelial tissue, and, in particular, an increase in permeability of the “paracellular” junctions allows Na+ to diffuse into the mammary gland, resulting in
an increase in milk Na+ concentration. At the same
time, in an attempt to achieve osmotic equilibrium, milk potassium concentration declines, proportionally less than Na. The results of the Pearson’s correlation coefficient between SCC, Na+ and K+ concentrations
in the current study corresponds with previous study from [7], where the SCC was reported to have a pos-itive correlation with Na+ content and negative
cor-relation with K+ content. It was equally observed in
this study that K+ had a significant correlation with
SCC and Na+ content. This suggests that as SCC and
Na+ content increases in subclinical mastitis, the K+ content decreases.
Con clu sion
This study showed that SCC had an association with the level of Na+ and K+ in milk and these two
electrolytes may serve as potential indicators for the detection of subclinical mastitis in dairy cows.
Au t h or s’ Con t r ibu t ion s
AWH, FFJA and MAML conceptualized, and supervised the research. AMMA,,, KM,, and MAS collected and analysed the samples. AT, YA and LA drafted the manuscript and ran all statistical tests. All authors read and approved the manuscript.
Ack n ow le dgm e n t s
The authors acknowledge the assistance of the farms involved and the technical support from staff Ta ble - 2 : Mean± SEM of Log10 SCC, Na+ and K+ cont ent s in m ilk from CMT- N and subclinical m ast it is sub divisions
( S1+ , S2+ , S3+ ) .
Pa r a m e t e r s CM T- N S1 + S2 + S3 +
Log10SCC 4.72a± 0.10 5.24a± 0.09 5.30a± 0.11 5.57b± 0.09
Na+ ( m g/ dL) 141a± 23.4 205ab± 25.6 213abc± 19.7 299bc± 23.7
K+ ( m g/ dL) 195a± 14.0 122bc± 18.7 137b± 17.9 97.2c± 21.2
Mean± SEM w it h different superscript s a,b,cw it hin row s differ significant ly at p< 0.05. SEM= St andard error of m ean,
SCC= Som at ic cell count , CMT- N= California m ast it is t est - negat ive, CMT- P= California m ast it is t est - posit ive
Figu r e - 1 : Sensit ivit y and specificit y of sodium diagnost ic t est using receiver operat ing charact erist ic curve.
Available at w w w.vet erinaryw orld.org/ Vol.7/ Novem ber- 2014/ 12.pdf
Vet erinary World, EI SSN: 2231- 0916 969
of the University Veterinary Hospital (UVH), Faculty of Veterinary Medicine, Universiti Putra Malaysia. The research was funded by the Ministry of Higher-Education Malaysia; Grant No 59419000.
Com pe t in g I n t e r e st s
The authors declare that they have no competing interests.
Re fe r e n ce s
1 . Biggs, A. (2009) Mastitis in cattle. The Crowood Press, Marlborough, Wiltshire.
2. Bradley, A. (2005) Use and interpretation of somatic cell count data in dairy cows. In Pract., 27: 310-315.
3. Pilla, R., Malvisi, M., Snel, G.G.M., Schwarz, D., König, S., Czerny, C.P. and Piccinini, R. (2013) Differential cell count as an alternative method to diagnose dairy cow mastitis.
J. Dairy Sci., 96(3): 1653-1660.
4. Jones, G.M. (2006) Understanding the basics of mastitis. Virginia Cooperative Extension, Publication No. 404-233. Virginia State University Press, Virginia, USA. p1-7. 5. Sharif, A. and Muhammad, G. (2008) Somatic cell count
as an indicator of udder health status under modern dairy production: A review. Pak. Vet. J., 28(4): 194-200.
6. Rodriquez, Z., Gianola, S.L.D. and Shook, G.E. (2000) Evaluation of models for somatic cell score lactation pat-terns in Holsteins. Livest Prod. Sci., 67: 19-30.
7. Guha, A. and Gera, S. (2012) Evaluation of chemical and elec-trolyte components of milk in subclinical mastitis in Holstein X Haryana cattle. Expl. Anim. Med. Res., 1(2): 140-143.
8. Gera, S., Guha, A., Sharma, A. and Manocha, V. (2011) Evaluation of trace element profile as an indicator of bovine sub-clinical mastitis. Intas. Polivet., 12(1): 9-11.
9. Andrei, S., Culea, M., Matei, S., Pintea, A. and Groza, I. S. (2011) Concentration of total amino acids and the variations that occur between different types vital activity of the body.
Bull. UASVM. Vet. Med., 68(1): 15-19.
10. Ambade, R.B., Bonde, S.W. and Takarkhede, R.C. (2012) Cellular and biochemical indicators of bovine subclinical mastitis. Anim. Sci. Rep., 6(1):3-7.
11. Kiro, P. and Emmanuel, S. (2006) Milk composition changes during mastitis. A Publication of the University of Adelaide, School of Animal and Veterinary Science. Available from: http://www.Milkproduction.com./library/science-articles/ milk-composition-changes. Accessed on 6-12-2014. 12. Auldist, M.J., Hubble, I.B. (1998) Effects of mastitis on raw
milk and dairy products. Aust. J. Dairy Technol., 53: 28-36. 13. Auldist, M.J., Coats, S., Rogers, G.L. and McDowell, G.H.
(1995) Changes in the composition of milk from healthy and mastitic dairy cows during the lactation cycle. Aust. J. Exp. Agric., 35: 427-436.
14. Guidry, A.J., Ost, M., Mather, I.H., Shainline, W.E. and Weinland, B.T (1983) Sequential response of milk leuko-cytes, albumin, immunoglobulins, monovalent ions, citrate and lactose in cows given infusions of Escherichia coli
endotoxin into the mammary gland. Am. J. Vet. Res., 44(12): 2262-2267.
15. Schaar, J. and Funke, H. (1986) Effect of subclinical mas-titis on milk plasminogen and plasmin compared with that on sodium antitrypsin and N-acetyl-D-glucosaminidase.
J. Dairy Res., 53(4): 515-528.