Received: July 3, 2002 J. Venom. Anim. Toxins incl. Trop. Dis.
Accepted: November 8, 2002 V.10, n.1, p.34-52, 2004.
Published online:February 14, 2004 Original paper - ISSN 1678-9199.
HEMATOLOGICAL CHANGES IN SHEEP INOCULATED WITH NATURAL AND COBALT60-IRRADIATED Crotalus durissus terrificus VENOM (Laurenti, 1768)
NETTO D. P.1; CHIACCHIO S. B.2; BICUDO P. L.2, ALFIERI A. A.1, BALARIM M. R. S.1, NASCIMENTO N.3
1.Faculdade de Medicina Veterinária e Zootecnia, Departamento de Medicina Veterinária Preventiva, Centro de Ciências Agrárias, Universidade Estadual de Londrina, Londrina, Paraná, Brasil; 2.Faculdade de Medicina Veterinária e Zootecnia, Universidade Estadual Paulista, Botucatu, São Paulo, Brasil; 3.Supervisão de Radiobiologia, Instituto de Pesquisas Energéticas e Nucleares IPEN/CNEM, Universidade de São Paulo, São Paulo, Brasil.
ABSTRACT. Natural (NV) and Cobalto60-irradiated (IrV) Crotalus durissus terrificus venom
were used to evaluate serum production capacity of sheep and possible hematological and biochemical effects. Freeze-dried venom aliquots were diluted in acidified saline solution (NaCl 150 mM, pH 3.0) and irradiated by a Cobalt 60 source at a dose of 5.54 x 10² Gy/h and
a concentration of 2.000 Gy. Twelve sheep were divided into two groups of six animals. One group received irradiated venom (IrV) and the other natural venom (NV). Three antigen doses (venom) were administered at monthly intervals. Blood samples were collected weekly for analysis of serum neutralization potency and capacity, complete blood count (CBC), total plasma protein, fibrinogen, albumin, and globulin. At the end of the experiment, the animals were challenged with a LD50 for sheep and showed no signs of envenoming. The two groups
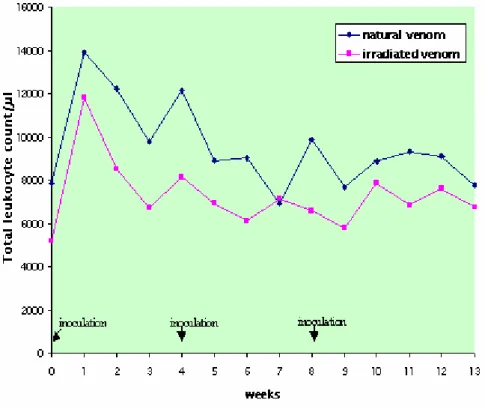
did not present clinical alterations. Results of the total leukocyte count did not present interaction or time factor effect for both groups, but there was a different action between them, with the NV group presenting more cells than the IrV group. The leukocyte increase to 13,000/µl indicates that slight leukocytosis occurred in the week after the first inoculation in the NV group. There was no statistically significant difference between groups in the absolute count of segmented neutrophils, eosinophils, and lymphocytes but there were statistically significant oscillations in values at the different collecting times. The NV group presented an increase in the absolute neutrophil count after the first inoculation that persisted for 5 weeks. In the IrV group, the increase in neutrophils occurred only in the first week returning to normal in the following weeks. The alterations in the neutrophil count are indicative of systemic inflammatory response related to cytokine release; response was more marked in the NV group, showing its greater toxicity.
KEY WORDS: hematology, gamma radiation, irradiated crotalic venom, crotalic antiserum, ovine, Crotalus durissus terrificus.
CORRESPONDENCE TO:
INTRODUCTION
Crotalus durissus terrificus snakes account for 14% of human envenomings in Brazil (17,18).
Heterologous sera are used in the treatment of snake envenomings; these sera are usually obtained from venom-hyperimmunized horses. Administration of horse serum-derived F(ab)2
immunoglobulin concentrates constantly causes a type-III hypersensitivity reaction mediated by immune complexes; these are probably due to molecule bivalence and high circulating IgGT titer present in immunized horses (7). According to Fan and França (9), reaction to
serotherapy constitutes an immune process where heterologous proteins are released into the organism, a mechanism of hypersensitivity to venom antidote.
The problem of choosing an adequate treatment for horse-serum sensitive patients led to the development of immunization techniques using alternative animals such as rabbits, goats, and sheep, which have shown good results in serum production (6,16,20,21,22,23).
Sjostrom et al. (23) produced antivenoms in sheep and compared them with equine
commercial antivenom. Sheep presented tolerance both to Freund’s adjuvant and other adjuvants, with no local lesions. High titers of high-affinity circulating antibodies were quickly developed, but IgGT was not detected.
Crotalus durissus terrificus venom consists of highly toxic protein and non-protein
compounds. This prevents inoculation at concentrations capable of inducing adequate immune response for the needs of antivenom production (14).
Antigen detoxification or toxoid production requires that the venom loses its toxicity, but at the same time retains maximum immunogenicity (13). The use of electromagnetic or even photon radiation projects an electron and an atom, resulting in the creation of a pair of ions, positive and negative. This phenomenon, called ionization, is the main means by which the energy of ionizing radiation is transferred to biological tissues without producing radioactivity (19). Electromagnetic energy derived from Cobalt60 is used more frequently because this type
of energy does not generate heat, and can thus be applied to biological products that are usually more susceptible to relatively high temperatures (10).
D. P. Netto et al. HEMATOLOGICAL CHANGES IN SHEEP INOCULATED WITH NATURAL AND COBALT60
-IRRADIATED Crotalus durissus terrificus VENOM (Laurenti, 1768). J. Venom. Anim. Toxins incl. Trop. Dis., 2004, 10, 1, p.36.
in rats with a mixture of venoms from different Brazilian snakes, there was a slow and gradual decrease hematocrit values, erythrocyte and lymphocyte counts, and an increase in number of neutrophils and hemoglobin concentration. The number of total leukocytes oscillated, with decreases and increases throughout the experimental period (3).
Cardoso and Mota (4) suggested that the crotoxin fraction of Crotalus durissus terrificus
venom had inhibiting effects on the humoral response but did not alter cell response.
The objective of this study was to evaluate cell response in animals inoculated with Cobalt60
-irradiated venom from Crotalus durissus terrificus.
MATERIALS AND METHODS
Animals
Twelve one to two-year-old sheep were used in this study, eight females and four males of mixed Ile de France breed, with mean weight of 40 kg. Two groups of six animals were randomly formed, with two males and four females in each group. One group was inoculated with natural venom (NV) and the other with irradiated venom (IrV).
Venom
Venom was obtained from Crotalus durissus terrificus, provided by The Center for the Study
of Venoms and Venomous Animals – CEVAP – Botucatu, São Paulo State, Brazil, freeze dried, divided into two aliquots of 200 mg, and kept at 4°C. One aliquot (IrV) was submitted to gamma rays at the Institute of Energy and Nuclear Research - IPEN, University of São Paulo, SP-Brazil; the other aliquot (NV) was not treated at all.
Venom Irradiation
The freeze-dried venom aliquot was diluted in acidified saline solution (NaCl 150 mM, pH 3.0) and irradiated by a Cobalt 60 source at the dose of 5.54 x 10² Gy/h and a concentration of
2.000 Gy in the presence of O2 at room temperature. After irradiation, the venom was kept at
Sheep immunization
Both groups received three venom inoculations: the first on the day zero and the others at thirty-day intervals. The NV group received 1.0 mg and the IrV group 2.0 mg doses of venom diluted in 5.0 mL PBS, pH 7.0. Before inoculations, an equal volume of adjuvant was added to the antigens. Freund’s complete (Sigma, USA) was used in the first inoculation, Freund’s incomplete (Sigma, USA) in the second, and aluminum hydroxide adjuvant in the third. The animals were inoculated subcutaneously (SQ) in the right (5mL) and left (5mL) sub-scapular regions in a total of 10mL of antigen/adjuvant emulsion. On day zero and weekly thereafter, the animals were bled by the jugular vein to obtain total blood for eritrogram, leukogram, fibrinogen, total plasma protein, and albumin biochemical analyses.
All sheep were assessed weekly for inflammatory reactions, hemorrhagic alterations, abscess formation, and lymphonode increase at inoculation sites.
Neutralization and potency of sheep sera
In vivo test
The neutralizing capacity of antibodies induced by NV and IrV was assessed 60 days after the last inoculation. One sheep from each group was challenged intramuscularly with 1 mg/kg (LD50) of NV, as described by Araújo and Belluomini (2). The animals were observed for 48
hours post-inoculation for envenoming signs.
Laboratory testes
Individual blood samples were collected from the jugular vein using disposable needles (21G - 0.8mm) directly into 5.0 mL-vacuum tubes that contained heparin for albumin and total proteins measurements and EDTA (disodic salt of the ethylenediamine tetra-acetic acid at 10%) for CBC. Red blood cells (RBC) and white blood cells (WBC) were counted manually by hemocytometer (12). Hemoglobin concentration was determined by the cyanmethamoglobin method in a spectrophotometer at 540 nm. The packed cell volume (PCV) was determined by the microhematocrit method.
D. P. Netto et al. HEMATOLOGICAL CHANGES IN SHEEP INOCULATED WITH NATURAL AND COBALT60
-IRRADIATED Crotalus durissus terrificus VENOM (Laurenti, 1768). J. Venom. Anim. Toxins incl. Trop. Dis., 2004, 10, 1, p.38.
Total plasma protein was determined by the biuret method in a spectrophotometer at 545 nm. Albumin was determined by the bromocresol green method in a spectrophotometer at 545 nm wavelength, using ready-to-use commercial reagents. Plasma globulin was obtained from the difference between the total protein and plasma albumin.
Statistical analysis
The variables were studied in both groups (treatments) at 14 different times (CBC and biochemical analysis); analysis of variance with split plots was used (15). The F statistics calculated was significant when p<0.05. Significant tendency was 0.05<p<0.10. The contrasts between pairs of means were studied by calculating the minimum significant difference for p=0.05 by the Tukey test.
RESULTS AND DISCUSSION
At clinical examination, the animals in both groups did not present any local clinical alteration. A small volume increase in the pre-scapular lymphnodes occurred in the two weeks after administrations, but disappeared in the following weeks. Sjostrom et al. (23) also
observed that sheep tolerated different adjuvants.
Two sheep challenged with 1 mg/kg of NV, one from each group, did not present any clinical alteration of envenoming, showing that both NV and IrV were efficient in inducing neutralizing antibody production.
The RBC count of NV and IrV-inoculated sheep showed similar results and there was no interaction between groups; there was only a slight time factor effect. Hemoglobin concentration, mean corpuscular hemoglobin (MCH), and mean corpuscular hemoglobin concentration (MCHC) remained within reference ranges, behaving statistically similar to RBC count with no interaction and slight treatment effects between groups, with only a time factor effect. PCV values were similar in the two studied groups both for the analyses of time
and treatment influence; there was no significant difference between groups. The results only demonstrated stability of eritrogram parameters.
of cells than the IrV group (Figure 1, Table 1). The increase in leukocyte number to
13,000/µL in adult sheep is indicative of a slight leukocytosis (11) that occurred in the week after the first inoculation in the NV group (Figure 1, Table 1).
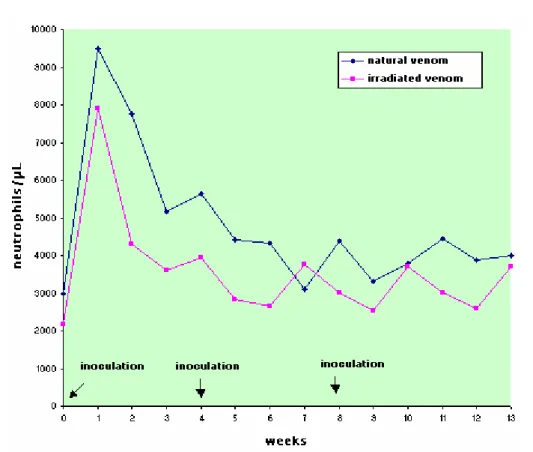
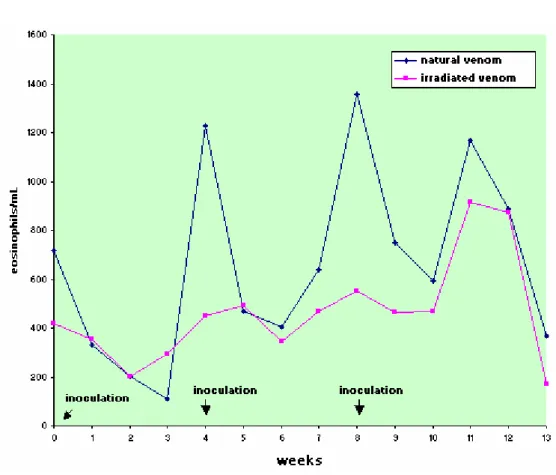
There was no statistically significant difference between the experimental groups for absolute count of segmented neutrophils, eosinophils, and lymphocytes, but there were statistically significant oscillations in values at the different collecting times.
The NV group presented an increase in the absolute neutrophil count after the first inoculation that persisted for 5 weeks. In the IrV group, the increase in neutrophils occurred only in the first week returning to normal in the following weeks (Figures 2 to 4, Table 2 to 4).
The alterations in neutrophil count are indicative of systemic inflammatory response related to cytokine release. Voronov et al. (25) described that total venom induces IL-6 systemic
release, suggesting a direct immune response and a quick inversion in the neutrophil:lymphocyte ratio, which indicates that venom can cause cytotoxic activity in addition to previous hematological and immune alterations.
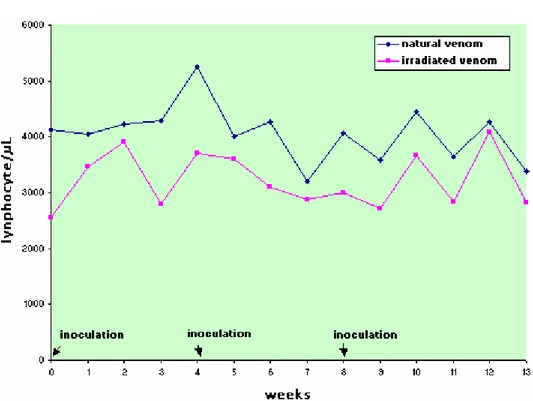
In this experiment, the neutrophil:lymphocyte ratio in both groups presented an inversion, which associated with the increase in lymphocyte number, indicates a response to systemic toxemia (11). This was more persistent in the NV group, showing its greater toxicity (Figures 2 to 4, Tables 2 to 4).
This is similar to Costa et al. (5) in Crotalus durissus terrificus venom action in rat
erythrocytes and leukocytes. The authors reported initial leukopenia, in the first half hour after inoculation, followed by leukocytosis that returned to normal at the end of the experiment. This variation was accompanied by an increase in the number of segmented neutrophils. A decrease in the globular, erythrocyte, lymphocyte, and eosinophil volumes was also observed. The authors attributed the initial leukopenia to venom action and animal organic reaction to leukocytosis, as there was a concomitant increase in the number of neutrophils.
D. P. Netto et al. HEMATOLOGICAL CHANGES IN SHEEP INOCULATED WITH NATURAL AND COBALT60
-IRRADIATED Crotalus durissus terrificus VENOM (Laurenti, 1768). J. Venom. Anim. Toxins incl. Trop. Dis., 2004, 10, 1, p.40.
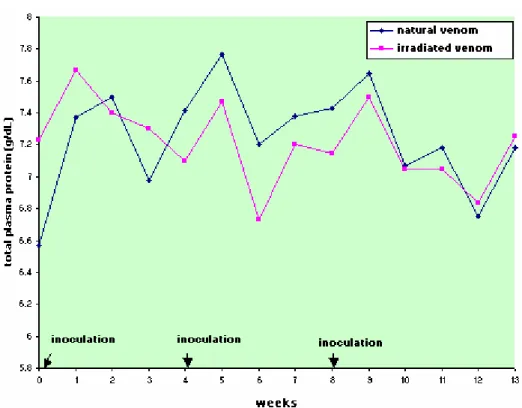
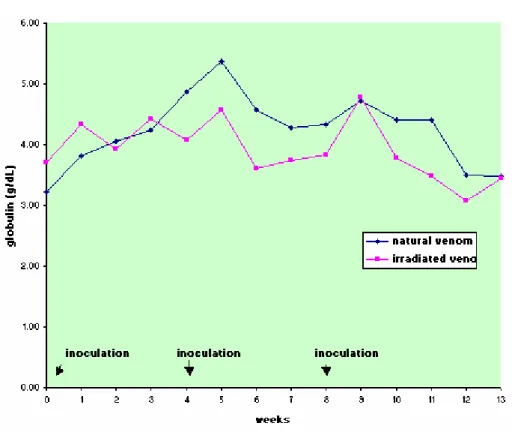
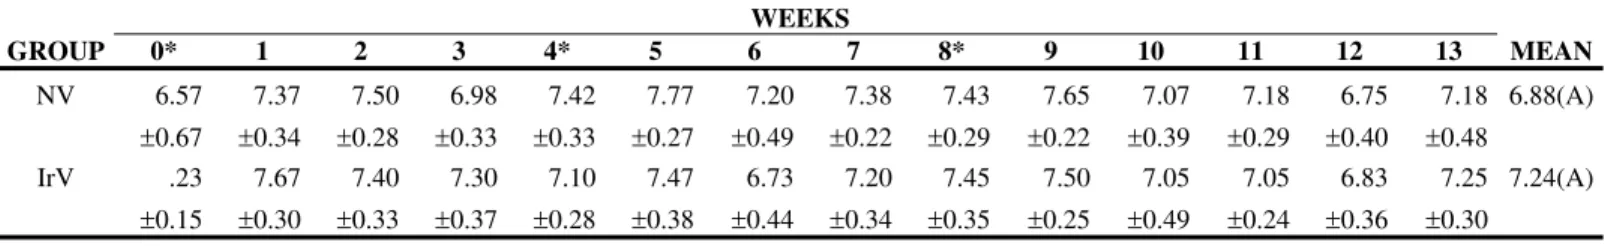
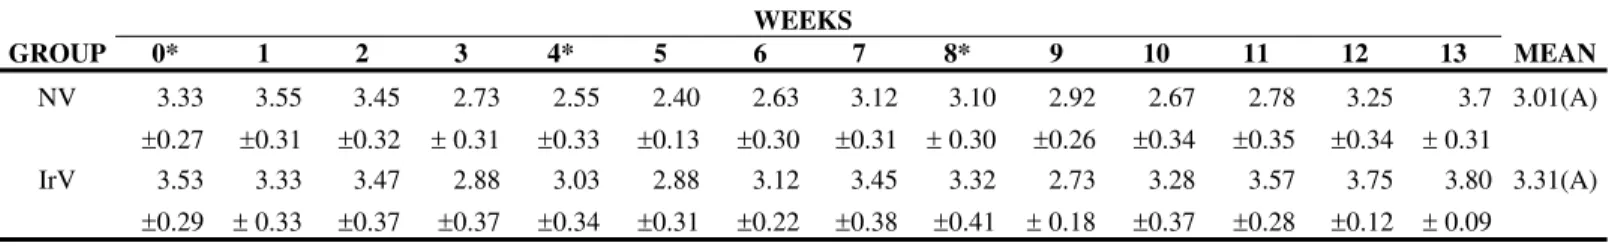
Protein, albumin, and globulin levels did not show any statistically significant differences related to interaction and treatment effect, and there was only the time factor effect (Figures 5 to 8, Table 5 to 8). Total plasma protein values (Figure 6, Table 6) for the IrV group remained normal, except in the first week after the first inoculation. The NV group presented an increase in total plasma protein values in the week after the end of inoculation. Three weeks after inoculation, there was a decrease in serum albumin values in both groups. Only the NV group presented an evident increase in globulin values.
In the first week after the first inoculation, the NV group presented an increase in fibrinogen concentration above normal limits, which remained above normal for three weeks. This was also observed after the second NV inoculation (Figure 5, Table 5). For the IrV group, the increased fibrinogen values returned to normal in the third week after the first inoculation and did not present any further alteration throughout the experiment. These increases in fibrinogen values are probably due to the acute inflammatory response caused by venom inoculation (Figure 5, Table 5).
Estrada et al. (8) assessed the PCV, hemoglobin concentration, and total serum protein in
horses inoculated with Bothrops asper, Lachesis muta, and Crotalus durissus terrificus
venoms and obtained slight or decreased changes in values, similar results to those found in this study. The authors reported the increase in total protein concentration and an albumin:globulin ratio inversion during the immunization period.
Jain (11) reported that the increase in total plasma protein level could occur as a response to acute infection due to an increase in the gammaglobulinic fraction.
Thomazini et al. (24) analyzed serum fibrinogen of patients bitten by Crotalus snakes and
reported a reduction in the values before antivenom treatment that tended to normalize after 48 hours. These results differ from those found in our experiment, where there was a significant increase in both groups in the three weeks after the first inoculation and decreased in the following weeks.
None of the sheep challenged with a lethal dose (LD50) showed any envenoming signs or
NV group (Figure 1, Table 1).
The IrV produced less intense hematological and biochemical alterations than the NV. The immunization protocol for both groups was adequate to produce effective sera with lower venom doses than those used in horses. The results of all analyses indicated that sheep are potential animals to be used in anticrotalic serum production.
D. P. Netto et al. HEMATOLOGICAL CHANGES IN SHEEP INOCULATED WITH NATURAL AND COBALT60
-IRRADIATED Crotalus durissus terrificus VENOM (Laurenti, 1768). J. Venom. Anim. Toxins incl. Trop. Dis., 2004, 10, 1, p.42.
D. P. Netto et al. HEMATOLOGICAL CHANGES IN SHEEP INOCULATED WITH NATURAL AND COBALT60
-IRRADIATED Crotalus durissus terrificus VENOM (Laurenti, 1768). J. Venom. Anim. Toxins incl. Trop. Dis., 2004, 10, 1, p.44.
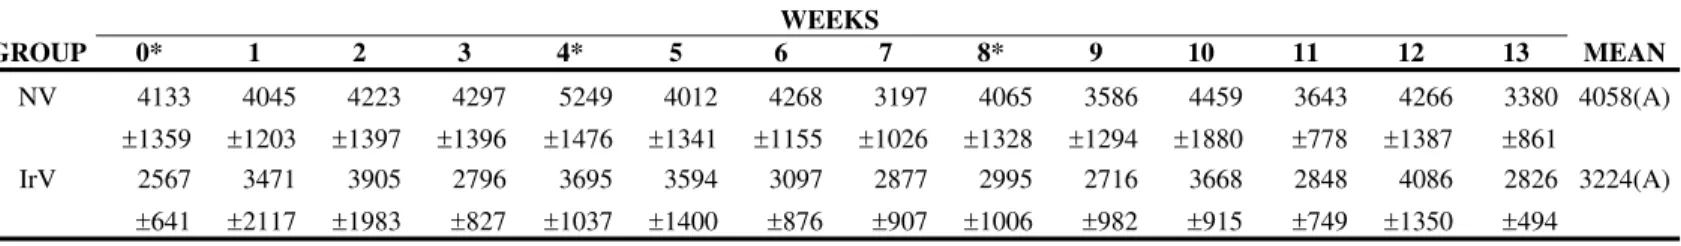
Figure 4. Mean values of lymphocyte (cells/µL) count in sheep (n=12) inoculated with natural (NV) Cobalt60-irradiated (IrV) crotalic venom.
Figure 6. Mean values of total plasma protein levels (g/dL) in sheep (n=12) inoculated with natural (NV) Cobalt60-irradiated (IrV) crotalic venom.
D. P. Netto et al. HEMATOLOGICAL CHANGES IN SHEEP INOCULATED WITH NATURAL AND COBALT60
-IRRADIATED Crotalus durissus terrificus VENOM (Laurenti, 1768). J. Venom. Anim. Toxins incl. Trop. Dis., 2004, 10, 1, p.46.
Table 1. Means and standard deviation of leukocytes count (cells/µL) in sheep (n=12) inoculated at days zero, 30, and 60 with natural (NV) and Cobalt60-irradiated (IrV) crotalic venom.
WEEKS
GROUP 0* 1 2 3 4* 5 6 7 8* 9 10 11 12 13 MEAN
NV 7825
±2387 13900 ±6638 12225 ±4957 9775 ±4072 12125 ±4897 8883 ±3215 9000 ±3024 6908 ±1999 9842 ±4441 7683 ±2827 8833 ±3098 9308 ±2744 9083 ±3143 7742 ±1463 9509(A)
IrV 5200
±1186 11783 ±7536 8502 ±3768 6708 ±3413 8108 ±3625 6917 ±2278 6108 ±1546 7117 ±2362 6575 ±1970 5750 ±1587 7825 ±1204 6817 ±1307 7567 ±1832 6717 ±2131 7264(B)
MEAN 6513(a) 12842(b) 10363(b) 8242(b) 10117(b) 7900(a) 7554(a) 7013(a) 8208(b) 6717(a) 8329(b) 8063(b) 8325(b) 7229(a) *Inoculations
Difference between groups: F=5.30; p<0.05, GI>GII. Difference between times: F=1.79; p>0.05. Interaction: F= 1.02; p>0.10 Different capital letters show significant statistical differences between groups.
Different lowercase letters show significant statistical differences between times.
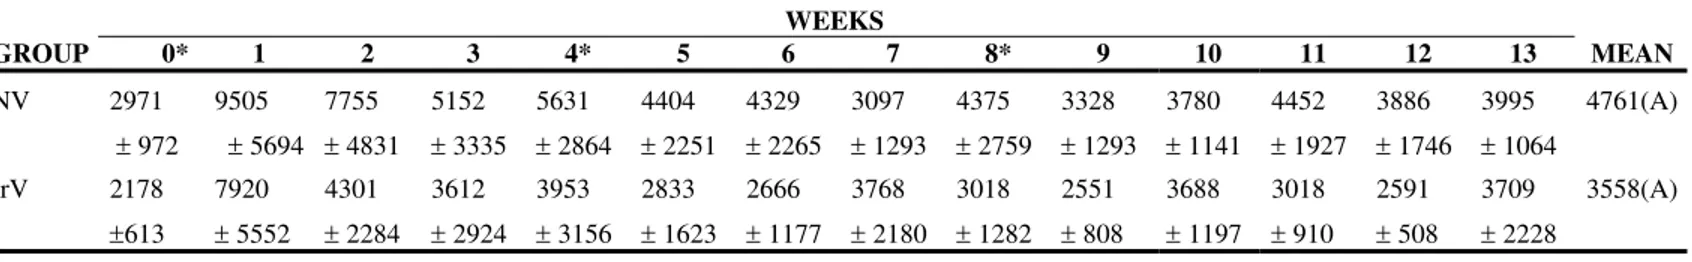
Table 2. Means and standard deviation of neutrophil count (cells/µL) in sheep (n=12) inoculated at days zero, 30, and 60 with natural (NV) and Cobalt60-irradiated (IrV) crotalic venom.
WEEKS
GROUP 0* 1 2 3 4* 5 6 7 8* 9 10 11 12 13 MEAN
NV 2971
± 972 9505 ± 5694
7755
± 4831 5152
± 3335 5631
± 2864 4404
± 2251 4329
± 2265 3097
± 1293 4375
± 2759 3328
± 1293 3780
± 1141 4452
± 1927 3886
± 1746 3995
± 1064
4761(A)
IrV 2178
±613
7920
± 5552 4301
± 2284 3612
± 2924 3953
± 3156 2833
± 1623 2666
± 1177 3768
± 2180 3018
± 1282 2551
± 808 3688
± 1197 3018
± 910 2591
± 508 3709
± 2228
3558(A)
MEAN 2574(a) 8713(b) 6028(b) 4382(a) 4792(a) 3618(a) 3498(a) 3433(a) 3696(a) 2939(a) 3734(a) 3735(a) 3238(a) 3852(a) * Inoculations
Difference between groups: F=3.15; p>0.05, GI=GII. Difference between times: F=5.35; p<0.05. Interaction: F= 0.51; p>0.50 Different capital letters show significant statistical differences between groups.
D. P. Netto et al. HEMATOLOGICAL CHANGES IN SHEEP INOCULATED WITH NATURAL AND COBALT60
-IRRADIATED Crotalus durissus terrificus VENOM (Laurenti, 1768). J. Venom. Anim. Toxins incl. Trop. Dis., 2004, 10, 1, p.48.
Table 3. Means and standard deviation of eosinophil count (cells/µL) in sheep (n=12) inoculated at days zero, 30, and 60 with natural (NV) and Cobalt60-irradiated (IrV) crotalic venom.
WEEKS
GROUP 0* 1 2 3 4* 5 6 7 8* 9 10 11 12 13 MEAN
NV 716 ± 233 332 ± 240 202 ± 172 110 ± 140 1226 ± 1600 468 ± 483 403 ± 468 638 ±354 1358 ± 1444 751 ± 675 595 ± 538 1167 ± 640 887 ± 553 367 ± 243 659(A) IrV 420 ± 360 354 ± 367 201 ± 259 292 ± 205 452 ± 425 490 ± 704 346 ± 441 471 ± 162 553 ± 228 466 ± 279 469 ± 295 916 ± 564 875 ± 869 172 ± 171 463(A)
MEAN 568(b) 343(b) 202(a) 201(a) 839(c) 479(b) 374(b) 555(b) 956(c) 609(b) 532(b) 1041(c) 881(c) 269(a)
* Inoculations
Difference between groups: F=0.97; p>0.10, GI=GII. Difference between times: F=3.90; p<0.05. Interaction: F= 1.03; p>0.05 Different capital letters show significant statistical differences between groups.
Different lowercase letters show significant statistical differences between times.
Table 4. Means and standard deviation of lymphocyte count (cells/µL) in sheep (n=12) inoculated at days zero, 30, and 60 with natural (NV) and Cobalt60- irradiated (IrV) crotalic venom.
WEEKS
GROUP 0* 1 2 3 4* 5 6 7 8* 9 10 11 12 13 MEAN
NV 4133
±1359 4045 ±1203 4223 ±1397 4297 ±1396 5249 ±1476 4012 ±1341 4268 ±1155 3197 ±1026 4065 ±1328 3586 ±1294 4459 ±1880 3643 ±778 4266 ±1387 3380 ±861 4058(A) IrV 2567 ±641 3471 ±2117 3905 ±1983 2796 ±827 3695 ±1037 3594 ±1400 3097 ±876 2877 ±907 2995 ±1006 2716 ±982 3668 ±915 2848 ±749 4086 ±1350 2826 ±494 3224(A)
MEAN 3350(a) 3758(a) 4064(a) 3547(a) 4472(b) 3803(a) 3682(a) 3037(c) 3530(a) 3151(c) 4063(a) 3245(a) 4176(a) 3103(c)
* Inoculations
Difference between groups: F=2.77; p>0.05, GI=GII. Difference between times: F= 3,11; p<0,05. Interaction: F= 0.87; p>0.10 Different capital letters show significant statistical differences between groups.
Table 5. Means and standard deviation of fibrinogen (mg/dL) in sheep (n=12) inoculated at days zero, 30, and 60 with natural (NV) and Cobalt60-irradiated (IrV) crotalic venom.
WEEKS
GROUP 0* 1 2 3 4* 5 6 7 8* 9 10 11 12 13 MEAN
NV 266.7
±103.3
533.3 ±
242.2 733.3
±372.4
666.7
± 432
266.7 ±103.3 500 ±469 466.7 ±273.3 266.7 ±103.3 200.0
± 109.5
233.3
± 81.6
333.3
±163.3 333.3
±103.3
300.0
± 109.5
300.0
± 109.5
385.7(A)
IrV 216.7
± 98.3
600.0
± 219.1 466.7 ±103.3 366.7 ±150.6 300.0 ±167.3 266.7 ±103.3 366.7 ±265.8 216.7
± 98.3
250.0
±137.8
233.3
±81.6
200.0 ± 0
316.7 ±183.5 400.0 ±126.5 267.0 ±103.0 319.0(A)
MEAN 241.7(a) 66.7(b) 600(b) 516.7(b) 283.3(a) 383.3(a) 416.7(a) 241.7(a) 225(a) 233.3(a) 266.7(a) 325(a) 350(a) 283(a)
* Inoculations
Difference between groups: F=1,78; p>0,10, GI=GII. Difference between times: F= 5,64; p<0,05. Interaction: F= 1.40; p>0.05 Different capital letters show significant statistical differences between groups.
Different lowercase letters show significant statistical differences between times.
Table 6. Means and standard deviation of plasma protein (g/dL) in sheep (n=12) inoculated at days zero, 30, and 60 with natural (NV) and Cobalt60-irradiated (IrV) crotalic venom.
WEEKS
GROUP 0* 1 2 3 4* 5 6 7 8* 9 10 11 12 13 MEAN
NV 6.57 ±0.67 7.37 ±0.34 7.50 ±0.28 6.98 ±0.33 7.42 ±0.33 7.77 ±0.27 7.20 ±0.49 7.38 ±0.22 7.43 ±0.29 7.65 ±0.22 7.07 ±0.39 7.18 ±0.29 6.75 ±0.40 7.18 ±0.48 6.88(A) IrV .23 ±0.15 7.67 ±0.30 7.40 ±0.33 7.30 ±0.37 7.10 ±0.28 7.47 ±0.38 6.73 ±0.44 7.20 ±0.34 7.45 ±0.35 7.50 ±0.25 7.05 ±0.49 7.05 ±0.24 6.83 ±0.36 7.25 ±0.30 7.24(A)
MEAN 6.90(a) 7.52(a) 7.45(a) 7.14(a) 7.26(a) 7.62(a) 6.96(b) 7.29(c) 7.44(c) 7.57(b) 7.06(b) 7.11(b) 6.79(a) 7.22(b)
* Inoculations
Difference between groups: F=0,16; p>0,50, GI=GII. Difference between times: F= 35,60; p<0,05. Interaction: F= 1.05; p>0.05 Different capital letters show significant statistical differences between groups.
D. P. Netto et al. HEMATOLOGICAL CHANGES IN SHEEP INOCULATED WITH NATURAL AND COBALT60
-IRRADIATED Crotalus durissus terrificus VENOM (Laurenti, 1768). J. Venom. Anim. Toxins incl. Trop. Dis., 2004, 10, 1, p.50.
Table 7. Means and standard deviation of albumin (g/dL) in sheep (n=12) inoculated at days zero, 30, and 60 with natural (NV) and Cobalt60
-irradiated (IrV) crotalic venom.
WEEKS
GROUP 0* 1 2 3 4* 5 6 7 8* 9 10 11 12 13 MEAN
NV 3.33 ±0.27 3.55 ±0.31 3.45 ±0.32 2.73
± 0.31 2.55 ±0.33 2.40 ±0.13 2.63 ±0.30 3.12 ±0.31 3.10
± 0.30 2.92 ±0.26 2.67 ±0.34 2.78 ±0.35 3.25 ±0.34 3.7
± 0.31
3.01(A)
IrV 3.53
±0.29 3.33
± 0.33
3.47 ±0.37 2.88 ±0.37 3.03 ±0.34 2.88 ±0.31 3.12 ±0.22 3.45 ±0.38 3.32 ±0.41 2.73
± 0.18
3.28 ±0.37 3.57 ±0.28 3.75 ±0.12 3.80
± 0.09
3.31(A)
MEAN 3.43(a) 3.44(a) 3.46(a) 2.80(b) 2.79(b) 2.64(b) 2.87(b) 3.28(a) 3.21(a) 2.82(b) 2.97(b) 3.17(b) 3.50(a) 3.75(a)
* Inoculations
Difference between groups: F=0,59; p>0,50, GI=GII. Difference between times: F= 22,93; p<0,05. Interaction: F= 1.34; p>0.05 Different capital letters show significant statistical differences between groups.
Different lowercase letters show significant statistical differences between times.
Table 8. Means and standard deviation of globulin (g/dL) in sheep (n=12) inoculated at days zero, 30, and 60 with natural (NV) and Cobalt60
-irradiated (IrV) crotalic venom.
WEEKS
GROUP 0* 1 2 3 4* 5 6 7 8* 9 10 11 12 13 MEAN
NV 3.23 ±0.77 3.82 ±0.43 4.05 ±0.28 4.25 ±0.51 4.87 ±0.41 5.37 ±0.24 4.57 ±0.73 4.27 ±0.50 4.33 ±0.51 4.73 ±0.41 4.40 ±0.29 4.40 ±0.44 3.50 ±0.53 3.48 ±0.53 4.23(A) IrV 3.70 ±0.33 4.33 ±0.48 3.93 ±0.31 4.42 ±0.57 4.07 ±0.37 4.58 ±0.37 3.62 ±0.39 3.75 ±0.68 3.83 ±0.10 4.77 ±0.23 3.77 ±0.82 3.48 ±0.49 3.08 ±0.31 3.45 ±0.50 3.91(A)
MEAN 3.46(a) 4.07(a) 3.99(a) 4.33(a) 4.47(b) 4.97(a) 4.09(b) 4.01(c) 4.08(c) 4.75(a) 4.08(a) 3.94(a) 3.29(a) 3.46(a)
* Inoculations
Difference between groups: F=1,12; p>0,10, GI=GII. Difference between times: F= 37,95; p<0,05. Interaction: F= 0.82; p>0.05 Different capital letters show significant statistical differences between groups.
1, p.51.
REFERENCES
1 AMARAL CFS., REZENDE NA., PEDROSA TMG., SILVA AO., PEDROSO ERP. Afibrinogenemia secundária a acidente crotálico (Crotalus durissus terrificus). Rev.
Inst. Med. trop.São Paulo, 1988, 4, 288-92.
2 ARAÚJO P., BELLUOMINI HE. Toxicidade de venenos ofídicos – I - Sensibilidade específica de animais domésticos e de laboratório. Mem. Inst. Butantan, 1960-62,
30, 133-42.
3 BARRAVIERA B., PERAÇOLI MTS. Soroterapia heteróloga. In: BARRAVIERA B.
Venenos animais: uma visão integrada. Rio de Janeiro: Editora de Publicações
Científicas, 1994: 361-2.
4 CARDOSO DF., MOTA I. Effect of Crotalus venom on the humoral and cellular immune
response. Toxicon, 1997, 35, 607-12.
5 COSTA PI., GARCIA-LIMA E., LAURE CJ. Rattlesnake venom: action upon erythrocytes and leucocytes of rats. Acta Physiol. Pharmacol. Latinoam., 1989, 39, 359-73.
6 EGEN N., RUSSEL F., CONSROE P., GERRISH K., DART R.. A new ovine Fab
antivenom for North American venomous snakes. Vet. Hum. Toxicol., 1994, 36, 362
7 EK N. Serum levels of the immunoglobulins IgG and IgG(T) in horses. Acta Vet. Scand.,
1974, 15, 609-19.
8 ESTRADA R., CHAVES F., ROBLES A., ROJAS E., SEGURA E., GUTIÉRREZ JM. Valores hematológicos y de enzimas séricas en caballos inoculados com venenos de serpientes para la producción de antivenenos en Costa Rica. Vet. Biol. Trop., 1992,
40, 95-9.
9 FAN WF., FRANÇA FOS. Acidente por cobras. In: SCHVARTSMAN S. Plantas
venenosas e animais peçonhentos. 2.ed. São Paulo: Sarvier, 1992: 143-8.
10 GUIDOLIN R., CORREA A., CICARELLI RMB., PREVIDE E., MORAIS JF.,
HIGASHI HG. Esterilização de soros e vacinas por radiação gama de Cobalto. Rev.
Saúde Pública, 1988, 22, 113-7.
11 JAIN NC. Schalm’s veterinary hematology. 4ed. Philadelphia: Lea & Febiger, 1986.
1221p.
12 JAIN NC. Essentials of veterinary hematology. Philadelphia: Lea & Febiger, 1993.
D. P. Netto et al. HEMATOLOGICAL CHANGES IN SHEEP INOCULATED WITH NATURAL AND COBALT60
-IRRADIATED Crotalus durissus terrificus VENOM (Laurenti, 1768). J. Venom. Anim. Toxins incl. Trop. Dis., 2004, 10, 1, p.52.
13 KHAN ZH., LARI FA., ALI Z. Preparation of toxoids from the venoms of Pakistan species of snakes (Naja naja, Vipera russelii and Echis carinatus). Jpn. J. Med. Sci.
Biol., 1977, 30, 19-23.
14 MURATA Y., ROGERO JR. Análise cromatográfica por exclusão em amostras de veneno de cascavel irradiadas com Co60., Publ. Ipen, 1988, 154, 1-7.
15 PIMENTEL GOMES F. Estatística experimental. São Paulo: Nobel, 1969. 446p.
16 RAWAT S., LAING G., SMITH DC., THEAKSTON D., LANDON J. A new antivenom to treat eastern coral snake (Micrurus fulvius fulvius) envenoming. Toxicon, 1994, 32,
185-90
17 RESENDE CC., ARAÚJO FAA., SALLENAVE RNUR. Análise epidemiológica dos
acidentes ofídicos. Brasil – junho de 1986 a dezembro de 1987. Brasília: Ministério
da Saúde. Secretaria Nacional de Ações Básicas de Saúde,1989. 37p.
18 RIBEIRO LA. Epidemiology of ophidic accidents. Mem. Inst. Butantan, 1990, Supl.52,
15-6.
19 ROGERO JR., NASCIMENTO N. Atenuação da toxicidade de venenos ofídicos por meio da radiação ionizante. Biotecnol. Cienc. Desenvolv.,1997, 1, 24-6.
20 RUSSEL FE., LAURITZEN L. Antivenins. Trans. R. Soc. trop. Med. Hyg., 1966, 60,
797- 801.
21 RUSSEL FE., TIMMERMAN WF., MEADOWS PE. Clinical use of antivenin prepared from goat serum. Toxicon, 1970, 8, 63-5.
22 SALAFRANCA ES. Irradiated cobra (Naja naja philippinensis) venom. Int. J. Appl.
Radiat. Isot., 1973, 24, 60.
23 SJOSTROM L., AL-ABDULLA IH., RAWAT S., SMITH DC., LANDON J. A comparison of ovine and equine antivenoms. Toxicon, 1994, 32, 427-33.
24 THOMAZINI IA., IUAN FC., CARVALHO I., HERNANDES DH., AMARAL IF., PEREIRA PCM., BARRAVIERA B. Evaluation of platelet function and of serum fibrinogen levels in patients bitten by snakes of the genus Crotalus. Preliminary
report. Rev. Inst. Med. Trop. São Paulo, 1991, 3, 219-20.
25 VORONOV E., APTE RN., SOFER S. The systemic inflammatory response syndrome related to the release of cytokines following severe envenomation. J. Venom. Anim.