Engineering ISSN: 1809-4430 (on-line)
_________________________
2 São Paulo State University (Unesp), School of Agricultural and Veterinarian Sciences, Jaboticabal/ Jaboticabal - SP, Brazil.
Received in: 2-29-2016
MECHANIZED AND INDIVIDUALIZED APPLICATION OF N-P-K IN COMBINED OPERATIONS IN SUGARCANE
Doi:http://dx.doi.org/10.1590/1809-4430-Eng.Agric.v37n4p676-688/2017
FRANCIELE M. CARNEIRO1*, CARLOS E. A. FURLANI2, LUCAS A. DA S. GÍRIO2,
ROUVERSON P. DA SILVA2, EUCLIDES B. MALHEIROS2
1*Corresponding author. São Paulo State University (Unesp), School of Agricultural and Veterinarian Sciences,
Jaboticabal/ Jaboticabal – SP. Brazil. E-mail: [email protected]
ABSTRACT: A new concept of fertilizer machine is under development and shows as differential individually fertilizer application, that is sources of N, P and K are applied separately for the purpose of improving the distribution efficiency of the quantities applied. The aim was to compare the quality of the individualized mechanized distribution of N, P and K in combined operations with and without herbicide application, as well as to evaluate the fertilizer application on each side of the fertilizer machine. The experiment was carried out on Cascavel farm, in the municipality of Matão-SP. The experimental design was established according to the criteria of quality control, and variables monitoring carried out in the place during fertilization operation, having the fertilizer distribution operation; simultaneous operation of fertilizer distribution and herbicide application treatments; and two simple operations, fertilizer distribution followed by herbicide application. We concluded that the better operational quality was in two distinct operations. The right side of the fertilizer had the best result because it applied the amount close to the regulated dosage. The distribution of potassium chloride expressed in the control charts greater operational quality compared to other fertilizers.
KEYWORDS: statistical process control, fertilizer, operational quality, fertilizer machine.
INTRODUCTION
The agricultural mechanization of sugarcane showed several changes since the 1990s, due to the establishment of recent technologies in both planting and harvesting through georeferencing (Torquato, 2013).
Thus, with the expansion of crop cultivation areas, mechanized fertilization proves to be fundamental for the operational performance increase.
As for fertilization, it is directly related to productivity, since dosages of fertilizers applied appropriately, according to the result of the soil analysis, giving the plant satisfactory development, benefiting the expected productivity. Therefore, most crops require one or more cover fertilization due to the nutritional requirements of each one. During the fertilizers application, inadequate fertilizer distribution can occur through agricultural equipment, due to the lack of precision in the dosing or distributor mechanism; lack of knowledge of the fertilizer characterization; among others, so this inadequate distribution can affect productivity (Baio et al., 2012).
Excess of fertilizer application can cause environmental impact and increases expense, but the deficit causes less plant development, as well as reduces productivity (Milan & Gadanha, 1996; Motomiya et al., 2009).
Mechanical fertilization may present some problems during fertilizer distribution, such as fluidity, segregation, bead size, angle of rest, among others. According to Molin et al. (2009), there are still few studies at national level on the particularity of segregation, both in fertilizer machines and in research on the quality of fertilizers.
The aim of this study was to compare the quality indicators of the mechanized and individualized distribution of N, P and K in the combined operations, with and without herbicide application, as well as the application of fertilizers in relation to the sides of the fertilizer.
MATERIAL AND METHODS
The experiment was developed in the city of Matão, state of São Paulo, Brazil. The experimental cultivation area of sugarcane belongs to the Cascavel farm, has 1.66 ha and is situated in the geographical coordinates: Latitude 21º35’55.03”S and longitude 48º25’21.12”W with an altitude of 589 m and a seven year history of cultivation.
The climate was classified as Aw according to the classification of Köppen and average annual rainfall of 1400 mm. The soil of the area was classified as Dystrophic Yellow Latosol (Oxisols) (Embrapa, 2013), sand/medium texture and average with slope of approximately 2%.
The planted cultivar was RB 86 7515, cultivated since 2008 and harvested in the sixth cut on August 21st, 2014. Approximately 60 days after the harvest, individualized mechanized fertilization
was carried out.
To carry out the fertilization, a tractor-fertilizer set was used, in which the tractor had the following specifications: John Deere brand, 6145J model, 107 kW of engine power at rated speed, capacity of 300 L in fuel tank and PowerQuad 16x16 transmission, 4x2 FWD traction, 1.80 m gauge and 18.4-26 front tires and 24.5- 32 rear. During the operations, the 2nd gear was used, with
rotation of 1800 rpm in the engine and average speed of 5.7 km h-1.
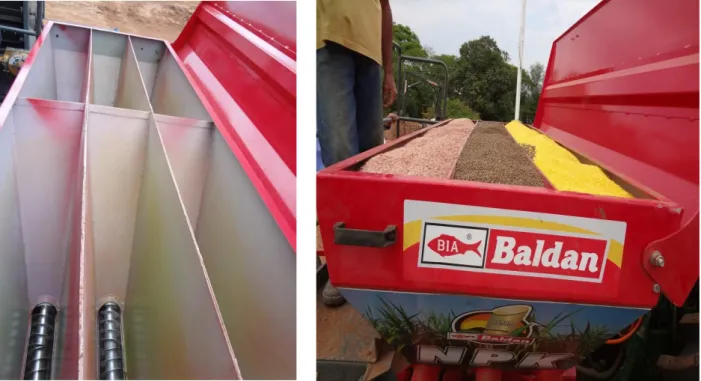
FIGURE 1.Individualized reservoir of the fertilizer-formulator for sugarcane CAMB-AP line model.
The regulation of the fertilizer was established based on the quantities of fertilizers applied in the property, being: 434 kg ha-1 of protected urea (45% of N), 153 kg ha-1 of MAP (45% of P
2O5
and 11% of N) and 283 kg ha-1 of KCl (60% of K 2O).
As a quality indicator, the efficiency of fertilizer distribution was used, evaluating the amount of fertilizer applied, being the treatments T1 - fertilizer distribution operation; T2 - simultaneous operation of fertilizer distribution and herbicide application; and T3 - two simple operations, distribution of fertilizer followed by herbicide application. Therefore, the herbicide was not evaluated, because the focus of the study was to identify the best individualized distribution of fertilizers in function of the operations, as well as the side of the fertilizer. For this, the collection of each fertilizer at the outputs of the conductive tubes of the machine on the left and right sides was made; the material was packed in plastic bags and later weighed. The collection (or samples) points had the distance of 30 m between them. In total there were 30 collection points for each fertilizer, totaling 90 sampling points.
The design was established according to the criteria of the quality control (Montgomery, 2009), and the monitoring of the variables carried out in the space during the fertilization operation.
Descriptive analysis was carried out using measurements of central tendency (average and median), position (standard deviation, amplitude, minimum and maximum), dispersion (coefficient of variation) and measures of distribution pattern (asymmetry and kurtosis coefficients). The normality of the distributions was made through the Ryan-Joiner normality test, due to the number of sampling points being greater than 25.
Statistical process control (SPC) was also used to compare the quality of operations through the individualized distribution of fertilizers. Individual and Moving Range control charts were generated containing the upper and lower control limits (calculated in function of average plus or minus three times the standard deviation), average and amplitude.
TABLE 1. Specific control limits used to estimate the dosage of fertilizer collected in the cultivation of sugarcane.
Indicator of quality in mechanized
fertilization Lower specific limit (LSL) GOAL Upper specific limit (USL) Protected urea (kg ha-1)
347 434 521
MAP (kg ha-1)
122 153 184
Potassium chloride (kg ha-1) 226 283 340
RESULTS AND DISCUSSION
Descriptive statistics on the Urea distribution
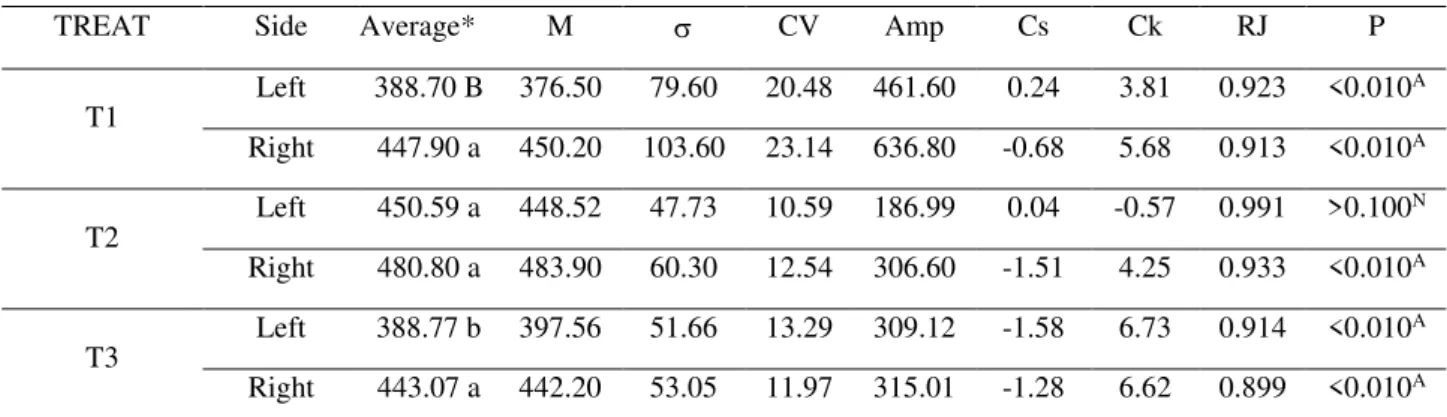
The descriptive statistical analysis of the protected urea distribution is shown in Table 2. The combined operation (treatment 2) showed higher average (450.59 kg ha-1 and 480.80 kg ha-1) on
both sides, while in the operation with only fertilizer distribution (treatment 1) with averages of 388.70 and 447.90 kg ha-1 and two operations (treatment 3) with values of 388.77 and 443.07 kg ha -1 showed close values, however, the highest dispersion observed in the standard deviation was the
treatment with fertilizer distribution.
In Table 2, the average values were relatively close to the median values for all treatments, indicating symmetry of frequency distribution. Regarding the coefficient of variation (CV), both the combined operation and the two operations had average CV ranging from 10.59% to 13.29%, however only the fertilization operation obtained CV of 20.48%, being high, according to the classification of Gomes & Garcia (2002).
TABLE 2.Descriptive analysis of protected urea distribution according to the operations.
TREAT Side Average* M CV Amp Cs Ck RJ P
T1 Left 388.70 B 376.50 79.60 20.48 461.60 0.24 3.81 0.923 <0.010
A
Right 447.90 a 450.20 103.60 23.14 636.80 -0.68 5.68 0.913 <0.010A
T2 Left 450.59 a 448.52 47.73 10.59 186.99 0.04 -0.57 0.991 >0.100
N
Right 480.80 a 483.90 60.30 12.54 306.60 -1.51 4.25 0.933 <0.010A
T3 Left 388.77 b 397.56 51.66 13.29 309.12 -1.58 6.73 0.914 <0.010
A
Right 443.07 a 442.20 53.05 11.97 315.01 -1.28 6.62 0.899 <0.010A
TREAT: Treatment; M: median; σ: standard deviation; CV: coefficient of variation; Amp: amplitude; Cs: coefficient of
asymmetry; Ck: coefficient of kurtosis; RJ: Ryan-Joiner Normal Test; P: probability value using the Ryan-Joiner test; A:
asymmetric distribution with p <0.05.* Averages followed by the same letter do not have statistical difference, at the 5% probability level, by the Tukey test.
T1 - fertilizer distribution only; T2 - simultaneous operation of fertilizer distribution and herbicide application; and T3 - two simple operations, distribution of fertilizer followed by herbicide application.
The coefficient of variation serves as a quality parameter for the experiments, so that the field work has the notes, being: less than or equal to 10% (CV is low); between 10 and 20% (average CV); 20 to 30% (high CV); and above 30% (CV is very high). Thus, for experiments carried out in the laboratory, they usually have low CV, because in this place some factors can be controlled, such as temperature, luminosity, humidity among others, while in field work these factors interfere (Gomes & Garcia, 2002).
The asymmetric coefficient (Cs) for the treatments on the left side of the combined operation and in only fertilization showed positive asymmetric distribution (Cs> 0), respectively, with small and moderate intensity, but the right side of these treatments showed a negative asymmetric distribution (Cs<0) with an intensity of moderate asymmetry (0.15<|Cs|>1) and high (|Cs|>1). In the treatment of two operations, it showed asymmetric negative distribution (Cs <0) with the high degree of asymmetry (|Cs|> 1).
Regarding the coefficients of kurtosis (Ck) in the combined operation treatments on the right side, both right side and left side of the operations with only fertilization and two operations showed leptokurtic distribution (Ck> 0), showing more concentrated data with a curve more elongated vertically, however, the left side of the combined operation demonstrated platykurtic distribution (Ck <0).
Noronha et al. (2011) also obtained these results by descriptive analysis, and the asymmetric coefficients showed positive and negative asymmetric distributions, but in the kurtosis coefficient, values were close to 0. According to this author, the asymmetry and kurtosis coefficients served as parameters to verify the distribution of the data, and, in addition, they allow the verification of the normality or not of the variables.
The values of the average, median, standard deviation of this study were higher in relation to the study of Suguisawa (2004) evaluating the cover fertilization in wheat, but the asymmetry coefficient observed in this study was smaller compared to the data obtained by the mentioned author.
When compared to the results found by Zerbato et al. (2014) in peanut crop and Albiero et al. (2012) in the longitudinal distribution of seeds, the data were non-normal by the Anderson-Darling normality test.
Zerbato et al. (2014) report that the values of the kurtosis and asymmetry coefficients were greater than 0, and the asymmetry coefficient (Cs) showed positive asymmetric distribution (Cs> 0) and high asymmetry intensity (|Cs|> 1), while the kurtosis coefficient (Ck) had leptokurtic distribution with an elongated curve and with more agglomerated data.
Ryan-Joiner normality tests, at the 5% level, only on the left side of the combined operation were normal, however on the other sides and treatments obtained non-normality (Table 2).
Noronha et al. (2011), analyzing mechanized sugarcane harvest, have found abnormality in some variables by the normality test, so that hypothesis tests, such as Shapiro-Wilk or Ryan-Joiner, Anderson-Darling, and Kolmogorov-Smirnov severely analyze the normality of the variables, and, in most cases, these tests reject the normality hypothesis.
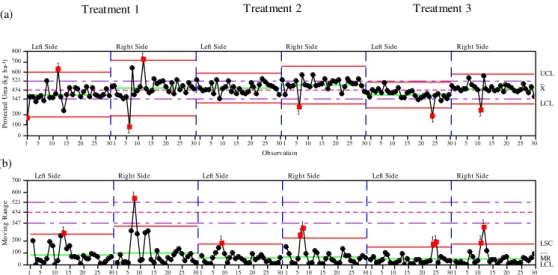
In the control chart of individual values (Figure 2a) and Moving Range (Figure 2b) of the protected urea distribution, there was lower variability in the treatment with two operations, in which it presented a point out of control on both sides, however the greater variability observed was the treatment with fertilizer distribution operation, in addition, in these treatments, points outside the control limits were observed, leaving the process with instability, being caused by special causes, probably due to inadequate regulation, embedding, fertilization without the use of the automatic pilot, among others.
Thus, the greater the number of points outside the control being induced by special causes, the lower the operational quality, since quality is inversely proportional to variability.
30 25 20 15 10 5 1 30 25 20 15 10 5 1 30 25 20 15 10 5 1 30 25 20 15 10 5 1 30 25 20 15 10 5 1 30 25 20 15 10 5 1 800 700 600 521 434 347 200 100 0 Observation P ro te ct ed U re a (k g h a-¹) _ X UCL LCL
Left Side Right Side Left Side Right Side Left Side Right Side
30 25 20 15 10 5 1 30 25 20 15 10 5 1 30 25 20 15 10 5 1 30 25 20 15 10 5 1 30 25 20 15 10 5 1 30 25 20 15 10 5 1 700 600 521 434 347 200 100 0 Observation M ov in g R an g e __ MR LSC LCL
Left Side Right Side Left Side Right Side Left Side Right Side
1 1 1 1 1 1 1 1 1 1 1 1 1 1 1 1 Treatment 1
Urea Distribution by the fertilizer
Treatment 2 Treatment 3
(a)
(b)
FIGURE 2. Control chart of individual values (a) and Moving Range (b) of distribution of protected urea in terms of operations.
UCL: Upper Control Limit; X : arithmetic average of the individual values; USL: Upper Specific Limit; LSL: Lower
Specific Limit; LCL: Lower Control Limit; M R : Average individual Moving Range.
T1 - fertilizer distribution operation; T2 - simultaneous operation of fertilizer distribution and herbicide application; and T3 - two simple operations, distribution of fertilizer followed by herbicide application.
As for the specific limits of the individual value charts, all treatments showed points out of control on the left and right sides, respectively, 5, 4, 2, 7, 1 and 3 (Figure 2a). In the Moving Range control chart (Figure 2b), in the three operations on both sides of the fertilizer, the majority of the values were below the acceptable margin (347 kg ha-1), observing no point between these limits.
When the points out of control are found in the process, it is recommended to solve the problem faster, trying to minimize the performance of special causes through monitoring, aiming to increase operational quality.
Bonotto et al. (2013) compared the performance of five fertilizer dosing mechanisms (helical metering, fluted roller and star disc) of in-line seeder and observed variations in the dosage applied by these dosing as a function of the longitudinal distribution, in a way that the fertilization carried out by seeder can be uneven during fertilizer distribution, even if the machine is in level.
As was seen by Motomiya et al. (2014), due to the increasing cost of nitrogen fertilizers and high losses, it is fundamental to use practices that increase the efficiency of the use of this fertilizer by plants as well as the reduction of environmental impact.
Fertilizer analysis
All fertilizers were applied in doses higher than those regulated in the fertilizer, with protected urea (N) being applied in a larger quantity compared to MAP (P) and potassium chloride (K), so it was the first nutrient to end in the fertilizer reservoir.
At certain points during the experiment, there were embeddings in the cutout disks with the sugarcane straw, resulting in lower tractor speed, skating, greater force required by the tractor, providing greater fuel consumption and oil flow of the agricultural equipment, a fact that may have influenced the greater distribution of protected urea. In addition, this fertilizer has the lowest angle of rest compared to MAP and potassium chloride, demonstrating greater easiness and better distribution of fertilizers, because the lower this angle is the greater will be the fertilizer flow in the dosing mechanism of the fertilizer.
Reynaldo (2013) tested several types of augers manufactured in Brazil, being the most used in seeder-fertilizer. According to the author, these dosing mechanisms demonstrated inefficiency in the distribution of fertilizers in longitudinal slope, mainly at 5 and 15° with base on the axis of rotation of this mechanism.
Probably one of the main special causes was found in the dosing mechanism because it does not have precision in the distribution of fertilizers.
The augers with a thread pitch lower than 2” expressed a high variation in the distribution of fertilizers, such as PLASA 1 (12.4%) and SEMAN 1 (26.1%), in relation to the dosing mechanisms with thread pitch higher than 2”, the values were lower as PROT 2 about 10.4% (Reynaldo, 2013).Thus, the author verified that the size of the thread pitch of the helical thread can influence the distribution of fertilizers.
Suguisawa (2004) also found a similar result, in a study in which the operational quality of the fertilizer distribution was evaluated, so in the control charts both individual values and Moving Range showed points out of control, causing inconstancy in the process, with unevenness in the application of urea, influencing the quality and quantity of wheat grains produced, so that the applied dosage of fertilizer is directly related to the desired productivity.
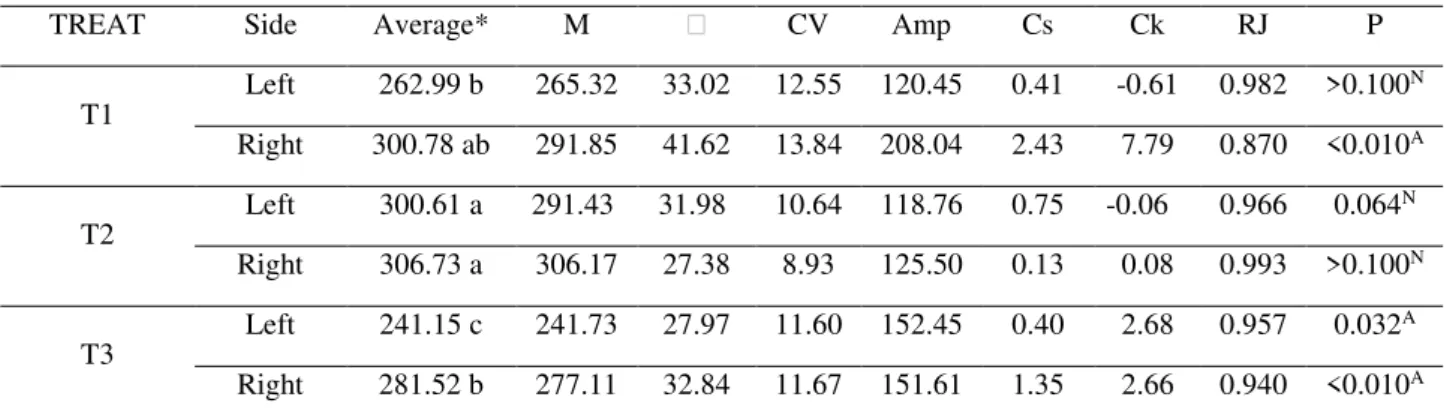
Descriptive statistics on the MAP distribution
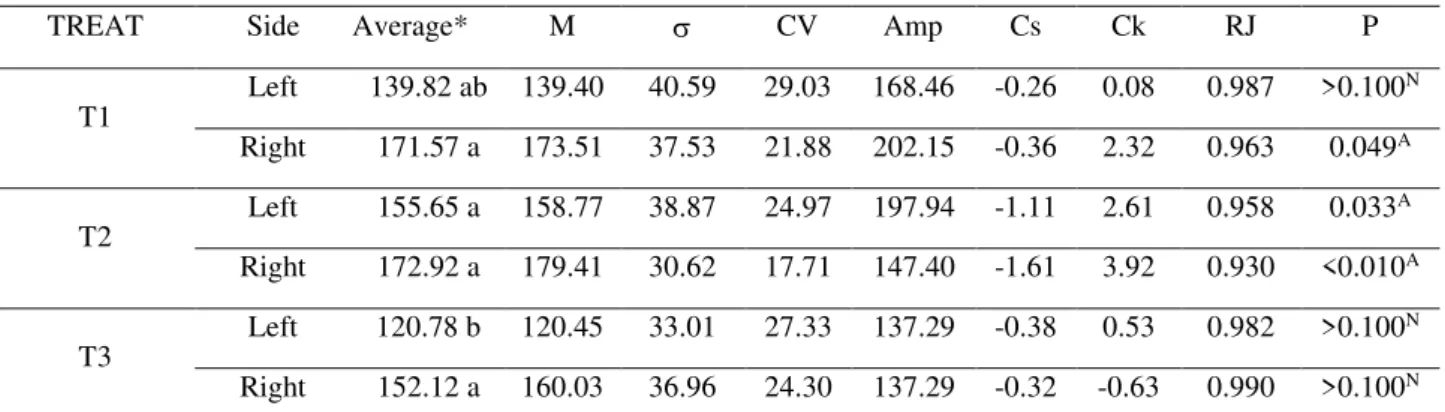
In the descriptive analysis of the MAP distribution with two operations, the lowest average was obtained, however the highest average was in the combined operation, so that the treatment with only fertilization expressed an average relatively close to the recommended dosage, and the median values were close the average. In relation to the standard deviation of the treatment with only fertilization showed a greater dispersion, with a greater deviation, but the combined operation had the smaller deviation, obtaining more concentrated data, so the CV of the operation with only fertilization (29.03%) was higher than the other treatments, due to the variability of the data (Table 3).
TABLE 3.Descriptive analysis of the MAP distribution in terms of operations.
TREAT Side Average* M CV Amp Cs Ck RJ P
T1 Left 139.82 ab 139.40 40.59 29.03 168.46 -0.26 0.08 0.987 >0.100
N
Right 171.57 a 173.51 37.53 21.88 202.15 -0.36 2.32 0.963 0.049A
T2 Left 155.65 a 158.77 38.87 24.97 197.94 -1.11 2.61 0.958 0.033
A
Right 172.92 a 179.41 30.62 17.71 147.40 -1.61 3.92 0.930 <0.010A
T3 Left 120.78 b 120.45 33.01 27.33 137.29 -0.38 0.53 0.982 >0.100
N
Right 152.12 a 160.03 36.96 24.30 137.29 -0.32 -0.63 0.990 >0.100N
TREAT: Treatment; M: median; σ: standard deviation; CV: coefficient of variation; Amp: amplitude; Cs: coefficient of asymmetry;
Ck: coefficient of kurtosis; RJ: Ryan-Joiner Normality Test; P: probability value using the Ryan-Joiner test; A: asymmetry
distribution with p<0.05. * Averages followed by the same letter do not have statistical difference, at the 5% probability level, by the Tukey test.
The asymmetric coefficients (Cs) for the three treatments expressed a negative asymmetric distribution (Ck<0) with a moderate asymmetry intensity (0.15<|Cs|<1) and high (|Cs|>1). For the kurtosis coefficient (Ck), these treatments obtained leptokurtic distributions (Ck>0), with more concentrated data, however, the treatment of two operations showed a platykurtic distribution (Ck <0) (Table 3).
Chioderoli et al. (2012) found a different result for the variable number of pods in soybean, that the asymmetry coefficient showed positive asymmetric distribution (Cs>0) and a high degree of asymmetry (|Cs|>1). Also, they reported for the coefficient of leptokurtic distribution (Ck>0) with an elongated curve, as a consequence, the normality test was asymmetric.
According to the results obtained by Chioderoli et al. (Ck<0) verified by the normality test, normal distribution only in the fuel consumption and engine power variables, showing leptokurtic distribution (Ck>0) in the kurtosis coefficient, but the asymmetry coefficient was negative asymmetric (Cs<0), varying from moderate to high the degree of asymmetry.
Souza (2005) also obtained results similar to the study, when analyzing the distance of the seed deposition between the fertilizer during corn sowing, showing data with tendency to non-normality and leptokurtic distribution due to the values being close to the average, in which it was verified that this indicator was not regular in the operation.
Thus, the normality test by Ryan-Joiner, at the 5% level, verified normality between the treatments of mechanized fertilization on the left side and two operations, observing that the coefficients of asymmetry and kurtosis had values close to zero, in contrast to the combined operation and the right side of the treatment with only fertilization obtained an abnormality, verifying that the values of these coefficients were far from zero (Table 3). In addition to this information, other relevant measures to obtain normal distribution as the average equal to 0 and constant variability of the data.
Reis et al. (2015) monitoring the damage caused in the sugarcane ratoon after the mechanized harvest, also obtained the same result by the normality test with normal and asymmetric distributions.
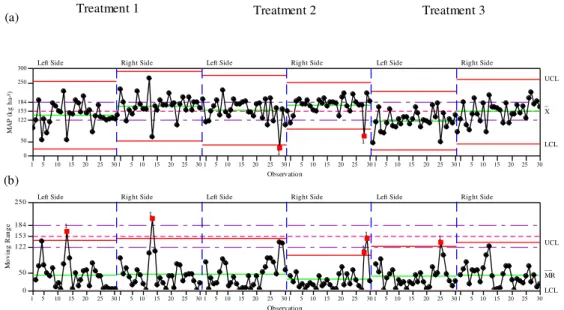
For the control chart, analyzing the MAP distribution both the individual values (Figure 3a) and the Moving Range (Figure 3b), in the treatment with two operations, showed less variability with only natural processes acting as inherent in the process, and the process was stable because all the points were within the limits of control, while the operation with only fertilization showed greater variability without any point out of control.
The out of control points verified in the combined operation were occasioned, for some special cause, possibly due to the deficiency in the precision of the dosing mechanism, inadequate regulation in the distribution of fertilizer; embedding altering the distribution and load, among other possible factors.
30 25 20 15 10 5 1 30 25 20 15 10 5 1 30 25 20 15 10 5 1 30 25 20 15 10 5 1 30 25 20 15 10 5 1 30 25 20 15 10 5 1 300 250 184 153 122 50 0 Observation M A P (k g h a-¹) _ X UCL LCL
Left Side Right Side Left Side Right Side Left Side Right Side
30 25 20 15 10 5 1 30 25 20 15 10 5 1 30 25 20 15 10 5 1 30 25 20 15 10 5 1 30 25 20 15 10 5 1 30 25 20 15 10 5 1 250 184 153 122 50 0 Observation M ov in g R an ge __ MR UCL LCL
Left Side Right Side Left Side Right Side Left Side Right Side
1 1 1 1 1 1 1
MAP Distribution by the fertilizer
Treatment 1 Treatment 2 Treatment 3
(a)
(b)
FIGURE 3. Control chart of individual values (a) and Moving Range (b) of distribution of MAP in terms of operations.
UCL: Upper Control Limit; X : arithmetic average of the individual values; USL: Upper Specific Limit; LSL: Lower
Specific Limit; LCL: Lower Control Limit; M R : Average individual Moving Range.
T1 - fertilizer distribution only; T2 - simultaneous operation of fertilizer distribution and herbicide application; and T3 - two simple operations, distribution of fertilizer followed by herbicide application.
The points outside the specific control limits (SCL) of the charts of the individual values of the fertilization treatments, combined operation and two operations for the right and left sides, were respectively, 9, 10, 11, 12, 14 and 12 (Figure 3a). In the Moving Range (Figure 3b) the fertilization treatments, combined operation and two operations on the left and right sides showed, respectively, 2, 0, 2, 1, 1 and 1 within the SCL (Specific Control Limit), the others were below, probably one of the possible causes of occurrence was the error in regulation.
The MAP control charts of individual values, treatments with only fertilization and two operations obtained stable processes (Figure 3a), without special causes, only from natural causes, but in the Moving Range these treatments had points out of control (Figure 3b). Thus, it showed a satisfactory result in the analysis of the other fertilizers that have points out of control, but the potassium chloride obtained a lower variability, consequently a higher quality of the operation, despite some points out of control, and it demonstrated a greater angle of rest in relation to the analyzed fertilizers.
Milan & Fernandes (2002) also applied the statistical process control in soil preparation operations and verified lower data variability by controlling process charts and histograms, being close to the Specific Control Limits. These authors emphasized how significant and relevant was the use of statistical process control in soil preparation, facilitating the monitoring of operational quality.
Descriptive Statistics of Potassium Chloride Distribution
TABLE 4. Descriptive analysis of the distribution of potassium chloride according to operations.
TREAT Side Average* M CV Amp Cs Ck RJ P
T1 Left 262.99 b 265.32 33.02 12.55 120.45 0.41 -0.61 0.982 >0.100
N
Right 300.78 ab 291.85 41.62 13.84 208.04 2.43 7.79 0.870 <0.010A
T2 Left 300.61 a 291.43 31.98 10.64 118.76 0.75 -0.06 0.966 0.064
N
Right 306.73 a 306.17 27.38 8.93 125.50 0.13 0.08 0.993 >0.100N
T3 Left 241.15 c 241.73 27.97 11.60 152.45 0.40 2.68 0.957 0.032
A
Right 281.52 b 277.11 32.84 11.67 151.61 1.35 2.66 0.940 <0.010A
TREAT: Treatment; M: median; σ: standard deviation; CV: coefficient of variation; Amp: amplitude; Cs: coefficient of asymmetry;
Ck: coefficient of kurtosis; RJ: Ryan-Joiner Normality Test; P: probability value using the Ryan-Joiner test; A: asymmetry
distribution with p<0.05. *Averages followed by the same letter do not have statistical difference, at the 5% probability level, by the Tukey test.
T1 - fertilizer distribution only; T2 - simultaneous operation of fertilizer distribution and herbicide application; and T3 - two simple operations, distribution of fertilizer followed by herbicide application.
The coefficients of asymmetry (Cs) for the three treatments showed a positive asymmetric distribution (Cs>0), with a moderate degree of asymmetry (0.15<|Cs|<1), small (0.15<|Cs|) and high (|Cs>1).The coefficient of kurtosis (Ck) in the treatments of combined operations and only fertilization on the left side showed a platykurtic distribution (Ck<0) with scattered data, obtaining a flat curve, despite the other treatments obtained leptokurtic distribution (Ck>0) with more clustered data, forming an elongated curve.
According to the normality test, through Ryan-Joiner, at 5% level, the combined operations and the left side of the mechanized fertilization had normality, while two operations and the right side of the mechanized fertilization treatment operation expressed asymmetric distribution. Thus, in the treatments of combined operations and left side of the mechanized fertilization, the coefficients of asymmetry and kurtosis were close to 0, showing normal distribution, however with two operations and the right side of the fertilization operation showed higher values, rebounding with an asymmetric distribution, obtaining more dispersed values.
Silva et al. (2013), also found that some of the analyzed variables had normal distribution by the normality test, so the same showed in the descriptive analysis median values close to the average; the standard deviation with low value; the Cs had a positive asymmetric distribution (Cs>0) and small (|Cs|<0.15), the Ck showed leptokurtic distribution (Ck>0), that is, more concentrated and platykurtic data (Ck<0) with concentrated values. These authors also cited the variables with positive asymmetric distribution (Cs>0) and high (|Cs|>1), as a consequence, the average value was far from the median and the total amplitude with high variability.
Zerbato et al. (2014) determined in in the evaluation of peanut crop losses, for the variables fuel consumption, time and actual consumption through the normal distribution test with Anderson-Darling, but the other parameters had asymmetric distribution, being displacement speed and effective field capacity.
Cassia et al. (2013), analyzing the operational quality of coffee harvest and crop damage, also obtained a normal and non-normal distribution by the normality test.
Suguisawa et al. (2007) also obtained a positive asymmetry distribution for the density parameter of droplets through the application of herbicide and the values did not show tendency to normality.
however the treatment with fertilizer distribution operation had greater variability and lower quality due to variability. In addition, the cause and effect diagram can explain points out of control.
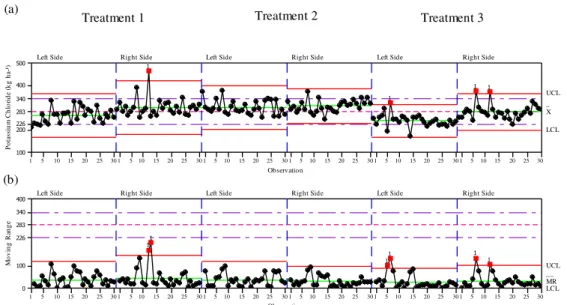
In relation to the specific control limits of individual values (Figure 4a), mechanized fertilization, combined operation and two operations corresponded to the left and right sides, respectively, 3, 3, 2, 4, 8 and 3 data that were left out of the specific limits. As for the Moving Range (Figure 4b), no point was within the stipulated range, there probably could have been an error in the regulation.
The potassium chloride showed greater uniformity and lower variability in the control charts, demonstrating higher operational quality than protected urea and MAP.
30 25 20 15 10 5 1 30 25 20 15 10 5 1 30 25 20 15 10 5 1 30 25 20 15 10 5 1 30 25 20 15 10 5 1 30 25 20 15 10 5 1 500 400 340 283 226 200 100 Observation Po ta ss iu m C h lo ri de (k g ha -¹) _ X UCL LCL
Left Side Right Side Left Side Right Side Left Side Right Side
30 25 20 15 10 5 1 30 25 20 15 10 5 1 30 25 20 15 10 5 1 30 25 20 15 10 5 1 30 25 20 15 10 5 1 30 25 20 15 10 5 1 400 340 283 226 100 0 Observation M o vi ng R an ge __ MR UCL LCL
Left Side Right Side Left Side Right Side Left Side Right Side
1 1 1 1 1 1 1 1 1 1
Potassium Chloride Distribution by the fertilizer
Treatment 1 Treatment 2 Treatment 3
(a)
(b)
FIGURE 4. Control chart of individual values (a) and Moving Range (b) of distribution of potassium chloride in terms of operations. UCL: Upper Control Limit; X : arithmetic
average of the individual values; USL: Upper Specific Limit; LSL: Lower Specific Limit; LCL: Lower Control Limit; M R : Average individual Moving Range.
T1 - fertilizer distribution only; T2 - simultaneous operation of fertilizer distribution and herbicide application; and T3 - two simple operations, distribution of fertilizer followed by herbicide application.
Points out of control (UCL and LCL) in process charts were likewise found by Silva et al. (2008), in the mechanized harvesting of sugarcane, evaluating the losses of the same, where it was verified the instability of the process, reducing the operational quality.
Silva et al. (2014) analyzed the operational quality in the mechanized transplanting of coffee seedlings and observed that the error parameters of alignment, speed and skating, contained in the same operation of the transplanting of seedlings and reduced soil preparation, expressed asymmetric distribution by the normality test of Anderson-Darling.
CONCLUSIONS
The distribution of fertilizers with two different operations showed the best operating quality with lower variability.
The protected urea showed greater variability and lower operational quality. However, the potassium chloride expressed higher operational quality because it showed less variability than the other fertilizers.
REFERENCES
Albiero D, Maciel AJ da S, Milan M, Monteiro L de A, Mion RL (2012) Avaliação da distribuição de sementes por uma semeadora de anel interno rotativo utilizando média móvel exponencial. Revista Ciência Agronômica 43(1):86-95.
Baio FHR, Molin JP, Leal AJF (2012) Avaliação comparativa da distribuição transversal de adubos sólidos aplicados em culturas anuais. Bioscience Journal 28(4):527-536.
Bonotto GJ (2012) Desempenho de dosadores de fertilizantes de semeadoras-adubadoras em linhas. 2012. 99f. Dissertação Mestrado, Santa Maria, Universidade Federal de Santa Maria.
Cassia MT, Silva RPda, Chioderolli CA, Noronha RHF, Santos EPdos (2013) Quality of mechanized coffee harvesting in circular planting system. Ciência Rural 43(1):28-34.
Chioderoli CA, Silva RPda, Noronha RHdeF, Cassia MT, Santos EPdos (2012) Perdas de grãos e distribuição de palha na colheita mecanizada de soja. Bragantia 71(1):112-121.
Embrapa - Empresa Brasileira de Pesquisa Agropecuária (2013) Sistema brasileiro de classificação de solos. Embrapa, 3 ed. 353p.
Ferreira MFP, Dias VdeO, Oliveira A, Alonço AdosS, Baumhardt UB (2010) Uniformidade de vazão de fertilizantes por dosadores helicoidais em função do nivelamento longitudinal. Engenharia na agricultura 18(4):297-304.
Gomes FP, Garcia CH (2002) Estatística aplicada a experimentos agronômicos e florestais: exposição com exemplos e orientações para uso de aplicativos. FEALQ, 309p.
Milan M, Gadanha Júnior CD (1996) Ensaios & certificação das máquinas para aplicação de adubos e corretivos. In: Mialhe LG. Máquinas agrícolas: ensaios & certificação de estudos agrários.
Piracicaba, Fundação de Estudos Agrários Luiz de Queiroz, cap10, p515-550.
Milan M, Fernandes RT (2002) Qualidade das operações de preparo de solo por controle estatístico de processo. Scientia Agrícola 59(2):261-266.
Molin JP, Machado TM, Magalhães RP, Faulin GDC (2009) Segregação de fertilizantes aplicados a lanço. Engenharia Agrícola 29(4):614-622.
Molin JP, Frasson FR, Amaral LR, Povh FP, Salvi JV (2010) Capacidade de um sensor ótico em quantificar a resposta da cana-de-açúcar a doses de nitrogênio. Revista Brasileira de Engenharia Agrícola e Ambiental 14(12):1345-1349.
Montgomery DC (2009) Introduction to Statistical Quality Control. 6 ed. Arizona State University, John Wiley & Sons. 754 p.
Motomiya AVdeA, Molin JP, Chiavegato EJ (2009) Utilização de sensor óptico ativo para detectar deficiência foliar de nitrogênio em algodoeiro. Revista Brasileira de Engenharia Agrícola e
Ambiental 13(2):137-145.
Motomiya AVdeA, Valente IMQ, Molin JP, Motomiya WR, Biscaro GA, Jordan RA (2014) Índice de vegetação no algodoeiro sob diferentes doses de nitrogênio e regulador de crescimento. Semina: Ciências Agrárias 35(1):169-178.
6(2):143-Reynaldo ÉF (2013) Avaliação de mecanismos dosadores de fertilizantes sólidos tipo helicoidais em diferentes níveis de nivelamento longitudinal e transversal. Tese Doutorado, Universidade Estadual Paulista, Faculdade de Ciências Agronômicas.
Silva RP, Corrêa CF, Cortez JW, Furlani CEA (2008) Controle estatístico aplicado ao processo de colheita mecanizada de cana-de-açúcar. Engenharia Agrícola 28(2):292-304.
Silva RP, Cassia MT, Voltarelli MA, Compagnon AM, Furlani CEA (2013) Qualidade da colheita mecanizada de feijão (Phaseolus vulgaris) em dois sistemas de preparo do solo. Revista Ciência Agronômica 44(1):61-69.
Silva RPda, Voltarelli MA, Cassia MT, Vidal DO, Cavichioli FA (2014) Qualidade das operações de preparo reduzido do solo e transplantio mecanizado de mudas de café. Coffee Science 9(1):51-60.
Silveira GM (1989) As máquinas para plantar: aplicadores, distribuidoras, semeadoras, plantadoras e cultivadoras. 1 ed. Globo.
Souza ABMde (2005) Sistema de informações aplicado ao processo mecanizado de semeadura direta. Dissertação Mestrado, Universidade de São Paulo, Escola Superior de Agricultura "Luiz de Queiroz".
Suguisawa JM (2004) Diagnóstico da condição tecnológica, sob a ótica da qualidade das operações mecanizadas da cultura do trigo em sistema plantio direto. Dissertação Mestrado, Universidade de São Paulo, Escola Superior de Agricultura "Luiz de Queiroz".
Suguisawa JM, Franco FN, Silva SSS, Peche Filho A (2007) Qualidade de aplicação de herbicidas em lavoura de trigo. Engenharia Agrícola 27(spec):41-47.
Torquato SA (2013) Mecanização da colheita da cana-de-açúcar: benefícios ambientais e impactos na mudança do emprego no campo em São Paulo, Brasil. Revista Brasileira de Ciências Ambientais 29:49-62.