Thermal characterization of hydrated eco-friendly clinkers produced
from pulp and paper mill waste
(Caracterização térmica de ecoclínqueres hidratados produzidos a partir de
resíduos da indústria de papel e celulose)
L. Simão1*, N. J. Lóh1, D. Hotza2, F. Raupp-Pereira1,3, J. A. Labrincha4, O. R. K. Montedo1 1University of Southernmost Santa Catarina, Graduate Program in Materials Science and Engineering,
VALORA Research Group, Av. Universitária 1105, 88806-000, P.O. Box 3167, Criciúma, SC, Brazil
2Federal University of Santa Catarina, Department of Chemical Engineering, Florianópolis, SC, Brazil 3Federal University of Santa Catarina, Department of Mechanical Engineering, Florianópolis, SC, Brazil
4University of Aveiro, Department of Ceramic and Materials Engineering, Aveiro, Portugal
Abstract
Industrial wastes from pulp and paper mills are potentially useful materials to use as alternative materials in clinker production. In this study, eco-friendly clinkers were obtained using only waste as feedstock. Eco-friendly clinker with different C3S and C2S contents were produced and hydrated for 7 days at 40 °C, or for 28 and 90 days at room temperature. The potentialities of these waste and the products obtained were revealed through chemical (XRF), thermal (DTA/TG) and surface area (BET) analysis. For comparison, a common ordinary Portland cement (OPC) was tested. As expected, the hydration rate of formulations presenting higher C3S content was higher, generating higher amounts of Ca(OH)2. Furthermore, the amount of Portlandite formed was lower
when compared to OPC.
Keywords: pulp and paper mill waste, clinker, hydration, portlandite.
Resumo
Os resíduos do setor de papel e celulose são potenciais para serem usados como materiais alternativos na produção de clínqueres. Neste estudo, ecoclínqueres foram obtidos utilizando apenas resíduos como matéria-prima. Ecoclínqueres com diferentes teores de C3S e C2S foram produzidos e hidratados por 7 dias a 40 °C, ou por 28 e 90 dias em temperatura ambiente. As potencialidades
destes resíduos e dos produtos obtidos foram reveladas através de análise química (FRX), térmica (ATD/TG) e de área superficial
(BET). Para comparação, um cimento Portland comercial (OPC) foi testado. Como esperado, a taxa de hidratação das formulações apresentando maior teor de C3S foi maior, gerando maiores quantidades de Ca(OH)2. Além disso, a quantidade de portlandita formada foi menor quando comparada ao OPC.
Palavras-chave: resíduos da indústria de papel e celulose, clínquer, hidratação, portlandita.
INTRODUCTION
Industrial wastes from pulp and paper mills are potential replacements for raw materials (e.g. limestone and clay) used in clinker production [1, 2]. This is mainly due to the high
concentration of major oxides (CaO [3-6], SiO2 [7-10], and
Al2O3 [1, 2]) present in such wastes, which are required for the formation of desirable crystalline phases in the clinker (C3S, C2S, C3A and C4AF) [11]. Works [12] demonstrated that this method of waste recovery is technically and environmentally feasible, and reported that high alkali content (Na2O + K2O) is a major issue in the end product. Those alkalis found in the waste, and consequently in the clinkers produced from the waste, arise from chemicals used in the digestion and separation of cellulose and lignin [13].
Those alkalis may cause some problems in the durability of
the final concrete. Literature reports indicate that high alkali
content is harmful to concrete, causing alkali-aggregate reactions that result in delayed expansion and rupture of the material with time [14]. According to regulatory standards, the acceptable alkali content in concrete is less than 0.6% [15], while it is typically between 2 and 3% in cement produced with waste from pulp and paper mills [16].
High proportions of alkalis may also negatively influence
the ultimate strength of cementitious materials, even in the absence of alkali-aggregate reactions [16]. Depending on how alkalis are present in cementitious binders, hydration and properties of the cement may be affected. In typical cements, alkalis may be incorporated into the clinker phases or in the form of sulfates [16]. Some works [17] showed that alkalis in the form of sulfates do not alter the hydration of
cement, but significantly reduce its tensile strength. In similar
works [18], the increase of the amount of alkaline oxides in hardened cement pastes (from 0.15 to 2.8 wt%) reduced the compressive strength by ~56%. Smaoui et al. [16] reported cases of loss of strength at any curing age, whereas Jawed and Skalny [19] reported that this attenuation occurs only at ages later than 28 days, having no effect during early curing.
The proportion of the crystalline phases C3S (alite) and C2S (belite) is another factor that directly influences the hydration of cement. Alite hydrates much faster than belite. After 28 days of hydration, 70 wt% of C3S reacted (hydrated), while only 30 wt% of C2S completed hydration [20]. The main hydration compounds of typical cements are
calcium silicate hydrate (C-S-H) and portlandite [Ca(OH)2],
being the last expectably more abundant when C3S/C2S ratio is higher. When subjected to thermal characterization by differential thermal analysis and thermogravimetry (DTA/TG), those hydrated compounds suffer dehydration between 120 and 400 °C (C-S-H), and between 400 and 520
°C [Ca(OH)2] [11]. The subsequent mass loss of Ca(OH)2
dissociation might be used to quantify its amount [21]. In the present work, hydrated samples of eco-friendly clinker were analyzed thermally to quantify the amount of portlandite present.
EXPERIMENTAL
Materials: the materials used in the present work were ashes from biomass combustion, wastewater treatment plant (WWTP) sludge, and lime mud from pulp and paper mills
from Brazilian plants. Ordinary Portland cement (purchased
in the Brazilian market) was used as a hydraulic binder reference (HBR).
Characterization: particle size distribution was
determined by laser diffraction (Cilas 1064) for lime mud and WWTP sludge, and by sieving (5-0.03 mm) for biomass ashes. The chemical analysis was performed
by X-ray fluorescence spectrometry (XRF, WDXRF
AxiosmAX, PANalytical), while thermal analyses (DTA/
TG, differential thermal analysis/thermogravimetry) were performed in a simultaneous thermal analyzer (SDT Q600, TA Instruments). The heating was conducted in synthetic air atmosphere at temperatures up to 1400 °C, at a heating rate of 10 °C.min-1, and with samples of 15 mg mass in an
alumina crucible. The hydrated eco-friendly clinkers were analyzed in nitrogen to ensure an inert and dry atmosphere, and at a heating rate of 5 °C.min-1 up to 600 °C. Eq. A was
used to estimate the portlandite (CH) content in hydrated eco-friendly clinkers from the mass loss (MLCH) associated with its dihydroxylation [21]:
CH(%) = MLCH(%) x MMCH
MMH 0 (A)
wherein MMCH and are the molar masses of
portlandite and water, respectively. Specific surface area
(BET Quantachrome Nova 1200e) measurements were conducted using nitrogen gas as adsorbate, for both eco-friendly clinkers and HBR. The mineralogical compositions
were analyzed by X-ray powder diffraction (XRD, Shimadzu XRD-6000; CuKα radiation, 0.02° 2θ step-scan and 10 s.step-1) and phase quantification was performed by Rietveld
refinement using GSAS (general structure analysis system) with EXPGUI software. The internal standard was refined
as a crystalline phase and used to determine the amorphous fraction of samples. The evaluation of the quality of
refinement was based on least squares (χ2) and the graph. Preparation and hydration of eco-friendly clinkers: the formulations (Table I) of eco-friendly clinkers were prepared based on the lime saturation factor (LSF) and Bogue equations [10]. Compositional adjustments using the Bogue equations were performed in order to control the crystalline phases after thermal processing. In this sense, F1 and F5 had a greater tendency to form belite and alite phases, respectively
[2]. The formulations were fired in a bottom loading furnace
(ME 1700/V/Eg, Fortelab) in two steps (decarbonation and
clinkering). In the first step,decarbonation was held at1000 °C with5 °C.min-1 heating rate, and 120 min holding time.
Forclinkering, three different maximum temperatures were used: 1350, 1400 and 1455 °C,fixing the heating rate at 10 °C.min-1, and the holding time at 90 min.These temperatures
were chosenfrom the ternary diagram of CaO-SiO2-Al2O3 and of a similar procedure related in the literature [12, 22].
At the end of the firing cycle, the samples were rapidly (>50 °C.min-1) cooled down to room temperature. After
processing, the clinkers were ground and sieved (<45 μm) and 1 g mass was mixed with distilled water (w/c= 0.48) to form cementitious pastes. The cement pastes were placed to
a plastic film and, after 24 h in air, bodies were immersed in
water. Some samples were hydrated for 7 days in a climate chamber at 40 °C, while another set of samples were cured for 28 and 90 days in room conditions (25 °C).
RESULTS AND DISCUSSION
Characterization of wastes and clinkers: the results
obtained by XRF confirmed that the wastes considered in this work contained high levels of CaO, Al2O3 and SiO2, and
are potential substitutes for traditional raw materials used in clinker production [1]. The generation of these wastes would not provide a clinker production only with these materials, but their use could complement the raw commercial materials. However, considerable alkali contents were found in all three wastes, highlighting the high K2O content
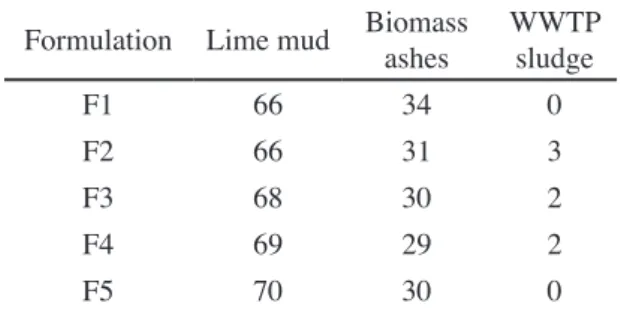
Table I - Investigated formulations (wt%).
[Tabela I - Formulações investigadas (m%).]
Formulation Lime mud Biomass ashes
WWTP sludge
F1 66 34 0
F2 66 31 3
F3 68 30 2
F4 69 29 2
in biomass ashes (3.14 wt%) and Na2O in lime mud (1.06 wt%), as listed in Table II. Mineralogical composition of the waste (Fig. 1) showed that WWTP sludge did not present intense crystal peaks. Lime mud and biomass ashes, in turn, showed crystal peaks of calcite and quartz, respectively. Particle size distributions [1] showed d50 of 14.6, 20.7 and 80.0 µm for lime mud, WWTP sludge and biomass ashes, respectively. These values can be considered suitable for obtaining clinker.
All three wastes showed extensive mass losses (Fig. 2), either by burning of organic matter (in WWTP sludge -74%; and biomass ashes - 34%) or by decarbonation of compounds (in lime mud - 41%). The DTA and TG curves of lime sludge (Fig. 2a) clearly showed the endothermic peak at 745.9 °C corresponding to decarbonation of calcium carbonate. Thermography (DTA) of the ash sample
(presented in detail in Fig. 2c) shows an exothermic peak at 499.2 °C, whereas the data for WWTP sludge shows peaks at 342.6 and 444.0 °C (Fig. 2b). These two exothermic peaks Table II - Chemical composition (wt%) of the wastes.
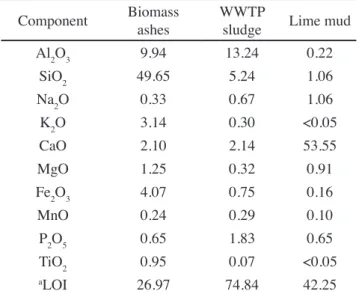
[Tabela II - Composição química (m%) dos resíduos.]
Component Biomass ashes
WWTP
sludge Lime mud Al2O3 9.94 13.24 0.22
SiO2 49.65 5.24 1.06
Na2O 0.33 0.67 1.06 K2O 3.14 0.30 <0.05
CaO 2.10 2.14 53.55
MgO 1.25 0.32 0.91
Fe2O3 4.07 0.75 0.16
MnO 0.24 0.29 0.10
P2O5 0.65 1.83 0.65
TiO2 0.95 0.07 <0.05 aLOI 26.97 74.84 42.25
aLOI - loss on ignition at 1000 °C.
Figure 1: XRD patterns of biomass ashes, lime mud and WWTP sludge.
[Figura 1: Difratogramas de raios X das cinzas de biomassa, lama de cal e lama de ETE.]
Ca = Calcite (5-0586 - CaCO3) Q = Quartz (46-1045 - SiO2)
Biomass ashes
Lime mud
WWTP sludge
15
2q (degree)
25 35 45 55 65 75
20 30 40 50 60 70 80
Figure 2: Thermograms (DTA/TG) of: (a) lime mud; (b) WWTP sludge; and (c) biomass ashes.
[Figura 2: Termogramas (ATD/TG) de: (a) lama de cal; (b) lama de ETE; e (c) cinzas de biomassa.]
0
DTA Lime mud DTA WWTP sludge DTA Biomass ashes -30
30
-30 -50
-10 500
100 700
700 300
300
900
500
500 a)
b)
c) -10
70
70
30
20 20
40
40 10
0
0 50
80
TG Lime mud TG WWTP sludge TG Biomass ashes T (ºC)
TG (%)
DT
A
(µV)
100
-20
-60 -40 80 60 40 20 0
0 10
30
50
70
90 20
40
60
80
100 200 400 600 800 1000 1200 1400
Table III - Estimated chemical compositions (wt%) of the formulations.
[Tabela III - Composição química estimada (m%) das formulações.]
Component F1 F2 F3 F4 F5 aHBR
Al2O3 4.88 6.02 5.38 5.24 4.35 3.46
SiO2 24.33 22.91 22.06 21.40 21.69 19.65
Na2O 1.36 1.43 1.43 1.45 1.42 0.13 K2O 1.52 1.43 1.37 1.33 1.35 0.84
CaO 62.11 62.28 64.02 64.92 65.70 66.30
MgO 1.62 1.61 1.61 1.61 1.62 4.74
Fe2O3 2.08 2.00 1.92 1.87 1.87 3.65
MnO 0.23 0.25 0.24 0.24 0.22 0.10
P2O5 1.04 1.23 1.17 1.18 1.05 0.12
TiO2 0.50 0.47 0.45 0.44 0.45 0.31
Na2O+K2O 2.88 2.85 2.81 2.78 2.77 0.97
bNa
2O eq 2.36 2.37 2.34 2.32 2.31
-a - Real composition obtained by XRF; bNa
in the WWTP sludge may distinguish primary sludge from secondary sludge in the sample. The primary sludge has a high C:N ratio (150-250), while the secondary sludge has a low C:N ratio (5-30) [23]. These proportions suggested that the primary sludge had more complex molecules than the secondary sludge and that the two materials may, therefore, have different degradation temperatures. In this regard, it may be concluded that the higher temperature peak (444.0 °C) is due to the primary sludge, while the lower temperature peak (342.6 °C) corresponds to the burning of the secondary sludge. The energy released in these reactions is extremely interesting when clinker formulations are considered, since it may be used to reduce fuel consumption during clinkering.
Estimated chemical compositions of the formulations
(Table III) indicate a higher CaO content in F5 than in F1,
mainly due to the more use of lime mud in F5. In general, the
large amount of CaO in F5 resulted in a high C3S content in
Formulation 1350 °C 1400 °C 1455 °C F1 1352 2499 2341 F2 1578 1575 2033
F3 2332 - 2391
F4 1668 1911 1196 F5 936 1964 1926
HBR 1107
Table IV - Crystalline phases (wt%) determined by Rietveld method.
[Tabela IV - Fases cristalinas (m%) determinadas pelo
método de Rietveld.]
Sample C3S C2S C3A C4AF χ2
HBR - 59 26 4 11 4.264
F1
1350 10 69 9 11 4.746 1400 31 49 3 17 4.692 1455 4 63 7 26 4.708
F2
1350 10 71 4 15 3.840 1400 22 46 16 16 6.529 1455 19 44 20 17 7.791
F3
1350 12 59 14 15 5.935 1400 49 31 6 14 7.102 1455 34 33 13 20 6.489
F4
1350 29 44 13 14 6.052 1400 39 37 8 16 5.772 1455 46 32 11 11 4.704
F5
1350 23 52 13 12 6.538 1400 36 35 6 23 5.502 1455 49 22 8 21 5.164
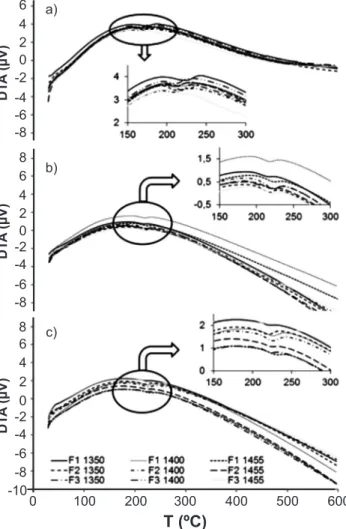
Figure 3: Thermograms (DTA) of formulations F1, F2 and F3 at: (a) 7, (b) 28 and (c) 90 days.
[Figura 3: Termogramas (ATD) das formulações F1, F2 e F3 em: (a) 7, (b) 28 e (c) 90 dias.]
DT
A
(µV)
DT
A
(µV)
DT
A
(µV)
6
6 8
8 6
4
4 4
2
2 2
0
0 0
-2
-2 -2
-8
-8 -10 0
T (ºC)
100 200 300 400 500 600
-8
-6
-6 -6
-4
-4 -4
a)
b)
c)
Formulation 7 days 28 days 90 days
F1
1350 °C 224.34 214.08 220.20
1400 °C 219.57 218.11 225.38
1455 °C 211.61 222.68 227.98
F2
1350 °C 209.73 217.18 219.70
1400 °C 210.42 222.16 225.84
1455 °C 214.20 217.67 223.34
F3
1350 °C 217.58 222.85 222.24
1400 °C 212.67 -
-1455 °C 219.52 218.86 237.38
F4 1350 °C 216.21 216.98 220.82 1400 °C 212.10 - -Table VI - Dehydration temperatures (°C) of C-S-H
identified in the thermograms of formulations F1, F2, F3
and F4.
[Tabela VI - Temperaturas de desidratação (°C) do C-S-H identificadas nos termogramas das formulações F1, F2, F3 e F4.]
Table V - Specific surface area (m2.kg-1) of the materials,
after milling and sieving (<45 µm).
[Tabela V - Área de superfície especifica (m2.kg-1) dos
the resultant clinkers, when compared with high C2S content for F1 (Table IV), characterizing them as Portland and belite clinkers, respectively. The HBR sample showed an alkali (Na2O+K2O) content equal to 0.97 wt%. The eco-friendly clinker samples had alkali contents that were similar to each other (considering volatilization losses, Na2O + 0.658×K2O), but much higher than HBR, ranging from 2.31 wt% in F5 to 2.37 wt% in F2.
Both the eco-friendly clinkers and the HBR were passed through a 45 µm mesh and show specific surface areas
between 900 and 2500 m2.kg-1 (Table V). These results
demonstrate that the samples had much higher specific
surface areas than the required standards (240, 260, and 280 m2.kg-1 for cement classes 25, 32 and 40, respectively),
according to NBR 05732 [24]. When compared with HBR,
only F5 at 1350 °C had a lower specific surface area, but it
was still higher than the NBR 05732 recommendation.
Estimation of portlandite content formed upon hydration: DTA and TG analyses of the hydrated F1, F2 and F3 pastes
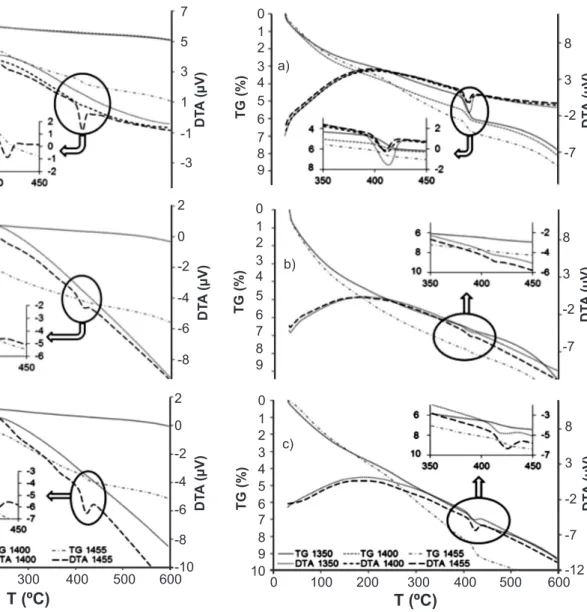
Figure 4: Thermograms (DTA/TG) of formulation F4 at: (a) 7, (b) 28 and (c) 90 days.
[Figura 4: Termogramas (ATD/TG) da formulação F4 em: (a) 7, (b) 28 e (c) 90 dias.]
Figure 5: Thermograms (DTA/TG) of formulation F5 at: (a) 7, (b) 28 and (c) 90 days.
[Figura 5: Termogramas (ATD/TG) da formulação F5 em: (a) 7, (b) 28 e (c) 90 dias.]
TG (%) DT A (µV) 2 6 10 14 18 4 8 12 16 7 0 5 3 -3 -1 1 a) DT A (µV) TG (%) 2 2 6 10 14 18 4 8 12 16 20 0 T (ºC)
100 200 300 400 500 600
0 0 -2 -8 -10 -6 -4 c) DT A (µV) TG (%) 2 2 6 10 14 18 4 8 12 16 0 0 -2 -8 -6 -4 b) TG (%) DT A (µV) 8 -7 0 4 2 6 8 1 5 3 7 9 -2 3 a) TG (%) DT A (µV) 8 -7 0 4 2 6 8 1 5 3 7 9 -2 3 b) T (ºC)
TG (%) DT
A
(µV)
0 100 200 300 400 500 600
8 0 4 2 6 8 1 5 3 7 9 10 -7 -12 -2 3 c)
at different ages and conditions showed the absence of
dehydrating peaks of portlandite. Only decomposition of
calcium silicate hydrates (C-S-H), between 120 and 400 °C, was evidenced by DTA (Fig. 3), as presented in Table
VI. The same behavior was observed for pastes of F4 fired
at 1350 and 1400 °C (Fig. 4). The absence of portlandite peaks in F1, F2 and F3 hydrated pastes may be explained by the relatively low amount of alite in such clinkers, as estimated by DRX (Rietveld method). In this sense, these
formulations would take a longer time to hydrate. On the
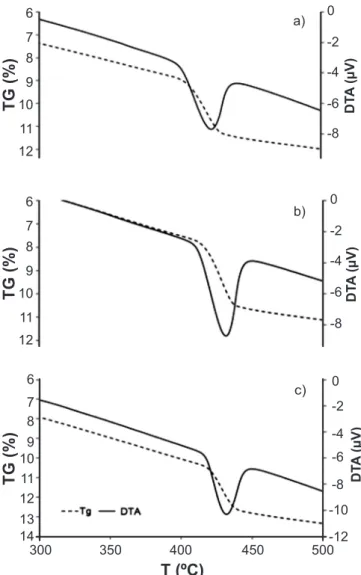
hydration process (Table VII, Figs. 4 and 5). As expected, curing at 40 °C accelerates the hardening reactions, and F4 and F5 pastes tend to develop higher portlandite amounts, even when compared with samples cured for 90 days in room conditions. Estimations for HBR pastes (Table VII and
Fig. 6) may be erroneous and difficult to interpret, probably
because differences are within the experimental error of determination in such relatively portlandite-rich samples.
CONCLUSIONS
The results of this study showed that the thermal characterization of hydrated cements might be a useful technique for the study of cementitious materials. The major components (Al2O3, SiO2 and CaO) required for clinkerization
were identified in lime mud waste, WWTP sludge, and
biomass ashes, which were used for the formation of clinker compounds (C3S and C2S). F1-F3 formulations had lower
CaO contents and, as a consequence, the respective clinkers
were belite-richer and had relatively small amounts of alite. Their hydration was slower and the formation of portlandite was incipient, being undetectable by DTA-TG. By contrast, F4 and F5 clinkers predictably showed alite as the main phase, as well as the reference material (HBR). Hydration reactions were faster, as proved by the stronger dehydration portlandite peaks. Major concerns regarding the eco-clinkers now processed are related to the higher amount of alkalis. Thus, this issue deserves a future characterization of the alkali phases formed and potential measures for mitigating their potentially harmful effects.
ACKNOWLEDGEMENTS
Authors are very grateful to National Council for
Scientific and Technological Development (CNPq/Brazil)
and Coordination for the Improvement of Higher Education
Formulation Day Wi (mg) Peak (°C) TG (mg) CH (mg) CH (wt%) HBR
7a
15.9670 421.49 0.4290 1.7637 11.05
F4 1455 19.7990 413.68 0.1511 0.6212 3.14
F5
1350 16.6930 412.59 0.2478 1.0187 6.10
1400 16.9530 410.95 0.1300 0.5344 3.15
1455 15.0000 409.53 0.1141 0.4691 3.13
HBR
28
16.6540 431.31 0.5072 2.0852 12.52
F4 1455 16.8490 415.30 0.1096 0.4506 2.67
F5 1350 17.2550 410.11 0.0652 0.2680 1.55
1455 17.7140 413.51 0.0510 0.2095 1.18
HBR
90
15.4430 431.75 0.3710 1.5252 9.88
F4 1455 18.7680 422.29 0.2011 0.8267 4.41
F5 1350 16.4310 418.15 0.1153 0.4740 2.88
1455 15.9870 424.32 0.1623 0.6672 4.17
Table VII - Quantification of portlandite (CH) from DTA-TG curves.
[Tabela VII - Quantificação de portlandita (CH) a partir de curvas de ATD-TG.]
Wi - initial weight; CH - calcium hydroxide (portlandite); a - in oven at 40 °C.
Figure 6: Thermograms (DTA/TG) of HBR at: (a) 7, (b) 28 and (c) 90 days.
[Figura 6: Termogramas (ATD/TG) de HBR em: (a) 7, (b) 28 e (c) 90 dias.]
6 0
-4
-8
-10
-12 -2
-6 8
10
TG (%)
T (ºC)
DT
A
(µV)
7
9
11 12 13 14
300 350 400 450 500
c)
6 0
-4
-8 -2
-6 8
10
TG (%) DTA
(µV)
7
9
11
12
b)
6 0
-4
-8 -2
-6 8
10
TG (%) DTA
(µV)
7
9
11
12
Personnel (CAPES/Brazil) for funding this study.
REFERENCES
[1] L. Simão, N. Lóh, D. Hotza, F. Raupp-Pereira, O.R.K.
Montedo, in Proc. VI Forum Int. Resíd. Sól. (2015) 1. [2] L. Simão, J. Jiusti, N.J. Lóh, D. Hotza, F. Raupp-Pereira,
J.A. Labrincha, O.R.K. Montedo, Process Saf. Environ. Prot. 109 (2017) 106.
[3] Y. Jia, C. Maurice, B. Öhlander, Environ. Earth Sci. 72
(2013) 319.
[4] J. Qin, C. Cui, X. Cui, A. Hussain, C. Yang, S. Yang, Ceram. Int. 41 (2015) 5648.
[5] R. Sun, Y. Li, C. Liu, X. Xie, C. Lu, Chem. Eng. J. 221
(2013) 124.
[6] Y. Liu, C. Yan, Z. Zhang, H. Wang, S. Zhou, W. Zhou, Fuel 185 (2016) 181.
[7] M. Berra, T. Mangialardi, A.E. Paolini, Constr. Build. Mater. 76 (2015) 286.
[8] T.C. Esteves, R. Rajamma, D. Soares, A.S. Silva, V.M. Ferreira, J.A. Labrincha, Constr. Build. Mater. 26 (2012) 687.
[9] T. Ramos, A.M. Matos, J. Sousa-Coutinho, Constr. Build. Mater. 49 (2013) 343.
[10] R. Siddique, Resour. Conserv. Recy. 67 (2012) 27. [11] P.K. Mehta, P.J.M. Monteiro, Concrete: microstructure, properties, and materials, 3rd Ed., McGraw-Hill (2005).
[12] L.H. Buruberri, M.P. Seabra, J.A. Labrincha, J. Hazard. Mater. 286 (2015) 252.
[13] F. Castro, C. Vilarinho, D. Trancoso, P. Ferreira, F. Nunes, A. Miragaia, Int. J. Mater. Eng. Innov. 1 (2009) 74. [14] P. Krivenko, R. Drochytka, A. Gelevera, E. Kavalerova, Cem. Concr. Compos. 45 (2014) 157.
[15] Am. Soc. Test. Mater., ASTM C 150-97 “Standard
specification for Portland cement” (1997).
[16] N. Smaoui, M.A. Bérubé, B. Fournier, B. Bissonnette, B. Durand, Cem. Concr. Res. 35 (2005) 203.
[17] I. Odler, R. Wonnemann, Cem. Concr. Res. 13 (1983) 771.
[18] S.J. Way, A. Shayan, Cem. Concr. Res. 19 (1989) 759. [19] I. Jawed, J. Skalny, Cem. Concr. Res. 8 (1978) 37. [20] H.F.W. Taylor, Cement chemistry, 2nd Ed., Thomas
Telford (1990).
[21] A.M.G. Tavares, “Síntese e caracterização de pastas de cimento aditivadas com resinas epóxi - análises cinéticas,
termodinâmicas e calorimétricas”, Tese Dr., Un. Fed.
Sergipe (2010).
[22] J.P. Baptista, R.F. Silva, Diagramas de fases, Aveiro (1998).
[23] V.C.M. Barretto, “Resíduos de indústria de celulose e papel na fertilidade do solo e no desenvolvimento de
eucalipto”, Tese Dr., UNESP (2008).
[24] Assoc. Bras. Nor. Técn., ABNT NBR 5732, “Cimento
Portland comum” (1991).