A Work Project, presented as part of the requirements for the Award of a Masters Degree in Economics from the Nova School of Business and Economics.
A green future for European electricity?
Energy sources, policies and further determinants of the household price of electricity
MICHAEL THEMANN, # 542
A project carried out under the supervision of:
Prof. Maria Antonieta Cunha e Sá
and
Prof. Paulo M. M. Rodrigues
1
Abstract
There is a controversial debate on how the transition towards electricity generation from
re-newable energy sources (RES-E) affects European electricity markets in terms of prices and
market efficiency. This thesis contributes to this debate by providing the first panel
economet-ric analysis of how both different sources of electeconomet-ricity generation and electeconomet-ricity market
poli-cies impact on the household price of electricity. Based on a sample of 29 European countries
(EU-27 and two more), it finds that electricity production from combustible sources, natural
gas, hydro and wind for the time span of 1991-2007 had a significant price lowering effect
(ceteris paribus, on average). In contrast to that, results for the time span of 2004-2007 suggest
that RES-E had a price increasing effect which can be related to its rapid growth in the 2000s.
Results also suggest that Feed-in-Tariffs, regulatory reforms and the European emission
trad-ing scheme play an important role, but their impact depends on country specific
characteris-tics. The latter seem to be an important factor in determining the level of prices.
I) Introduction
Energy policy in Europe and in the European Union (EU) in particular has been dominated in
recent years by the transition of the energy economy away from fossil and towards renewable
sources of electricity generation. In that regard, the EU aims at the achievement of two major
goals: A substantial reduction in greenhouse gas (GHG) emissions, particularly CO2 and an
increase in electricity generation from renewable energy sources (RES-E) that is done in a
cost-efficient way (de Miera, et al., 2008). Apart from that, more RES-E promises energy
security meaning less exposure to volatile energy imports that are associated with (geo-)
promo-2
tion and the EU Emission Trading Scheme (ETS). Whereas the latter was implemented at the
EU level in 2005, support policies are applied at the national level.
While in 2010 RES-E contributed for around 20% of electricity consumption, it is expected to
be between 33 and 40% for 2020 (EREC, 2011). Critics have highlighted the potentially
enormous cost of such a rapid transition leading to inefficiencies and a rise of electricity prices
putting a high burden especially on electricity consumers. This relates to the fact that most
RES-E, except for hydroelectric energy, are young technologies that may be excessively
cost-ly, also due to their stage of development, compared to established sources of energy.
How-ever, there are a multitude of other factors that can determine electricity market efficiency to a
high degree, potentially far outweighing these impacts of the deployment of RES-E. Whereas
policy interventions such as subsidies may lead to market distortions, the ETS may increase
efficiency through internalization. Market conditions such as the degree of competition or
country specific factors also play a role.
In recent years, major reforms have been made in this area. This raises the question of how
these changes impact on market efficiency in Europe as captured by electricity prices and
which factors matter most. So far, the literature on these aspects has produced inconclusive
results. Country case studies do not allow deducing general patterns that may explain price
differences among European countries. Simple cost comparisons between sources fall short of
taking into account important macro-economic and country specific factors that also impact
on the electricity price.
The purpose of this thesis is to take advantage of the variety of electricity markets in Europe
with different characteristics and use them to isolate on average effects of variables that may
3
extended by including other variables relevant for market efficiency. This allows pinpointing
which are the main determinants of the electricity price in addition to technology choice.
General patterns across Europe can thus be identified.
This thesis is organized as follows: Section II covers the main insights from the quantitative
literature that assesses the impact of RES-E deployment on market efficiency. Section III
identifies the main factors of electricity markets and energy policy that impact on the price
and covers its implications for market efficiency. Section IV presents the model and the
theo-retical reasoning for variables used. Section V analyses the data. Section VI provides model
estimations and interpretation of the findings. Section VII concludes with an outlook for
poli-cy makers and future research.
II) Literature review
The empirical literature on the effects on electricity markets of RES-E is still relatively sparse.
These studies also vary a lot in terms of scope, referring to the number of countries and
sources examined, and methodology used. Methodologically, country case studies mostly use
approaches to measure costs of one or more specific source types (Dale et al. 2004) and
some-times compare these costs with benefits specifically related to that source (de Miera et al.
2008), (Frondel et al. 2010), (Kaldellis et al. 2005), (Stevanovic & Puca 2012). These
anal-yses aim at giving an indication as to which technologies may increase market efficiency.
Other papers analyze effects of RES-E support polices by employing a model simulation for
one energy market and observing equilibrium effects of those policies (Hindsberger et al.,
2003), (Unger & Ahlgren, 2007). Also, the interaction of RES-E support and pollution control
policy, especially the ETS-market is discussed (Rathmann 2007). Econometric approaches
4
In terms of country scope, most empirical studies remain at a national level with some
excep-tions looking at a number of countries (Hindsberger et al., 2003), (Lipp, 2007), (Unger &
Ahlgren, 2007), (Ragwitz et al., 2006). Only Moreno et al. (2012) looked at the effects of
RES-E generation on electricity prices in the EU-27. Particularly striking is the fact that
al-most all studies focused entirely on either some particular renewable energy source or overall
renewable energy production. Very few studies compared a renewable source with a fossil
source and only so at the national level (Dale, et al., 2004). No study was found that compared various sources relevant for a country’s energy mix in terms of their different effects on mar-ket efficiency. Some recent criticism has been that this research neglects other factors that
should be considered when assessing electricity market efficiency, such as level of regulation,
competition and market conditions (Traber & Kemfert, 2009) or macroeconomic conditions,
country specific effects and international energy prices (Moreno et al., 2012).
Summarizing, most studies that address the effects of a transition towards RES-E either do
not take into account all relevant sources of electricity generation or do not consider effects
that also determine market efficiency. However, this is important to understand to what
de-gree the energy transition towards RES-E actually matters for prices and in terms of market
efficiency. Also, there is a need to extend research to include more countries so that general
patterns in Europe can be identified.
III) Brief characterization of electricity markets
Please note that market efficiency in this chapter refers to the absence of market distortions. A
certain impact of a variable on prices can indicate increases or decreases in distortions. Also,
production can become more efficient by being able to offer the same quantity at a lower
5
1) Relevant aspects of electricity markets affecting the price
In general, electricity markets can be separated into a wholesale market and a retail market.
On the first one, producers sell electricity to distributors while on the second, distributors sell
to customers. In many cases, the two markets are not separated. Instead, a few or even one
sole company dominates both markets. This is the case if vertical integration exists between
supplier and distributor. Both concentration and vertical integration cause market distortions
that may result in higher electricity prices. This gives rise to the importance of proper
regula-tion e.g. ensuring grid access for newcomers, proper separaregula-tion of markets etc. Recent
re-forms have been undertaken across Europe in the 2000s (Erdogdu, 2011). Research on this
issue has concluded that not simply liberalization but the quality of regulatory conditions and
other country specific factors matter for reducing market distortions (ibid.). In the RES-E
lit-erature, only one study confirmed that reduced market concentration (implying increased
competition) can do so (Moreno et al., 2012). However, more complex indicators for
electrici-ty market conditions exist that have not been used yet, leaving room for improvement
(Conway & Nicoletti, 2006). General economic conditions such as GDP per capita and
inter-national resource prices should also be accounted for (Erdogdu, 2011) as they affect strongly
the electricity price.
On electricity markets, the supply curve, also known as the merit order, consists of the differ-ent electricity sources’ marginal costs. Basically, the wholesale electricity price is determined by the marginal technology supplying the marginal demand. Since there are significant
differ-ences between marginal costs among technologies, the price may change significantly
de-pending on which technology serves the marginal demand. RES-E deployment may affect the
merit order (de Miera et al., 2008). Wind, solar and biomass have comparatively low marginal
6
sources expands on a sufficiently large scale, the supply curve moves to the right and thus,
ceteris paribus, may replace the marginal technology with a technology with lower marginal
cost. This would effectively reduce the wholesale price. In that sense a price decrease would
capture an improvement in market efficiency as the same supply can be offered at a lower
price. Empirical studies analyzing this effect at a country level come to inconclusive results:
Some find that the effect outweighs the cost of RES-E promotion (de Miera et al., 2008)
(Sensfuß et al., 2008) (Rathmann, 2007) (Sensfuß, 2007), others find the opposite (Ragwitz et
al., 2006), whereas some others cannot find proof of its existence (Sorrel, 2003).
In addition to this, the average costs of production determine if more electricity generated by a
certain source decreases or increases the price. Generation investment costs and network costs
are particularly high for relatively new technologies. How these costs develop depends on the technology’s learning curve ratio, which is the price of electricity reduced e.g. per doubling of capacity. Again, empirical studies come to conflicting results with some finding a price
de-creasing effect of new technologies while others find the opposite (Dale et al., 2004), (Frondel
et al., 2010), (Kaldellis et al., 2005) ,(de Miera et al., 2008). Another particularity is that the
electricity sector receives high subsidies as governments seek to lower the electricity price or
increase production by certain sources. This artificial increase of production makes it difficult
to distinguish between price decreases related to a subsidization of a certain source and those
related to lowering of production costs (efficiency gains). Disentangling these effects
empiri-cally is virtually impossible due to the lack of data for many countries (Kitson et al., 2011)
(Badcock & Lenzen, 2010).
The existence of an ETS-market and a price for carbon implies that these additional costs for
generators and distributors can be passed to electricity prices thus increasing them (Moreno, et
7
be reduced, thus lowering the price of carbon and this may lower under certain circumstances
the electricity price (Rathmann, 2007).1
2) RES-E promotion and Feed-in-Tariffs
Policies aimed at promoting RES-E can range from support in R&D to various forms of
subsidies. FIT schemes are by far the most used and considered to be the most important
RES-E support policy in Europe (Ragwitz et al., 2006), (Poputoaia & Fripp, 2008). FITs work as follows: “[…] renewable energy installations receive long-term contracts that guarantee access to the electricity grid at an elevated price. These contracts generally differentiate
among renewable sources, offering higher incentives for more expensive technologies […]”
(Fischer & Preonas, 2010: 5). Empirical literature on the effectiveness of FITs and its
implica-tions for market efficiency and the price is still relatively sparse. One stream of studies
com-pares different policy schemes adopted in several countries and their outcome in terms of
RES-E capacity expansion (Lipp, 2007). Others compare the costs of the policy related to the
subsidies with potential benefits of lowering the electricity price via effective RES-E
promo-tion (de Miera, et al., 2008). While some find a positive effect for single countries (de Miera,
et al., 2008) (Traber & Kemfert, 2009), others find the opposite (Frondel et al., 2010).
The essence of these results is that a FIT policy can be considered effective if it promotes
strong RES-E growth without leading to too big market distortions. In terms of market
effi-ciency it could lead to inefficiencies if too costly projects are financed leading to higher
elec-tricity prices. On the other hand, it could lead to more efficiency if RES-E lower elecelec-tricity
prices by lowering marginal costs of the marginal technology in a given market (merit order
8
effect). Still, moderate price increases with substantial RES-E growth are often considered as
an effective outcome (Mulder, 2008).
When assessing the effectiveness of an FIT scheme, Traber & Kemfert (2009) point out that
one should account for electricity market conditions (such as emission related or general
regu-lation or abuse of market power) as these determine the impact of the FIT. For instance,
oli-gopolies may lead to higher profit-cost margins for electricity providers meaning that they
may still increase prices substantially referring to the higher costs of RES-E despite the cost
coverage via the FIT.
Ragwitz, et al. (2006) stress that administrative and market barriers (e.g. grid access) are
crucial in determining the overall effect of an FIT scheme. Also, commitment and proper
implementation of the policy scheme is necessary (Lipp, 2007), (Genius & Vergis, 2010),
(Río, 2008) Hence, country specific policy design may play an important role for
effectiveness.
IV) The model
The following 3 models contribute to the literature by analyzing what are the main
determi-nants of the household electricity price in Europe. With these models it can be addressed if
RES-E (e.g. wind, hydro) increases the electricity price and if non-RES-E sources lower the
price. This outcome was often expected in the literature reviewed. Also, it can be seen what
kind of electricity market policies affect the price and how. A first intuition about possible
results will be given in section V. In section VI the findings will be interpreted, also in relation
9
1) Model specification
Model 1: Effect of RES-E on household electricity price
Model 2: Effect of single production sources on household electricity price
Model 3: Effect of electricity market policies on household electricity price
where i = 1,…29 (country), t = 1991,…,2007 (model 1 and 2), t = 2004,…,2007 (model 1) and t = 2001,…,2007 (model 3). refers to country effects to take into account any possible country specific effects that may determine the price beyond the variables included. Ln
indi-cates the logged form of a variable (applied to variables of quantities to observe the elasticity).
In model 1 and 2, variables for RES-E and single electricity sources are included. The
coeffi-cients include the total effect of possible merit-order effects, production costs and the effect of
subsidies for each individual source. These factors determine whether an increase in
produc-tion leads to a decrease or increase in prices.
Model 1 aims to look at the overall effect of RES-E on the electricity price. This is based on
the work of Moreno et al. (2012). Different to their work, the analysis will be done for two
time periods instead of one: 1991-2007 and a shorter period 2004-2007. The 2000s represent
10
section V). The impact of high RES-E growth on the electricity market can be analysed by
comparing the two periods. A change from a negative coefficient to a positive coefficient may
be due to an increase in production costs caused by the RES-E growth. For instance,
construction costs may increase as demand for input factors for plant construction increases.
The change of the direction of the coefficient may also indicate less efficiency if even
comparatively bad investment projects receive funding due to the subsidies. The variable
Competition will be compared with Regulation (Model 2 and 3) which has not been used in
such a regression to see which is the best to capture market conditions.
Model 2 will look at which sources of electricity have a price decreasing or increasing effect
for the time span of 1991-2007. This allows to compare single RES-E and non RES-E
sources separately. The significance and magnitude of the RESE-variable’s coefficient in
model 1 reflects the effects of each renewable source. This may lead to misinterpretations.
Renewable sources contained in RESE may be counteracting and neutralizing themselves.
For instance, positive increasing) effects of one variable and negative
(price-decreasing) effects of another may lead to a small magnitude for the coefficient of overall
RESE, suggesting that renewable sources do barely influence the price. This improves
inter-pretation of model 1.
Model 3 looks exclusively at policy variables. The idea is to take into account that major
re-forms of the electricity sector such as the improvement of market conditions and the
introduc-tion of renewable energy support schemes broadly started across Europe at the beginning of
the 2000s. Therefore, restricting the time period to 2001-2007 allows looking at these effects.
Model 3 will thus give an indication on if FITs and regulatory reforms are related with higher
or lower prices. Production variables were not plugged as this would cause problems
11
a short time horizon. It will also be checked if country specific effects influence the
signifi-cance of FIT and Regulation as proposed by Groba et al. (2011). This would imply that
country specific policy design, implementation and other conditions matter for policy
effectiveness (ibid.).
Certain control variables were plugged for all three models because they may contribute
strongly to explaining the electricity price as was suggested by the literature, namely
Green-house Gases, Energy Dependency, GDP per capita. I will also be examined to what degree
country specific conditions explain electricity prices.
2) Theoretical Determinants of Electricity Prices
For the logged production variables, the sign of its coefficients can be interpreted in two ways.
1) A one percentage increase in supply decreases the price by a certain percentage. This
im-plies that the supply expansion all else (market conditions, demand, other supply quantities
etc.) constant lowers the price of electricity of the particular source. If the source is used for
electricity production on a sufficiently high scale, this influences the overall price, since the
overall price of household electricity is a compounded price of the individual prices of
elec-tricity produced by source. If the particular source is relatively cheap in production meaning
that the individual price is below the total price, the overall household electricity price will be
lowered. 2) For a positive relation this works vice versa. Note that the price adaption process
depicted here is affected by market distortions typical for electricity markets (market failure,
externalities etc.). For instance, prices may not decrease because of a monopoly. Controlling
for these special conditions ensures that such an interpretation is possible despite that. A
nega-tive coefficient for a RES-E source will mean that the price lowering effects (cost advantages,
ef-12
fects (cost disadvantages). In the case of a positive coefficient this is vice versa. For a
non-RES-E source a negative coefficient again implies the dominance of price lowering effects
over the potentially price increasing effects.
lnED % change in “Energy Dependence” price index. A compounded annual price of interna-tional gas and oil price averages was constructed using the most relevant price data for
Eu-rope: Dated Brent for oil and the Russian natural gas border price in Germany. Note that this
is a time series variable equal for all countries. As Europe is considered to be energy
depend-ent, an increase in ED index is expected to increase the electricity price.
lnGDP: % change of GDP per capita. When the general economic activity expands, demand
increases and one can expect a positive effect on prices.
lnGHG: % change of greenhouse gases (GHG) emitted by the electricity industry. This
varia-ble should capture the price effect of regulation on all GHG polluting sources (Gas and
Com-bustibles). The sign of the coefficient depends on the strictness of regulation. Consider two
scenarios: 1) If a country contaminates relatively more ceteris paribus (production being
con-stant and not increasing) than another country, it is because regulation is relatively less strict.
This means less costs are imposed on production and it can be produced cheaper. If this is the
case for most countries, one can expect a negative coefficient. The more GHG emitted, the
lower additional regulatory costs imposed and the lower the electricity price.2 2) Vice versa, if
most countries oblige producers to comply with standards such as installing filters or making
payments, costs increase, which is captured by a decrease in GHG. In case of strong
regula-tion one can expect a positive coefficient. The more GHG emitted, the higher the electricity
price. Data on greenhouse gas pollution is by far the most comprehensive data in terms of
2 Under this scenario the price of polluting sources such as coal is not increased due to the absence of internalization, making it more viable to use coal as a potentially cheaper source. Hence, lnGHG also captures part of the effect of production of these sources on the price.
13
years and countries that can serve as a proxy for regulation of energy industry related
pollu-tion. Data on Carbon Market Prices is too recent since the European Emission Trading
Scheme (ETS) only started in 2005.
Competition: Measures the market share of the biggest provider of electricity in the given
national market and thus gives an indicator of market concentration. Rather concentrated
markets can indicate abuse of market power and thus comparatively higher prices. Effects of
policies aimed at liberalization of electricity markets can be captured by this variable, as
liber-alization tends to go along with less market concentration. Data was only available for 1999
on.
Regulation: Indicator of regulatory conditions for the electricity sector. This is a sector
specif-ic indspecif-icator as proposed by Conway & Nspecif-icoletti (2006). It has a range from 0.0 to 6.0 whereas
a 6 represents bad regulatory conditions, a 0 represents optimal conditions according to
eco-nomic theory. Conway & Nicoletti checked for the existence of conditions that aim at tackling
the sector specific problems leading to potential welfare loss. It checks for entry possibilities
for new comers (grid access, liberalized wholesale market, consumer ability to choose among
providers), public ownership and vertical integration between generation and transmission
segments. Compared to Competition, this is a far more comprehensive indicator for market
conditions and quality of regulation policy. One can expect that the higher the index, the
higher the electricity price due to market distortions. This implies that the more regulation and
or market conditions resemble an efficient electricity market, the lower the price. Hence a
price decrease can be related to higher market efficiency.
FIT: Dummy variable with the existence of a Feed-in-Tariff policy being = 1. Two channels
14
if the promoted renewable sources are more costly than their counterparts and thus increase
the final price. b) A large scale expansion of renewable sources can have a Merit-Order effect,
thus decreasing the final price. Note that a) and b) are not captured by FIT if one controls for
renewable production. Hence, a strong price increase through the existence of a FIT may
in-dicate a decrease in market efficiency. According to the literature a moderate increase or
de-crease would indicate a effective policy. Data was constructed by using information provided
by REN21. The implementation of a FIT scheme in a certain year was plugged as a 1 for this
year and subsequent years unless the scheme was stopped. More detailed data on exact
quan-tities of FIT or on other policies such as Renewable Portfolio Standards was discarded due to
the lack of comprehensive data for European countries.
V) Data Analysis
1) Descriptive Analysis of Data
Data on electricity production, prices, emissions and general economic activity were retrieved
from Eurostat. International gas and oil prices were obtained from the IMF. Data on
Feed-in-Tariffs was obtained from the Renewable Energy Policy Network and on the electricity sector
regulation from the OECD. All data is given per year and per country. Overall, the data set
comprises 29 countries (see Annex) over the period 1991-2007 or 17 years. Based on
bi-annual data, bi-annual average electricity prices (excluding taxes) for households with an
aver-age yearly consumption of 3500 kWh was constructed. Of all available bandwidths it is the
closest to the EU country average consumption.
A descriptive analysis of price data can give already an understanding of what patterns and
factors may influence European price levels and growth rates (see Annex II). Overall, national
15
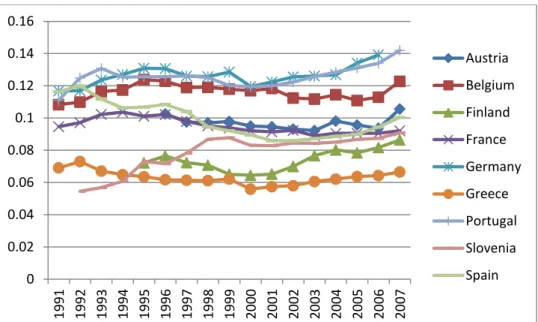
up. In terms of levels, prices vary a lot among European countries. Whereas Italy’s electricity price has varied between 0.19 and 0.14 € per kWh with an average of 0.16 €, Greece’s has merely fluctuated between 0.06 € and 0.07€ with an average of 0.06€. Most national prices were between the range 0.06€ and 0.014€ per kWh, which emphasizes the quite strong differ-ences regarding levels. This is reflected by the standard deviation of 0.03 with an average and
median of 0.09. These findings stress that there may be two types of factors explaining
differ-ences in prices. First, most countries have maintained their price levels through most of the
period with some growth in the last years. This may indicate that there are factors that impact
on countries in a similar way explaining the same growth patterns. Also, with some
excep-tions, the ranking in price levels between countries has not changed a lot. Hence, there may be
factors explaining different price levels that either did not change significantly over time or
are constant over time. Second, the strong growth in prices in some countries (compared to
the more moderate growth or stable prices in other countries) can be explained by time
vary-ing factors.
Regarding production data, the most notable development is the strong growth of new
tech-nologies such as wind, solar, biomass and gas that takes place particularly in the beginning of
the 2000s. Biomass, solar and nuclear energy are excluded from the analysis due to a lack of
observations. International resource prices have been relatively stable throughout the 1990s,
but increased significantly in the 2000s. Whereas in the beginning of the 1990s,
Feed-in-tariffs were only implemented in 5 countries, this number increased to 21 until 2007. In the
1990s, regulatory conditions of electricity markets in the 1990s were far from optimal,
possi-bly heavily distorting markets, as given by our indicator for regulatory conditions. This
16
2) Tests for Panel Data
As descriptive analysis has shown, country specific effects that are constant over time may
influence the electricity price significantly and thus should be controlled for to avoid
unob-served heterogeneity and biased estimators. A Hausman test was run for each model to check
whether a random or fixed effects model was the best specification. For all models, H0 could
be rejected (see Annex) confirming the presence of time fixed country specific effects.
There-fore, fixed effects models were chosen. F-Tests for each model confirmed the significance at
the 1% level of the fixed effects in ai. Hence, the models were correctly specified. Since panel
data always also has a time series dimension, problems related to this type of data may arise.
Seasonality will not be an issue as the data is yearly. All variables were checked for following
a unit root process. The presence of a unit root in one or more of the variables may cause
spu-rious regression results, so testing and correcting for this is vital to obtain robust results. This
is something that has been neglected in previous panel data analyses (Moreno et al., 2012).
Augmented Dickey-Fuller tests were computed accounting for a trend where necessary (see
Annex). For all three models, non-stationarity is not a problem. All regressions were corrected
for heteroskedasticity by using robust standard errors. Testing for time-fixed effects gave that
including time dummies is not necessary. Tests for serial correlation and cross sectional
de-pendence were not necessary since the panel features less than 30 years of observations
(Baltagi, 2008). Due to a recent change in methodology in 2007, data for electricity prices
beyond that year could not be used. However, this restricts the analysis only by 2 years (2008,
17
VI) Results & interpretation
Model 1 - Effect of RES-E on household electricity price
Panel regression results for 1991-2007 gave the overall model a high significance at the 1%
level (see output table in annex). However, lnRESE and lnGHG closely failed to be
signifi-cant at the 10% level. Competition and the Energy Dependency were also not signifisignifi-cant.
Only lnGDPpc proved to be highly significant at the 1% level. Overall, the model’s
explana-tory power is rather mediocre with an R² of 45%. The model was then adjusted, in order to
capture effects from the beginning of the 2000s. Significance levels and overall explanatory
power improve. LnRESE becomes significant from 2001 on, Energy Dependency from 2002,
Greenhouse Gas Emissions from 2003 and Competition from 2004 on. The final model
cap-turing effects from 2004 to 2007 has a good explanatory power with an R² of around 67% and
an overall significance at the 1% level as given by the F-Test results. lnGHG and lnRESE and
time-constant fixed effects are very significant at the 1% level whereas lnGDPpc and lnED
are so at the 5% and Competition at the 10% level. With respect to partial elasticities, logged
GDP per capita has the highest impact on electricity price. A 1% increase in GDP per capita
leads to an increase of the household electricity price of 0.26 %, ceteris paribus, and on
aver-age. A 1% increase in greenhouse gas emissions emitted by the electricity production sector
increases the price by around 0.17% and a 1% increase in the energy dependence price index
leads to a price increase of around 0.11% on average and ceteris paribus. Logged RESE and
Competition have a lesser magnitude inducing only a price rise of 0.07% and a price decrease
of 0.002%, respectively on average ceteris paribus. Fixed country specific effects have a
strong impact, although the exact magnitude cannot be interpreted by construction of the
18
same is the case for GDP per capita and Energy Dependency. GHG emissions have a strongly
positive impact.
Model 2 - Effect of electricity sources on household electricity price
Panel regression results gave model 2 overall a high significance at the 1% level and a good
explanatory power with an R² of 64%. Like in model 1, GDP per capita, Energy Dependency,
the variable for market conditions, and the fixed effects are all significant with similar
magni-tudes. Regarding the different production variables by source, lnHydro and lnGas are
signifi-cant at the 1% level and lnWind at the 5% level. lnCombustibles is only signifisignifi-cant for
pro-duction capacities above 10.000 GWh and if lnGHG is omitted.3 All of them show a negative
coefficient, thus lowering the price. Again, lnGHG is significant at the 5% level, but unlike in
model one, the coefficient is strongly negative. A 1% increase in generation from
combusti-bles decreases the electricity price by 0.16% on average and ceteris paribus. Hydroelectric
generation does so by 0.15%, natural gas by 0.05% and electricity generated by wind by
0.03%. Contrary to results from model one, a 1% increase of GHG emissions decreases the
price by 0.31%.
Model 3 - Effect of electricity market policies on household electricity price
Model 3 is also overall highly significant at the 1% level and exhibits a good explanatory
power with an R² of 67%. Again, logged GDP per capita and the fixed country specific effects
are significant at the 1% level. Unlike in model 1 and 2, lnGHG and lnED are not significant.
Regarding lnGHG, this can be attributed to the fact that the coefficient of lnGHG changes
over time. While it is negative for the whole period, it is positive from 2004 on (see model 1).
This change occurs in the years before 2004, which is why the coefficient becomes
3 lnGHG captures here those effects were pollution (use of polluting sources like coal) is related to a price decrease.
19
cant. Hence, results for lnGHG in model 1 and 2 are still valid. Regarding lnED, the variable
may be affected by the relatively short time period for model 3. Due to the short time horizon, effects of ED may become part of the fixed effects constant . Since it is just a time series variable that is equal for all countries, observations may be too few to give a stable estimate.
FIT and Regulation both have a positive effect on electricity prices that is significant at the
10% level. For the period of 2001-2007, the existence of a FIT scheme does increase the
household electricity price by 0.9% as compared to having no FIT in place on average, ceteris
paribus. Also, a one point increase in the regulatory index, meaning a worsening of market
conditions, leads to a price increase by 2.7%.
Interpretation of results in the context of EU RES-E policy
Please note that when references are made to how a variable influences the prices and may
impact on market efficiency, that the effects captured in the model can materialize or not,
depending on the final general equilibrium result in a real market.
According to the panel regression results run in model 1, increasing RES-E does seem to
in-crease prices for 2004-2007. The price inin-creases starting in 2000 clearly coincide with that
(see descriptive part) and may be to some degree caused by the expansion in renewable
gen-eration. This can be attributed to the expansion of RES-E in the 2000s. However, results of
model 1 for 1991-2007 indicate no such effect was significant. In fact, results from model 2
show that for 1991-2007 all single electricity sources did not increase but decrease prices.
This underlines that there may have been a shift in the 2000s when RES-E expansion caused
price increases to a certain degree. High subsidy levels that fueled an increase in RES-E
gen-eration capacity in the 2000s may explain this. The sudden expansion in scale of RES-E may
produc-20
tion costs. Also, in the short run, average costs tend to be higher for new plant investments
(Varian, 2007).4 This may explain that for the short period of 2004-2007 more costly
produc-tion made prices increase.
Also, subsidies may have not been efficient in selecting projects or may have been so high
that investments with too high costs involved were made. Moreover, electricity companies
may have kept the income from subsidies without passing lower costs to consumers. Another
aspect may be the type of technology that received more investment. Note that e.g. solar
pow-er increased in the 2000s.
Model 3 results show that Feed-in-Tariffs have a price increasing effect so this particular
poli-cy seems to be related with the effect of RES-E on the price and the possible inefficiencies
associated with that. RES-E funded by FIT seems to exercise a price increasing effect. Costs
related with supported RES-E production seem to outweigh a possible merit-order effect. As
expected from theory, sound regulation and addressing of market distortions (as captured by
Regulation) decrease prices and thus seem to increase market efficiency stressing the
im-portance of electricity market reforms. Despite that, one can see that the magnitude of impact
of a FIT scheme only translates into a modest price increase of 0.9%. This highlights the
im-portance for future studies to investigate how the quality of FIT implementation changes this
as suggested by Lipp (2007).
Policies aimed at improving the regulatory environment though seem to be more promising to
increase market efficiency. Moving from relatively bad market conditions (6 on the index) to
very good conditions (0 on the index) would imply a decrease in the household electricity
4
According to theory, every amount of electricity output has its ideal number or size of plants (where average costs are lowest). However, if output increases, a company cannot adapt that rapidly by building more plants. Its average costs increases. In the long run, it can adapt its plant portfolio to the optimal size, so that average costs are lower.
21
price by 16.2%. Some countries have shown that these large scale reforms are possible.
Po-land for instance brought down its indicator from 6.0 to 2.2 within 10 years. The comparison
between model 1 and 3 shows that these factors matter far more than market concentration:
Competition has very little impact on the electricity price. Even a decrease of 50% of the big-gest provider’s market share would decrease price on average and ceteris paribus only by 0.085%.
The high significance and strong impact of GHG emissions in model 1 indicates that in the
analyzed period of 2004-2007, internalization of external effects is working in a sense
emis-sions are related to additional expenditures (abatement measures or payment for emission
certificates) that lead to a higher price. This can be accounted to the implementation of the
ETS in 2005 and a priced in anticipation of this process by producers in 2004. Contrary to
results from model 1, GHG emissions have a strong negative effect on the electricity price in
model 2. Apparently, for the whole period from 1991-2007, GHG related regulation was
rela-tively weak across Europe. Since little cost were imposed on electricity generation related to
GHG pollution, higher GHG emissions imply lower additional costs, leading ceteris paribus
to lower prices. This changed with the emergence of stronger regulation, such as the ETS.
Lastly, as suggested already by the descriptive analysis, country fixed effects play a
substan-tial role in determining the electricity price. These structural aspects can explain the consistent
difference in price levels among European countries. They may also limit a country’s ability
to make use of comparatively cheaper electricity sources due to preferences, historical reasons
or geography disabling the use or access to certain sources. For all three policy variables
(lnGHG, Regulation, FIT), not controlling for fixed effects biased the results making the
coef-ficients insignificant. Thus, all the policy variables depend on country specific effects, so
22
VII) Conclusion
The use of a panel data econometric approach for 29 European countries sheds new light on
the debate of efficiency of RES-E. The thesis finds that electricity generated from
combus-tible sources, natural gas, hydro and wind for the time span of 1991-2007 had a price lowering
effect (for each single source ceteris paribus, on average). In contrast to that, for the time span
of 2004-2007, E had a price increasing effect. High subsidies fueled an increase in
RES-E capacity in the 2000s may explain this. Higher production costs may be due to higher short
term average costs or increase in input prices. Also, subsidies may have not been efficient in
funding projects. Moreover, electricity companies may have kept the income from subsidies
without passing lower costs to consumers. Future research should thus consider longer time
series of data once available to see if price increases are rather a temporary effect caused by
high short term costs of new plants or the product of inefficiencies. In order to capture
ineffi-ciencies, one could see if higher profit-cost margins of electricity providers are related with
higher prices. This would indicate that price increases are related with companies making
more profits through higher prices despite lower generation costs.
Further analysis on policy variables shows that Feed-in-Tariffs have a price increasing effect.
Sound regulation and addressing of market distortions decrease prices and thus seem to
in-crease market efficiency stressing the importance of electricity market reforms. Also, the ETS
seems to contribute to market efficiency through internalization of externalities that increase
electricity prices. Policy-makers should take into account that not the mere existence of a
pol-icy matters. The polpol-icy variables depend on country specific effects, so polpol-icy design,
imple-mentation and commitment seem to play an important role. Country specific characteristics
are an important factor that determines prices. To study the impact of FITs’ impact on market
23
References
Badcock, J. & Lenzen, M., 2010. Subsidies for electricity-generating technologies: A review. Energy Policy, Issue 38, pp. 5038-5047.
Baltagi, B., 2008. Econometric Analysis of Panel Data. New York: Wiley.
Bode, S. & Groscurth, H., 2006. Zur Wirkung des EEG auf den Strompreis, Hamburg: HWWA Discussion Paper. Commission, E., 2008. 20-20 by 2020. Europe's climate change opportunity. COM/2008/0030 final, Brussels:
Euro-pean Commission.
Conway, P. & Nicoletti, G., 2006. Product market regulation in non-manufacturing sectors in OECD countries: measurement and highlights, s.l.: s.n.
Dale, L., Milborrow, D., Slark, R. & Strbac, G., 2004. Total cost estimates for large-scale wind scenarios in UK. Energy Policy, Issue 32, pp. 1949-1956.
de Miera, G. S., Gonzáles, P. d. R. & Vizcaíno, I., 2008. Analysing the impact of renewable electricity support schemes on power prices: The case of wind electricity in Spain. Energy Policy, Issue 36, pp. 3345-3359.
Erdogdu, E., 2011. The impact of power market reforms on electricity price-cost margins and cross-subsidy levels: a cross country panel data analysis, s.l.: Judge Business School, University of Cambridge.
EREC, 2011. Renewable Energy Technology Roadmap., Brussels: European Renewable Energy Council. European Comission, 2009. Market Observatory for Energy Report 2009, Luxembourg: European Commission. Eurostat, 2012. Statistics Database, Luxembourg: European Commission.
Fischer, C. & Preonas, L., 2010. Combining Policies for Renewable Energy: Is the Whole Less than the Sum of Its Parts?, Washington: Resources for the Future.
Frondel, M., Ritter, N., Schmidt, C. & Vance, C., 2010. Economic impacts from the promotion of renewable energy technologies: The German experience. Energy Policy, Issue 38, pp. 4048-4056.
Genius, M. & Vergis, E., 2010. Feed-In-Tariffs and Government Corruption: Another Look at the Diffusion of Re-newable Energy Technologies, Crete: University of Crete.
Groba, F., Indvik, J. & Jenner, S., 2011. Assessing the Strength and Eff ectiveness of Renewable Electricity Feed-in Tariffs in European Union Countries, Berlin: German Institute for Economic Research.
Hindsberger, M., Nybroe, M., Ravn, H. & Schmidt, R., 2003. Co-existence of electricity, TEP and TGC markets in the Baltic Sea Region. Energy Policy, Issue 31, pp. 85-96.
IMF, 2012. IMF Data and Statistics, Washington: International Monetary Fund.
Kaldellis, J., Vlachou, D. & Korbakis, G., 2005. Techno-economic evaluation of small hydro power plants in Greece: a complete sensitivity analysis. Energy Policy, Issue 33, pp. 1969-1985.
Kitson, L., Wooders, P. & Moerenhout, T., 2011. Subsidies and External Costs in Electric Power Generation: A comparative review of estimates, Geneva: International Institute for Sustainable Development.
Lipp, J., 2007. Lessons for effective renewable electricity policy from Denmark, Germany and the United Kingdom. Energy Policy, Issue 35, pp. 5481-5495.
Moreno, B., López, A. & García-Álvarez, M. T., 2012. The electricity prices in the European Union. The role of renewable energies and regulatory electric market reforms. Energy, pp. 1-7.
Mulder, A., 2008. Do Economic Instruments Matter? Wind Turbine Investments in the EU(15). Energy Economics, Issue 30(6), pp. 2980-91.
OECD, 2011. Indicators of Product Market Regulation, Paris: OECD.
Parliament, E., 2001. Directive 2001/77/EC on the promotion of electricity produced from renewable energy sources. Official Journal of the European Communities, Volume 283, pp. 30-33.
Poputoaia, D. & Fripp, M., 2008. European Experience with TGCs and FITs for RES-E Support, Oxford: Environ-mental Change Institute, University of Oxford.
Ragwitz, M. et al., 2006. Monitoring and evaluation of policy instruments to support renewable electricity in EU Member States, Karlsruhe, Germany: Fraunhofer Institute Systems and Innovation Research.
Rathmann, M., 2007. Do support systems for RES-E reduce EU-ETS-driven electricity prices?. Energy Policy, Issue 35, pp. 342-349.
REN21, 2010. Renewables global status report 2010 update., Paris: Renewable Energy Policy Network 21st Century. Río, d. P., 2008. Ten years of renewable electricity policies in Spain: An analysis of successive feed-in tariff reforms.
Energy Policy, Issue 39(5), pp. 2917-2929.
Sensfuß, F., 2007. Assessment of the impact of renewable electricity generation on the German electricity sector—an agent-based simulation approach, Düsseldorf: Universität Karlsruhe.
Sensfuß, F., Ragwitz, M. & Genoese, M., 2008. The merit-order effect: A detailed analysis of the price effect of renewable electricity generation on spot market prices in Germany. Energy Policy, pp. 3086-3094.
24 Sorrel, S., 2003. Back to the Drawing Board? Implications of the EU Emissions Trading Directive for UK Climate
Policy, s.l.: University of Sussex at Brighton.
Traber, T. & Kemfert, C., 2009. Impacts of the German Support for Renewable Energy on Electricity Prices, Emis-sions, and Firms. The Energy Journal, Issue 3, pp. 155-178.
Unger, T. & Ahlgren, E., 2007. Impacts of a common green certificate market on electricity and CO 2 emission mar-kets in the Nordic countries. Energy Policy, Issue 33, pp. 2152-2163.
Varian, H., 2007. Intermediate Microeconomics. A modern approach. 8. Edition ed. Harvard: Norton & Company.
VIII) Annex
1) Data
The 29 countries chosen for the analysis were the EU-27 as well as Norway and Croatia. The latter were selected for being strongly integrated in the EU’s electricity market. Other coun-tries for which this applies had to be excluded due to a lack of data.
2) Table 1: Output & tests
Model Specifications:
Model 1 – (1), (2); Model 2 – (3); Model 3 – (4) (Robust standard errors of coefficients are in parentheses)
Unit root tests for each variable
(1) (2) (3) (4) Augmented Dickey-Fuller Test
(H0: all panels contain unit roots) lnHHPrice (dependent) 1991-2007 >2003 1991-2007 >2000 Reject H0*** for time > 1999
lnRESE 0.038 (0.033) 0.066*** (0.022) - - Reject H0*** Competition -0.001 (0.003) -0.002* (0.001) - - Reject H0*** lnCombustibles - - -0.158* (0.087) - Reject H0*** lnGas - - -0.045*** (0.009) - Reject H0*** lnHydro - - -0.151*** (0.041) - Reject H0*** lnWind - - -0.028** (0.012) - Reject H0*** Regulation - - 0.008 (0.141) 0.027* (0.014) Reject H0***
FIT (dummy, 1= FIT in place) - - - 0.090*
(0.044) -
lnED (0.032) 0.004 0.107** (0.042) 0.087*** (0.020) (0.022) 0.028 Reject H0*** for time >2000
lnGHG 0.091 (0.127) 0.176*** (0.063) -0.311** (0.143) -0.017 (0.024) Reject H0*** lnGDPpc 0.525*** (0.114) 0.265*** (0.117) 0.611*** (0.073) 0.668*** (0.106) Reject H0*** constant (fixed effects) -8.788***
(1.775) -7.674*** (1.316) -3.567** (1.583) -9.066*** (0.959) - Observations 171 88 199 133 R² 0.56 0.67 0.64 0.68
F-Test for joint significance Reject H0*** Reject H0*** Reject H0*** Reject H0*** Hausman-Test FE FE FE FE
Wald Test for heteroskedasticity (use robust SE if H0 rejected)
Reject H0*** Reject H0*** Reject H0*** Reject H0*** Wald Test for time-fixed effects
(H0: no time-fixed effects) Reject H0* (discarded) Reject H0* (discarded) Reject H0*** Accept H0
25
IX) Annex II
Table 1: Stable electricity prices in 9 selected European countries (unit: 1€)
Table 2: Volatile or strongly growing electricity prices in 8 selected European countries (unit: 1€) 0 0.02 0.04 0.06 0.08 0.1 0.12 0.14 0.16 1991 1992 1993 1994 1995 1996 1997 1998 1999 2000 2001 2002 2003 2004 2005 2006 2007 Austria Belgium Finland France Germany Greece Portugal Slovenia Spain 0 0.05 0.1 0.15 0.2 0.25 1991 1992 1993 1994 1995 1996 1997 1998 1999 2000 2001 2002 2003 2004 2005 2006 2007 Czech Republic Denmark Hungary Ireland Italy Netherlands Norway Poland
26
Table 3: Energy dependency Index for Europe (equal for all countries)
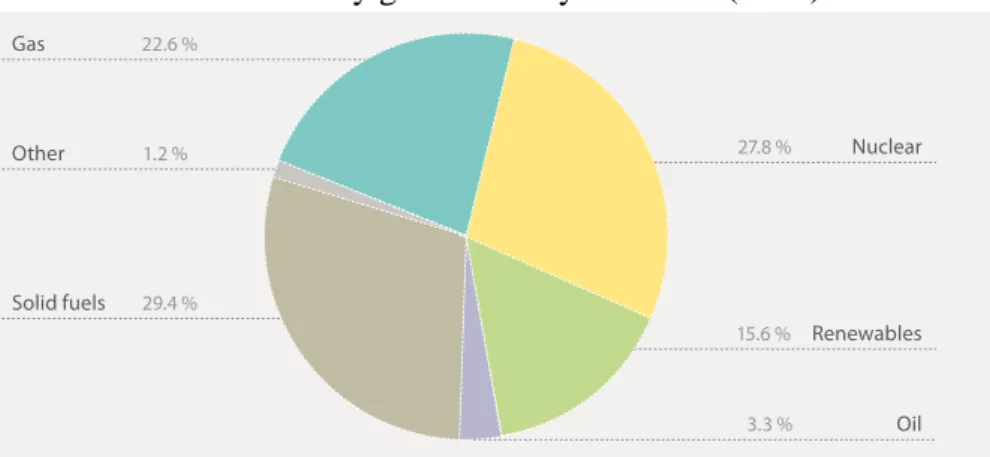
Table 4: EU-27 Electricity generation by fuel in % (2007)
Table 5: EU-27 Electricity from RES-E in gross electricity production in % (2007)
Source: European Commission. Market Observatory for Energy Report 2009
0 20 40 60 80 100 120 1991 1993 1995 1997 1999 2001 2003 2005 2007 Energy Dependency (Int. oil & gas prices)