ISSN: 1809-4430 (on-line)
_________________________
1 Engº Mecânico, Doutorando, Mechanical and Materials Engineering Department, University of Denver, Denver - CO, Fone: (1) 720-810-8349, [email protected]
PERFORMANCE OF SMALL WIND TURBINES: SIMULATION OF ELECTRICITY SUPPLY TO LOADS CONNECTED TO THE PUBLIC OR ISOLATED GRID
Doi:http://dx.doi.org/10.1590/1809-4430-Eng.Agric.v36n2p 281-290/2016
RAFAEL V. RODRIGUES1, LUIZ A. ROSSI2
ABSTRACT: The successful in the implementation of wind turbines depends on several factors, including: the wind resource at the installation site, the equipment used, project acquisition and operational costs. In this paper, the production of electricity from two small wind turbines was compared through simulation using the computer software HOMER - a national model of 6kW and an imported one of 5kW. The wind resources in three different cities were considered: Campinas (SP/BR), Cubatão (São Paulo/BR) and Roscoe (Texas/ USA). A wind power system connected to the grid and a wind isolated system - batteries were evaluated. The results showed that the energy cost ($/kWh) is strongly dependent on the windmill characteristics and local wind resource. Regarding the isolated wind system – batteries, the full supply guarantee to the simulated electrical load is only achieved with a battery bank with many units and high number of wind turbines, due to the intermittency of wind power.
KEYWORDS: Homer, wind power, electricity.
DESEMPENHO DE AEROGERADORES DE PEQUENO PORTE: SIMULAÇÃO DO FORNECIMENTO DE ENERGIA ELÉTRICA A CARGAS CONECTADAS À REDE
PÚBLICA OU ISOLADAS
RESUMO: O sucesso na aplicação de aerogeradores depende de vários fatores, dentre os quais: o recurso eólico no local de instalação, os equipamentos utilizados, os custos de aquisição e operacionais do projeto. Neste trabalho, comparou-se a produção de energia elétrica de dois aerogeradores de pequeno porte, sendo um modelo nacional de 6kW e um importado de 5kW, por meio de simulação, utilizando o programa computacional HOMER. O recurso eólico de três cidades diferentes foi considerado: Campinas (SP/BR), Cubatão (SP/BR) e Roscoe (TX/EUA). Um sistema eólico conectado à rede elétrica e um sistema isolado eólico – baterias foram avaliados. Os resultados mostraram que o custo da energia ($/kWh) é fortemente dependente das características do aerogerador e do recurso eólico local. Em relação ao sistema isolado eólico - baterias, a garantia de suprimento integral à carga elétrica simulada só é alcançada com um banco de baterias com muitas unidades e alto número de aerogeradores, devido à intermitência da fonte eólica.
PALAVRAS-CHAVE: Homer, energia eólica, energia elétrica.
INTRODUCTION
One of the technologies to generate electricity on a small scale is the Small Wind Turbine (SWT). The International Electro technical Commission (IEC) defines a SWT according to the IEC standard 61400-2, as a rotor with swept area smaller than 200 m², which results in an output power of approximately 50 kW (WWEA, 2013). The regulation of micro and mini distributed generation was recently established in Brazil by the normative resolution ANEEL 482/2012, enabling SWT connection to the public grid.
continues to grow as a market, with about 500,000 accumulated installed units, a number that represents 68% of the world market in terms of installed units. The global installed SWT capacity reached more than 576 MW by the end of 2011, with China owning 40% of this total and the United States 35%. More than 120 MW of installed SWT capacity was added in 2011, which means a growth of 27% for this year (WWEA, 2013).
Five countries (Canada, China, Germany, England and the United States) have about 50% of the SWT manufacturers industry. At the end of 2011, 330 manufacturers had been identified worldwide, offering commercially complete generation systems and an estimated 300 additional manufacturers of parts, technology, consulting and resellers (WWEA, 2013). Brazil still holds a market not yet widespread in SWT, with few companies operating specifically in the sector.
The energy supply to isolated rural communities and remote areas has been a constant challenge, especially in underdeveloped or developing countries, due to the huge economic and social disparities, and often to the geographical dimensions of these countries (MARINI & ROSSI, 2005). The electricity supply to isolated electrical loads is a challenge for the Brazilian government. A significant part of isolated communities in the Amazon, for example, have hampered access, which makes the expansion of the public power grid impossible (ELS et al., 2012; ANDRADE et al., 2011.). The application of generation systems based on renewable technologies such as wind and solar can be a viable solution to make the supply. Small wind turbines and photovoltaic cells have been installed in the northern Brazil (PINHO & BARRETO, 2008) to serve small isolated rural communities, being integrated to diesel generators to guarantee supply, minimizing the intermittency of renewable sources.
The technical and economic evaluation is essential to check for viability in the implementation of technologies based on renewable energy sources. The computer program HOMER (Hybrid Optimization Model for Electric Renewable) performs analysis of simulation, optimization and sensitivity, calculating parameters that assist in project evaluation and decision making. An example of the program use is the study by Asrari et al. (2012), which showed that the implementation of a hybrid wind system - diesel - batteries would have been more feasible than the decision made by the local government to extend the public grid, in a rural village in Iran in 2006.
Given the wide applicability of SWT in various regions of the world (KUSAKUNA & VERMAAK, 2013a; KUSAKUNA & VERMAAK, 2013b; SIMIC et al., 2013; NOGUEIRA et al., 2014; AL-FATLAWI et al., 2014; NOGUEIRA & ZURN, 2005), the aim of this study was to evaluate the technical and economic feasibility of installing two small wind turbine with horizontal axis of power ratings 6kW and 5kW, considering wind resource in three different cities. The computer program Homer was used to simulate a wind system connected to the public power grid and an isolated wind system with batteries for storage, comparing the two wind turbines regarding the electric power production performance and the generation costs associated.
MATERIAL AND METHODS
The SWT used in the simulation were an imported model of 5 kW and a national one of 6kW, both with horizontal main axis and three blades. The imported wind turbine uses the profile NACA 4415, with untwisted blades, constant chord length and control system by varying the yaw movement. The national wind turbine uses a multi-blade profile with chord length and twist angle varying along the entire length of the blades and active stalling control system.
The Annual Energy Production (AEP) is one of the parameters calculated by the Homer program. The AEP can be calculated using [eq. (1)], through a combination of the wind turbine electrical power production curve and the probability density function of wind speed occurrence. The Weibull distribution is the one that can best represent a wider range of wind regimes, as it uses two parameters in the probability density function: k or form factor and c or scale factor
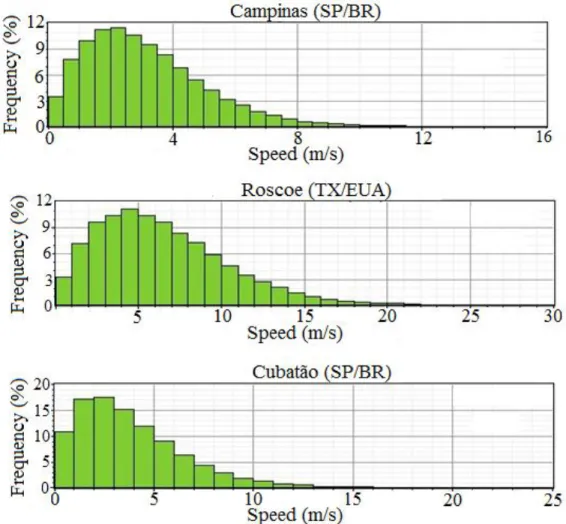
(MANWELL, 2009). It was used to represent the wind systems from the three cities evaluated.
u
dV V f V P
PAE 8,76 ( ) ( ) (1)
In which,
AEP - Annual electricity production, kWh;
V - Wind speed m/s;
P (V) - Electric power produced in wind speed V, W;
f (V) - Wind velocity probability density function.
In this work, the Weibull diagram was determined for three different cities (Figure 1) using the Homer. For the cities of Roscoe (TX/USA) and Campinas (SP/BR), anemometric data from the NASA meteorological data base (2014) were consulted. For a Brazilian location in the city of Cubatão, data from every minute was used and already properly processed and collected in an anemometer tower installed on the site, with k=1.44 and correlation factor=0.78 (CAMARGO SCHUBERT, 2011). The same k and correlation factor values were assumed for Campinas and Roscoe.
The Capacity Factor (CF) of a wind turbine in a given location is defined as the ratio of the electric energy produced by the wind turbine and the electric energy that could have been produced if the equipment was to operate in its nominal Installed Capacity (IC) at the 8760 hours of the year (MANWELL, 2009). It was evaluated using [eq. (2)].
8760 100 CI PAE
FC (2)
The Net Present Cost (NPC) represents the cost of a system’s life cycle. The total NPC considers all costs and resales that occur in the project lifetime to calculate an amount in current $, with future cash flows discounted to present value, according to discount rate i adopted. According
to Copel (2007), the discount rate i to be adopted in wind systems projects corresponds to the IGPM
rate. In this study the value i = 5:53% was used, the accumulated IGPM of 2013 (FGV, 2014).
Equation (3) was used to assess the net present value.
) , ( , N i CRF C
CNPC anntot (3)
In which,
tot ann
C , - Total annualized cost, $;
I - discount rate;
N - project lifetime, years;
CRF- capital recovery factor; given by [eq. (4)] (SHAAHID et al, 2013):
1 ) 1 ( ) 1 ( ) , (
N N
i i i N i
CRF (4)
The Homer program defines the Cost of Energy (COE) as the average kWh cost of the usable electric energy produced by the system. The program divides the annualized production cost of electricity by the total electric load servedEatendida.. Equation (5) was used for its calculation.
atendida tot ann E
C
COE , (5)
The renewable fraction (RF) is the electric power fraction delivered to the load that comes from renewable energy sources. In the case of a single wind power system, for example, FR=1.
In this simulation, the input data referring to the costs demanded by the HOMER were: - Acquisition cost of the wind system (wind turbine, inverter, and tower) equal to R$ 8,500.00/kW (NOGUEIRA et al., 2014).
- Battery cost equal to R$ 300/kWh, (NOGUEIRA et al., 2014).
- The annual cost of operation and maintenance of each wind system was assumed to be 0.5% of the initial purchase cost; (ASRARI et al., 2012).
- The cost of kWh purchased from the public grid was admitted as R$0.34/kWh for the three cities, which is the average cost per kWh for the Southeast region of Brazil (ANEEL, 2014).
RESULTS AND DISCUSSION
The two wind turbines were simulated through the Homer computer program. The wiring diagram of the configuration system generation connected to the public power grid is shown in Figure 2. Tables 1 and 2 summarize the main results of this configuration’s operation simulation for the three cities analyzed.
FIGURE 2. Wiring diagram of the wind system connected to the public power grid: wind turbines AC, inverter, public power grid and electric load.
Regarding the imported wind turbine (Table 1) and comparing the three wind profiles evaluated, Roscoe (TX/USA) has the highest CF and AEP values, 21.2% and 9283 kWh respectively. The wind profile of Campinas (SP/BR) showed the highest COE and NPC values and the lowest values of CF and RF; Cubatão (SP/BR) has intermediate values in relation to the parameters evaluated for the three cities.
TABLE 1. Wind System with imported wind turbine and electric public grid.
Brazil United States
Campinas (SP) Cubatão (SP) Roscoe (TX)
COE (US$/kWh) 0.281 0.244 0.179
NPC (US$) 45,640 42,017 35.814
CF (%) 4.2 9.97 21.2
RF (%) 13 30 55
AEP (kWh) 1839 4367 9283
AEP sales (kWh) 48 877 3166
AEP purchases (kWh) 11787 10088 7460
US$1 = R$2.20 (FGV, 2014).
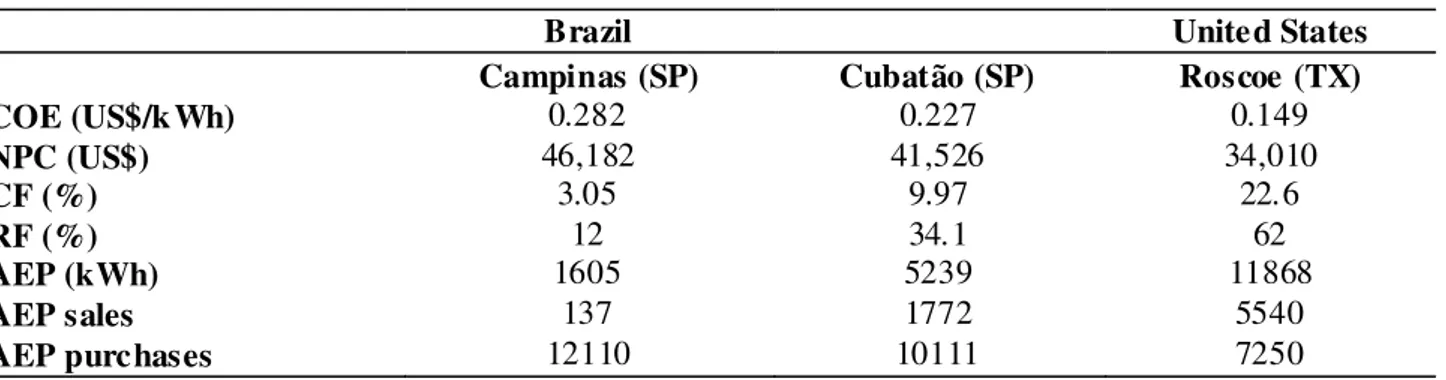
For the national wind turbine (Table 2), the wind profile of Roscoe (Texas/USA) again has the highest CF and AEP values, 22.6% and 11,868 kWh respectively, and had the lowest values of COE and NPC, US$ 0.149/kWh and US $ 34,010 respectively. The wind profile of Campinas (SP/BR) again showed the highest values of COE and NPC and the lower FC and RF values, US$ 0.282/kWh, U$ 46,182, 3.05% and 12%, respectively.
TABLE 2. Wind turbine system with the national wind turbine and public power grid.
Brazil United States
Campinas (SP) Cubatão (SP) Roscoe (TX)
COE (US$/kWh) 0.282 0.227 0.149
NPC (US$) 46,182 41,526 34,010
CF (%) 3.05 9.97 22.6
RF (%) 12 34.1 62
AEP (kWh) 1605 5239 11868
AEP sales 137 1772 5540
Regarding the wind profile of the city of Campinas and comparing the two SWT, national and imported, the imported wind turbine produces 15% more electricity; the CF capacity factor is 1.05% higher and the share of renewable energy RF is the same. Regarding the city of Cubatão, the national SWT produces 20% more electricity, the CF capacity factor is the same and the renewable energy fraction is 12% higher. Finally, in relation to the city of Roscoe, the national SWT produces 28% more electric power, the capacity factor is 1.4% higher and the renewable energy fraction is 27% higher. The conclusion is that the national wind turbine is the most viable option for the cities of Cubatão and Roscoe, while the imported wind turbine is the best option for the city of Campinas.
The electric power output of SWT instantaneously varies with local wind speed and in many instances is not sufficient to supply entirely the electric load profile that was simulated. The city of Campinas is the one with the worst wind resource among the three evaluated, and had the greatest power purchase values of the public power grid. The sale of electricity corresponds to the electric power surplus produced by the wind turbines at times when the electrical load is already 100% supplied. The maximum value of 34.1% of the total electricity produced by the imported SWT was sold to the public power grid to the city of Roscoe and 46.6% for the national SWT to the same city. Asrari et al (2012) obtained a COE for an SWT of 10kW of 0.144 (US$/kWh) for a remote rural village in Iran, a value that is 1.95 times lower than the COE of the 2 SWT simulated in this paper for the wind profile in the city of Campinas (SP/BR). For Cubatão (SP/BR), the COE of the imported SWT is 1.69 times higher and the COE of the national SWT is 1.57 times lower. In relation to Roscoe (TX/USA), the COE of the imported SWT is 1.24 times higher and the COE of the national SWT is 1.03 times higher. The technical and economic feasibility of applying the SWT of 10kW is more easily achieved for the wind profile of the remote rural village in Iran compared to the two SWT, national and imported, for any of the three wind profiles evaluated.
The Capacity Factor is an important parameter to indicate the wind turbine productivity and determine if the equipment is able to participate in financial incentive programs. The incentive policies (CCSE, 2014), implemented by the California Energy Commission, is an example of a renewable energy incentive program and uses the minimum amount of 25% of the capacity factor so that an entrepreneur can receive financial incentives of U$100/kW of installed SWT. In this study, the imported wind turbine had a maximum capacity factor of 21.2%, for Roscoe (TX/USA), value which is lower than the minimum eligible to receive incentives.
Simic et al. (2013) evaluated the AEP of the same imported wind turbine from this study and of 43 other SWT models with nominal power between 2 and 6 kW for two different scenarios in relation to the wind resource available, the height of the wind turbine and the lifetime of the project. The capacity factor varies greatly for SWT, wherein the imported model of 5kW had the capacity factor rated at 26% and 20% for the two scenarios, respectively. Thus, the same SWT can be accepted in incentive programs in a particular region and re fused in another, according to the capacity factor and local incentive policies.
FIGURE 3. Wiring diagram of the isolated wind system with batteries.
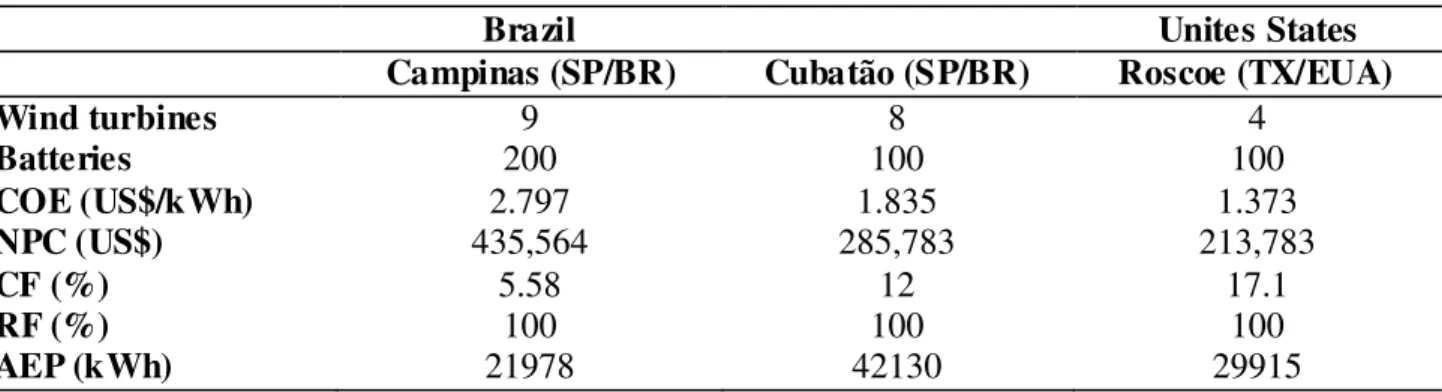
As shown in Table 3, the wind speed profile of Roscoe (TX/USA) with the four imported wind turbines had the COE estimated at 1,373 (US$/kWh), 4 times lower than the COE evaluated for Campinas (SP/BR) with nine wind turbines, at 5.58 (US$/kWh). Roscoe also had again the highest CF value, 17.1%. The city of Campinas (SP/BR) had the lowest CF values, 6.42% and 11.52%, lower than Cubatão (SP/BR) and Roscoe (TX/USA), respectively. Cubatão (SP/BR), with eight wind turbines, is the intermediary between these cities considering the evaluated parameters.
TABLE 3. Simulation results of the wind-battery system, imported wind turbine.
Brazil Unites States
Campinas (SP/BR) Cubatão (SP/BR) Roscoe (TX/EUA)
Wind turbines 9 8 4
Batteries 200 100 100
COE (US$/kWh) 2.797 1.835 1.373
NPC (US$) 435,564 285,783 213,783
CF (%) 5.58 12 17.1
RF (%) 100 100 100
AEP (kWh) 21978 42130 29915
US$1 = R$2,20 (FGV, 2014)
For the national wind turbine (Table 4), the city of Roscoe (TX/USA) again has the highest CF value, 18.30%; Roscoe also had the lowest COE value, US$1,257/kWh. The city of Campinas (SP/BR) again showed the highest values of COE and NPC and the lowest CF values, US$5,582/kWh, U$651.235 and 5.11%, respectively.
TABLE 4. Simulation results of the wind power system with batteries, national wind turbine.
Brazil United States
Campinas (SP/BR) Cubatão (SP/BR) Roscoe (TX/EUA)
Wind turbines 10 8 3
Batteries 350 200 100
COE (US$/kWh) 5.582 2.828 1.257
NPC (US$) 651,235 440,504 195,783
CF (%) 5.11 11.4 18.3
RF (%) 100 100 100
AEP (kWh) 26874 47945 28858
US$1 = R$2.20 (FGV, 2014)
different cases of electrical load and energy resource. In the first case, a system composed of 7 SWT of 7.5kW and 771.12 kWh of battery (357 Trojan LP16) had the COE valued at U $ 9,311/kWh for peak electricity load of 3.4kW and 9.5kWh/day. In the second case, a system with 4 SWT of 7.5kW and 470,88kWh of batteries (218 Trojan LP16) had the COE valued at U$0.431/kWh. In this paper, the system architectures that ensure full supply also require a battery bank with a large number of units and high SWT number. As a result, the cost of the system is higher when compared to the cost of configuration in the case of the system connected to the power network.
NOGUEIRA et al. (2014) developed an optimization algorithm that ensures the lowest COE and maximum reliability for the design of wind and photovoltaic hybrid systems with batteries. A case study was carried out at a rural isolated area in southern Brazil and the COE was calculated for six different configurations, considering different values of probability of power supply loss. The option of optimized isolated wind system with batteries (without photovoltaic) was using four SWT s of 0.6kW and 7 battery of 1.92kWh each, with the COE assessed at R$1,048/kWh, 2.63 times lower than the lowest COE rated in this work (Roscoe, national wind turbine). NOGUEIRA & ZURN (2005) implemented algorithm for the design of hybrid systems for electricity generation based on the probability of supply loss. The hybrid system consists of a small hydroelectric power plant from 2.8kW to 3kW and from three to four SWT and the cost ranged from US$0.13/kWh to US$0.158/kWh, which is between 8 and 9 times lower than the cost estimated in this work (Roscoe, national wind turbine).
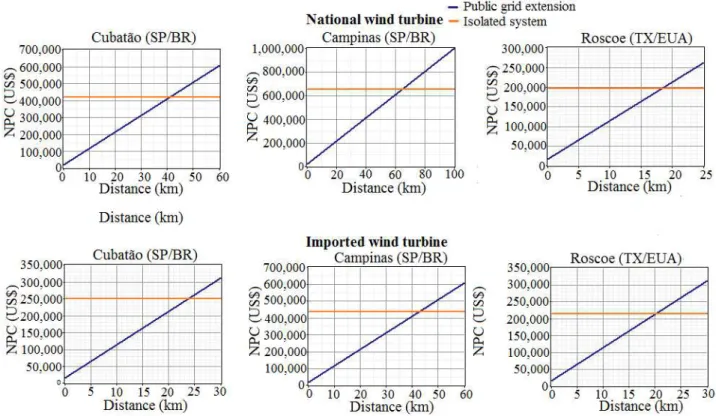
The distance from the electric power network which causes the net present cost of the public electricity network extension to equal the net present cost of the isolated wind system (break-even distance) was also calculated for the three cities (Figure 4). This distance var ies depending on the wind turbine used and local wind resource. Although the simulated electrical load can be fully met by the proposed wind isolated systems, the economic viability is achieved only for loads which are very far from the public network.
CONCLUSIONS
The production of electricity from wind turbines of the same size varies depending on the local wind resource and on the wind turbines technical and operational characteristics. The wind turbine should be designed or purchased taking into account the local wind profile, so that the performance in electric power production can be maximized.
Although the option of an isolated wind system not integrated with other energy sources is reliable to entirely meet the simulated electrical charge for the wind profiles assessed, the wind power intermittency can derail the project. A battery bank with a high number of units and high number of wind turbines is needed in all wind profiles evaluated for full supply guarantee to the simulated load, considerably increasing the associated costs. For the imported wind turbine, the wind-battery system COE comes to be up to 9.95 times higher than the wind turbine system COE –
electric network (Campinas). The same analysis for the domestic wind turbine shows that the COE comes to be up to 19.8 times higher in the most discrepant event (Campinas).
The break-even distance varies depending on the turbine used and on the local wind resource. For the isolated system, for all three-wind resources evaluated, the wind turbines will be feasible only in sites with very high wind resource or in places very far from the public electric network. Roscoe had the lowest break-even distance values, which makes it the location with the greatest potential for application of wind-battery system among those analyzed. However, the minimum distance from the electric network to economically justify the use of batteries is still high, about 18km if considering the national wind turbine. There is a small gain comparing to the imported wind turbine and considering the same location, for the minimum break-even distance is approximately 20km.
ACKNOWLEGEMENTS
We are thankful to ‘Faculdade de Engenharia Agrícola da Universidade Estadual de Campinas’ and to the company CPFL Energia.
REFERENCES
AL-FATLAWI, A.W.A.; Technical and economic analisys of renewable energy powered stand-alone pole street lights for remote area. Environmental Progress & Sustainable Energy, Malásia, v.33, p. 283-289, 2014.
ANDRADE, C.S.; ROSA, L.P.; SILVA, N.F.. Generation of electric energy in isolated rural communities in the Amazon Region a proposal for the autonomy and sustainability of the local populations,
Renewable and Sustainable Energy Reviews, Amsterdam, v.15, p.493–503, 2011.
ASRARI, A.; GHASEMI, A.; JAVIDI, M.H.. Economic evaluation of hybrid renewable energy systems for rural electrification in Iran – A case study, Renewable and Sustainable Energy Reviews,
Amsterdam,v.16, p.3123-3130, 2012.
CAMARGO SCHUBERT. Certificação de Medições Anemométricas. Relatório técnico para atender o
projeto de Pesquisa e Desenvolvimento ANEEL n°0393-002/2006. Curitiba, 2011. 31 p.
COPEL - COMPANHIA PARANAENSE DE ENERGIA. Manual de avaliação tecnico-econômica de
empreendimentos eólico-elétricos 2007. Relatório técnico para atender o projeto de Pesquisa e Desenvolvimento ANEEL – CGER 001. Curitiba. 104p.
CCSE - CALIFORNIA CENTER FOR SUSTAINABLE ENERGY. 2014 Self generation incentive
program: Provides financial incentives for installing clean, efficient, on-site distributed generation, 2014, 97p. Disponível em: <https://energycenter.org>. Acesso em: 04 abr. 2016
FGV – FUNDAÇÃO GETÚLIO VARGAS. Disponível em: <http://portal.fgv.br/>. Acesso em: 24 jun. 2014
KUSAKUNA, K.; VERMAAK, H.J.. Hydrokinetic power generation for rural eletricity supply: Case of South Africa, Renewable Energy, Oxford, v.55, p.467-473, 2013a.
KUSAKUNA, K.; VERMAAK, H.J.. Hybrid renewable power systems for mobile telephony base stations in developing countries, Renewable Ene rgy, Oxford, New Jersey: v. 51, p. 419-425, 2013b. MANWELL, J. Wind ene rgy explained: theory design and application. John Wiley & Sons, 2009. 677p. MARINI, J.A.; ROSSI, L.A.. Sistematizacao do dimensionamento tecnico e economico de sistemas fotovoltaicos isolados por meio de programa computacional, Engenharia Agricola, Jaboticabal, v.25, n.1, p.67-75, Jan. 2005.
NASA - National Aeronautics and Space Administration. Disponível em:
<https://eosweb.larc.nasa.gov/cgi-bin/sse/[email protected]>. Acesso em: 23 jun. 2014. NOGUEIRA, C.E.C; VIDOTTO, M.L.; NIEDZIALKOSKI, R.K.; SOUZA, S.N.M.; CHAVES, L.I.; EDWIGES, T.; SANTOS, D.B.; WERNCK,I.. Sizing and simulation of a photovoltaic-wind energy system using batteries, applied for a small rural property located in the south of Brazil, Renewable and Sustainable Energy Reviews, Amsterdam, v.29, p.151-157, 2014.
NOGUEIRA, C.E.C; ZURN, H.H.. Modelo de dimensionamento otimizado para sistemas energeticos renovaveis em ambientes rurais, Engenharia Agricola, Jaboticabal, v.25, n.2, p.341-348, Brazil, May/Aug 2005.
PINHO, J.T.; BARRETO, E.J.F.. Sistemas Híbridos: soluções energéticas para a Amazônia. Brasília: Editora do Ministério das Minas e Energia, 2008, 396p.
SIMIC, Z.; HAVELKA, J.G; VRHOVCAK, M.B.. Small wind turbines- a unique segment of the wind power market, Rene wable Energy, Oxford, v.50, p.1027-1036, 2013.
SHAAHID, S.M.; AL-HADHRAMI, M.K.; RAHMAN, M.K.. Economic feasibility of development of wind power in coastal location of Saudi Arabia – A review, Renewable and Sustainable Energy Reviews, Amsterdam, v.19, p.589-597, 2013.
WWEA - WORLD WIND ENERGY ASSOCIATION. 2013 Small wind world report updated. Bonn,