The browsing of UC Digitalis, UC Pombalina and UC Impactum and the consultation and download of titles contained in them presumes full and unreserved acceptance of the Terms and Conditions of Use, available at https://digitalis.uc.pt/en/terms_and_conditions.
As laid out in the Terms and Conditions of Use, the download of restricted-access titles requires a valid licence, and the document(s) should be accessed from the IP address of the licence-holding institution.
Downloads are for personal use only. The use of downloaded titles for any another purpose, such as commercial, requires authorization from the author or publisher of the work.
As all the works of UC Digitalis are protected by Copyright and Related Rights, and other applicable legislation, any copying, total or partial, of this document, where this is legally permitted, must contain or be accompanied by a notice to this effect.
Measuring technical efficiency of European Countries using data envelopment
analysis
Author(s:
Vaz, Clara Bento; Ferreira, Ângela Paula
Published by:
Imprensa da Universidade de Coimbra
Persistent URL:
URI:http://hdl.handle.net/10316.2/38147
DOI:
DOI:http://dx.doi.org/10.14195/978-989-26-1039-9_1
Accessed :
5-Jan-2018 17:07:29
ASSESSMENT
METHODOLOGIES
ENERGY, MOBILITY AND OTHERREAL WORLD APPLICATION
PEDRO GODINHO
JOANA DIAS
EDITORS
IMPRENSA DA UNIVERSIDADE DE COIMBRA
ME A S U R I N G TE C H N I C A L EF F I C I E N C Y O F EU R O P E A N
CO U N T R I E S U S I N G DATA EN V E L O P M E N T AN A LY S I S
Clara Bento Vaz1 and Ângela Paula Ferreira2
Abstract
This study proposes a Data Envelopment Analysis (DEA) framework to assess the technical efficiency of 26 European countries in the last five years, under the ongoing 2020 energy policy. DEA is used to estimate efficiency which is comple-mented by bootstrapping to obtain statistical inferences. Further, we explore the relationship between the targets regarding energy efficiency, renewable energy share and the greenhouse gas emissions and, in addition, the electricity prices derived from the energy system on the efficiency levels of European countries through a panel data truncated regression with bootstrapping. It is observed that the bias-corrected efficiency of the economies increased approximately 13%, on average, since 2009. The results achieved bring into view that the efforts regard-ing the energy policies developed in each country to follow 20-20-20 targets, have not threatened the improvement of their efficiency.
1. Introduction
In the last decades, the European Union (EU) has been promoting an integrated approach to climate and energy policy, aiming combat climate
change, increase the EU’s energy security and strengthen its
competi-1 Polytechnic Institute of Bragança, Campus de Santa Apolónia, Apartado 1134,
5301-857; CGEI/INESC TEC – INESC Technology and Science, Portugal, e-mail: [email protected]
2 Polytechnic Institute of Bragança, Campus de Santa Apolónia, Apartado 1134, 5301-857,
tiveness. There is also a geostrategic objective, which aims to reduce excessive dependence on imported fossil fuels. In fact, the long-lasting
instability in many fossil fuel-producing countries increases the price of
energy and reinforces the need to find alternatives. As a consequence, a paradigm shift has arisen in the global energy sector, foreseeing a
sus-tainable and environmentally friendlier development. The climate and energy package in EU has been set through binding legislation, which
establishes the following three key objectives for 2020, known as the 20-20-20 targets (EU, 2009):
• 20% reduction in greenhouse gas emissions from 1990 levels; • Raising the share of energy consumption produced from renewable
resources to 20%;
• A 20% improvement in the energy efficiency.
Within this context, the main objective of this work is to determine
the technical efficiency of EU countries for the last five years with avail-able data, i.e., from 2009 till 2013. The level of the technical efficiency is
evaluated through the mix of energy consumption, labor force and gross fixed capital formation (measuring the value of fixed assets) on the Gross
Domestic Product (GDP) maximization of each economy.
From an economics point of view, each economy is efficient if it
in-creases its GDP by decreasing the used resources, through technological, behavioural and economical changes. In the scope of energy efficiency, it
encompasses the energy reduction for a given service or level of activity (WEC, 2008), i.e., each economy should promote the energy efficiency by
eliminating the redundant energy consumption. In terms of environmental perspective, it is important that the growth of the economy is based on
the sustainable use of resources to produce outputs.
Additionally, this work also explores factors concerning the penetration of renewable energy in total energy consumption, the greenhouse gas
emissions and the electricity prices on the efficiency estimates.
The technical efficiency of the economies under analysis is
evaluat-ed through Data Envelopment Analysis (DEA). The potential of DEA in energy studies has been gradually investigated by researchers due to
benchmarking in the energy sectors, particularly in the electricity area (Zhou, et al., 2008). DEA allows the identification of the countries with
best practices, from which linear combination defines the best frontier
technology. By reference to this frontier, the technical efficiency for each country is determined, through the use of the fundamental resources as
energy, labor and capital to maximize the production of the GDP. Since DEA is a deterministic approach, the construction of the best
frontier can be affected by random noise or measurement errors in the data. To assure the robustness of the efficiency estimates, the DEA
as-sessment is complemented with the appropriate bootstrapping to derive statistical inference. To explore the relationship between the efficiency
estimates and the impact of the renewable energy penetration, the green-house gas emissions and the electricity prices, a panel data truncated
regression is used.
The remainder of this paper is organized as follows. Next section describes the literature review and the following one presents the
perfor-mance assessment methodology used. Fourth and fifth sections present the data used and the results achieved. Finally, last section summarizes
the paper findings.
2. Literature review
In the energy literature, there is no consensus on the appropriate
method for defining and measuring energy efficiency. It is common to proxy energy efficiency using a simple average indicator such as the ratio
of energy to GDP or the reciprocal (Khademvatani, Gordon, 2013). This
traditional energy efficiency indicator takes energy consumption into account as a single input that produces an economic output; therefore,
some other key inputs are ignored, such as capital and labor (Zhang, et
al., 2011). Energy consumption must be combined with other inputs to
produce an economic output, such as labor or capital. Boyd and Pang (2000) argue that energy efficiency improvement relies on total factor
energy efficiency indicator, an increasing number of researchers have adopted the DEA for the assessment of total factor energy efficiency in
different countries from the viewpoint of technical efficiency. Some
exam-ples of such studies are (Hu, Kao, 2007), (Hu, Wang, 2006), (Chien, Hu, 2007), (Zhang, et al., 2011), (Zhou, et al., 2012) and (Menegaki, 2013).
To consider statistical noises, Zhou, et al. (2012) present a parametric
stochastic frontier analysis (SFA) approach to measure total factor energy
efficiency performance of OECD countries. The SFA method assumes that deviations from the efficient frontier are composed by inefficiency and
statistical noise terms, however it is a parametric technique that requires a-prior specification of the functional form of the best practice frontier
as opposed to non-parametric nature of DEA. Although there are many studies investigating the total factor energy efficiency, its relationship
with the use of renewable energy sources has been studied by fewer
authors, for instance (Zhou, et al., 2012) and (Menegaki, 2013). In order
to fulfil some gaps existing in the literature, we assess the total factor
energy efficiency of EU economies, investigating the relationship between their efficiency and the penetration of renewable energy sources. This
analysis is performed through the suitable bootstrap framework (Simar, Wilson, 1998; 2007) to obtain statistical inferences on efficiency estimates
derived from DEA models.
3. Performance assessment methodology
The total factor energy efficiency for each economy is evaluated
through the technical efficiency derived from the DEA model, introduced
by Charnes, et al. (1978). DEA is a non-parametric approach to assess
the relative efficiency of a homogeneous set of Decision Making Units
(DMUs) in producing multiple outputs from multiple inputs. DEA is used to assess the technical efficiency of the European countries in
produc-ing GDP by takproduc-ing into account the production factors. DEA allows the
identification of the best practices DMUs and their linear combination
production possibility set (PPS). For the inefficient DMUs located inside the PPS, the magnitude of the inefficiency is derived by the distance to
the frontier and a single summary measure of efficiency is calculated.
Consider a set of 𝑛 DMUs 𝑗 (𝑗 =1,…,𝑛), each consuming m resources (inputs) 𝑥𝑖𝑗 (𝑥1𝑗 ,…,𝑥𝑚𝑗 ) to produce s results (outputs) 𝑦𝑟𝑗 (𝑦1𝑗 ,…,𝑦𝑠𝑗 ). For an output maximizing perspective and assuming the most productive frontier observed, defined by constant returns to scale, the relative efficiency of the
assessed DMUo can be evaluated using the linear programming model (1):
≥ ∑ , ≤ ∑ , (1)
The optimum solution of model (1), ℎ∗, corresponds to the maximum factor by which the outputs levels can be expanded with the current level
of resources. The relative efficiency (𝜃) of the assessed DMUo is estimated by the reverse of ℎ∗. DEA enables to identify the efficient DMUs which have
the best practices and the inefficient units which activity can be improved.
The efficiency measure is equal to 100% when the unit under assessment is efficient, whereas lower scores indicate the existence of inefficiencies.
For inefficient units, it is also possible to obtain, as by-products of the DEA efficiency assessment, a set of targets for becoming efficient, which
are feasible points observed on the frontier.
To correct the DEA efficiency estimates for bias, the bootstrapping
method is used according to Simar and Wilson (1998), which is suitable for use with DEA efficiency estimates, ranging from 0 to 1. Efron (1979)
proposed bootstrapping based on the idea of resampling from an original sample of data to derive replicate datasets from which statistical
infer-ence can be performed. Resampling directly from the original data (naïve bootstrap) provides a poor estimate of the data generating process (DGP)
as the efficiency estimates computed by model (1) are truncated, with
upper value equal to one and there may exist several estimates equal to unity. Simar and Wilson (1998) proposed the smoothed bootstrap method
suitable to DEA, estimating the original densities of the non-parametric efficiency scores using kernel smoothing methods combined with a
reflec-tion method (Silverman, 1986) by mimicking the DGP. This procedure was implemented using the statistical software R including the FEAR library,
interval for 𝜃, the bias and the bias-corrected efficiency, . These scores are used to assess the countries performance.
To explore the factors that can be associated with good efficiency levels of the economies we use the bootstrap-truncated regression formulated
according to the double bootstrap method (algorithm #2) proposed by Simar and Wilson (2007), in which efficiency scores are bootstrapped in
the first stage, as explained before, and then the second step is per formed based on the bootstrap truncated regression. This approach is used to
investigate the penetration of renewable energy into the total energy
consumption, the greenhouse gas emissions and electricity prices on efficiency levels of countries. Additionally, a panel data truncated model
controlling for time effect is used. Considering the country 𝑗 (𝑗 =1,…,𝑛) in the time period 𝑡 (𝑡 =1,…,𝑚), the impact of the regressors, defined by variables 𝑧𝑗 𝑡 on efficiency score 𝜃𝑗 𝑡 , is assessed by the following model:
𝜃𝑗 𝑡 =𝛼𝑜+𝛿𝑡 +𝑧𝑗 𝑡 𝛽+𝜀𝑗 𝑡 (2)
where 𝛿𝑡 is a vector of dummy variables for each year, 𝛼𝑜 denotes the
intercept and 𝛽 corresponds to the vector of regression coefficients to be estimated and 𝜀𝑗 𝑡 is the error term with a ) distribution with a
trun-cation at (1−𝛼𝑜−𝛿𝑡 −𝑧𝑗 𝑡 𝛽). The 𝜃𝑗 𝑡 corresponds to the efficiency of country
𝑗 , in year 𝑡 , estimated using model (1) and corrected by bootstrapping.
4. Data description
This study considers the panel dataset of EU-28 countries, for which data ranges from 2009 till 2013. Data on labor, energy consumption,
capital and GDP are collected from the Eurostat database. The GDP is defined at market prices, in Purchasing Power Standard (PPS) per
inhabitant. Total energy consumption encompasses gross inland energy consumption by renewable and nonrenewable energies, in tons of oil
equivalent (toe) per inhabitant. Capital is the real gross fixed capital formation at market prices, in PPS per inhabitant. Labor is assessed
percent-age of the labor force which is the total number of people employed and unemployed (persons aged 15 to 74). Before proceeding with the
analysis, the existence of outliers is checked as the location of the
best--practice frontier is sensitive to extreme observations. From the original 28 countries, based on the available data, 2 were considered outliers
(Luxembourg and Irland). Additionally, some data about Greece is not available in 2013, and, consequently excluded from the assessment. Thus,
the final sample includes 129 observations, from 26 countries, excluding data from Greece in 2013 year.
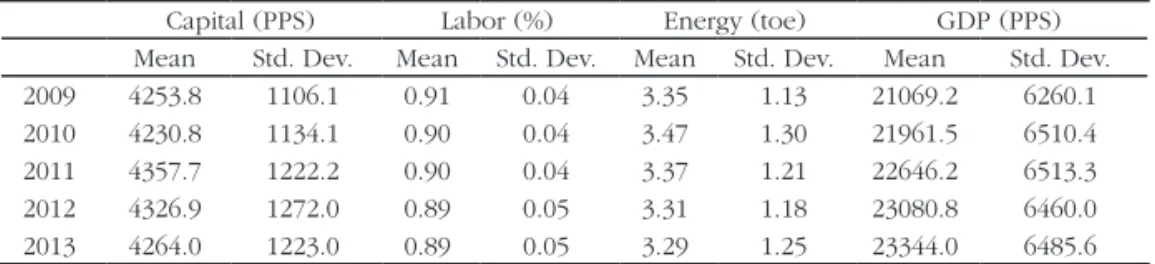
Descriptive statistics of the variables across countries, in the corres-ponding year, are summarized in Table 1.
Table 1: Descriptive statistics of the data under analysis.
Capital (PPS) Labor (%) Energy (toe) GDP (PPS)
Mean Std. Dev. Mean Std. Dev. Mean Std. Dev. Mean Std. Dev.
2009 4253.8 1106.1 0.91 0.04 3.35 1.13 21069.2 6260.1
2010 4230.8 1134.1 0.90 0.04 3.47 1.30 21961.5 6510.4
2011 4357.7 1222.2 0.90 0.04 3.37 1.21 22646.2 6513.3
2012 4326.9 1272.0 0.89 0.05 3.31 1.18 23080.8 6460.0
2013 4264.0 1223.0 0.89 0.05 3.29 1.25 23344.0 6485.6
In the time span under study, the mean GDP per capita raised about 2% while energy per capita and labor usage decreased by 1.7% and 1.9%,
respectively, and the capital remained almost unchanged. In terms of stan-dard deviations, the higher values are observed with respect to capital,
energy used and GDP, which show that the countries are heterogeneous. The highest difference among countries is observed on the amount of
total energy used per capita which implies that European countries may have different energy strategies to support their economy.
5. Empirical results: DEA efficiency assessment
The technical efficiency for each country is assessed by model (1),
pro-duced taking into account the fundamental inputs (energy, labor and capital). The relative efficiency of a country in a given year is estimated
by comparison to the best practices observed during the period
ana-lysed, ranging from 2009 to 2013 years. Based on the inputs-output mix of the model, the CRS and VRS frontiers are very close, and the
CRS assumption is considered in the DEA model (Dyson, et al., 2001).
These efficiency estimates provide insights into potential improvements
by taking into account statistical inference derived through bootstrap-ping framework.
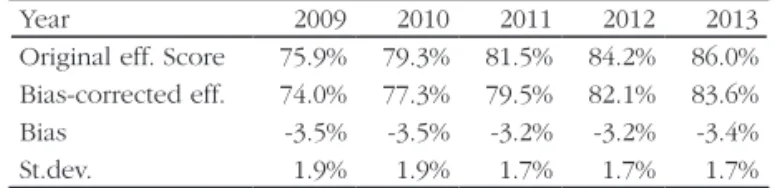
The correction of the DEA efficiency estimates for bias, has been performed by using 2000 bootstrap samples. Table 2 summarizes results
for the technical efficiency, bias-corrected efficiency, standard error and bias. Bias-corrected efficiencies reveal that magnitude of the corrected
efficiencies are slight lower than the original efficiencies, although this
variation is small. As the absolute value of bias estimates are larger than the standard error estimates for each country, the bias-corrected efficiency
estimates are preferred to the original efficiencies, since they represent a more precise estimate of the true efficiency.
It is possible to conclude that since 2009 the bias-corrected efficiency of the economies increased approximately 13%, on average, which is a
relevant improvement. These results suggest that efforts regarding the energy policies developed in each country to follow 20-20-20 targets
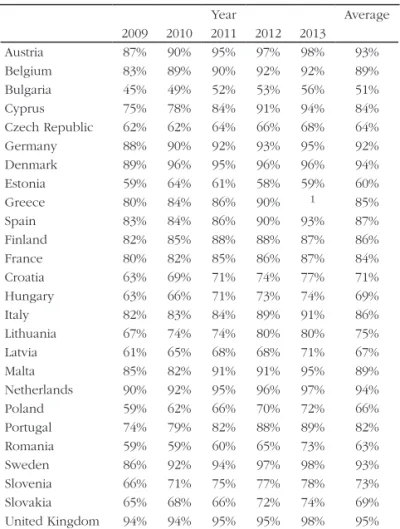
have not threatened the improvement of their efficiency. Looking now at the distribution of efficiency scores across countries, given in Table
3, it is observed that each country follows the same improvement trend as described above. Considering as benchmarks the countries that have
the bias-corrected efficiency equal or higher than 95%, Denmark was
the single benchmark in 2010, Austria, Netherlands and United Kingdom became benchmarks in 2011, Sweden has been established as benchmark
Table 2: Results of original and bootstrapped average efficiency estimates.
Year 2009 2010 2011 2012 2013
Original eff. Score 75.9% 79.3% 81.5% 84.2% 86.0% Bias-corrected eff. 74.0% 77.3% 79.5% 82.1% 83.6%
Bias -3.5% -3.5% -3.2% -3.2% -3.4%
St.dev. 1.9% 1.9% 1.7% 1.7% 1.7%
Considering the efficiency average from 2009 till 2013, it is also ob-served a stability on the performance of Denmark, Austria, Germany,
Netherlands, Sweden and United Kingdom (with average efficiency scores higher than 92%). Belgium, Cyprus, Spain, France, Italy, Finland, Malta and
Portugal have an average performance, presenting an efficiency ranging
from 82% to 89%. Cyprus has the highest increasing improvement, about 25%, followed by Portugal which efficiency has increased by 21%, over
the period analysed. Finally, Bulgaria, Czech Republic, Estonia, Hungary, Latvia, Poland, Romania, Slovakia, Croatia, Lithuania and Slovenia have
an efficiency ranging from 51% and 75%. In this group, Lithuania has the highest efficiency (75%).
From this group, Bulgaria, Romania, Lithuania, Poland and Croatia have the highest increasing improvement in efficiency, over 20%. Bulgaria
presents the lowest average efficiency, 51%, although it has improved the efficiency by 26% during the study period. Also noteworthy is the fact
that Estonia, with an average efficiency equal to 60%, did not improve its efficiency in the considered time period.
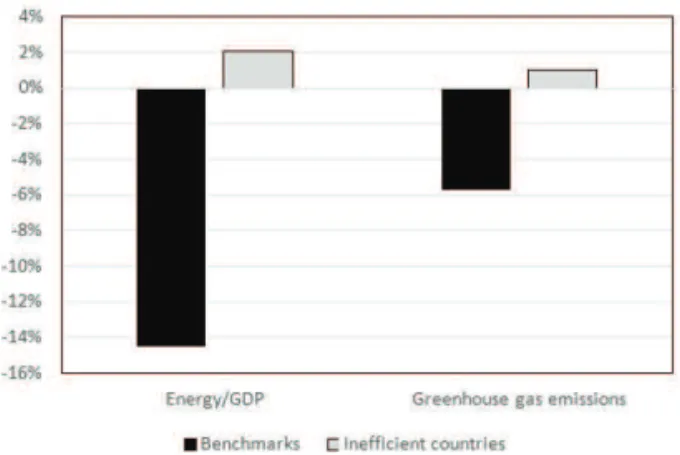
Regarding the efficiency scores levels observed in the last year of the
time period, 2013, we compare benchmarks with inefficient countries, us-ing similar number of units in each group, i.e., benchmarks are Denmark,
Austria, Netherlands, United Kingdom, Sweden and Germany and inef-ficient countries under analysis are Bulgaria, Czech Republic, Estonia,
Latvia, Poland and Romania. Figure 1 shows that inefficient countries have about 55% of the GDP per capita observed in the benchmarks, but
the same reduction percentage is not observed on the resources: labor is similar for the two groups, but the inefficient countries require more
Table 3: Bias-corrected efficiency scores across countries and time span.
Year Average
2009 2010 2011 2012 2013
Austria 87% 90% 95% 97% 98% 93%
Belgium 83% 89% 90% 92% 92% 89%
Bulgaria 45% 49% 52% 53% 56% 51%
Cyprus 75% 78% 84% 91% 94% 84%
Czech Republic 62% 62% 64% 66% 68% 64%
Germany 88% 90% 92% 93% 95% 92%
Denmark 89% 96% 95% 96% 96% 94%
Estonia 59% 64% 61% 58% 59% 60%
Greece 80% 84% 86% 90% 1 85%
Spain 83% 84% 86% 90% 93% 87%
Finland 82% 85% 88% 88% 87% 86%
France 80% 82% 85% 86% 87% 84%
Croatia 63% 69% 71% 74% 77% 71%
Hungary 63% 66% 71% 73% 74% 69%
Italy 82% 83% 84% 89% 91% 86%
Lithuania 67% 74% 74% 80% 80% 75%
Latvia 61% 65% 68% 68% 71% 67%
Malta 85% 82% 91% 91% 95% 89%
Netherlands 90% 92% 95% 96% 97% 94%
Poland 59% 62% 66% 70% 72% 66%
Portugal 74% 79% 82% 88% 89% 82%
Romania 59% 59% 60% 65% 73% 63%
Sweden 86% 92% 94% 97% 98% 93%
Slovenia 66% 71% 75% 77% 78% 73%
Slovakia 65% 68% 66% 72% 74% 69%
United Kingdom 94% 94% 95% 95% 98% 95%
1Data is not available.
Figure 1: Benchmarks and inefficient countries comparison in 2013.
In order to investigate the implementation of the energy policy,
following analysis explores the energy efficiency associated with economic efficiency and greenhouse gas emissions in terms of their average rate
in the study period for the two groups previously defined (benchmarks
and inefficient countries). The greenhouse gas emissions are measured by the ratio between energy related greenhouse gas emissions (carbon
dioxide, methane and nitrous oxide) and gross inland energy consumption. Considering the results obtained, presented in Figure 2, it is possible to
conclude that benchmarks have developed a higher effort in reducing greenhouse gases emissions and have decreased the amount of energy
used to produce one unit of economic activity (energy used per unit of GDP). Thus, the DEA model reflects in great extent the energy efficiency
promoted by European energy policy.
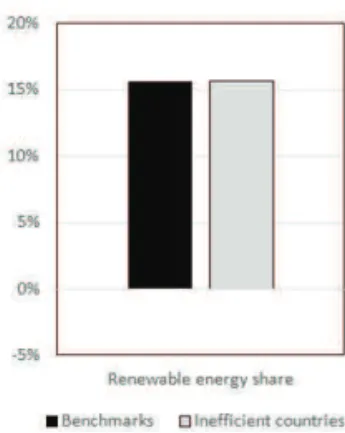
Regarding the other target, the penetration of renewables energies
in the total energy consumption, based on the results for the latest year
under analysis (2013 year), it is observed that both groups have devel-oped similar efforts in increasing the renewable energy share of the
total energy consumption (Figure 3). Specifically, there are found good and bad performers concerning the exploitation of renewable energy in
both groups.
Figure 2: Comparison of the average rate of Energy efficiency and greenhouse gas emissions for benchmarks and inefficient countries
Figure 3: Renewable energy share for benchmarks and inefficient countries, in 2013.
Further, we explore the relationship between the targets regarding
renewable energy share and the greenhouse gas emissions on the efficiency levels of European countries. This analysis also includes the
electricity prices charged to final consumers measured by €/kWh. In
some cases, because of financial constraints imposed by high energy prices, consumers may decrease their energy consumption through a
reduction in their energy services. Such reductions do not necessarily result in increased overall energy efficiency of the economy. Nevertheless,
energy prices assess an output of the energy system observed in each economy.
This evaluation is performed using truncated regression with bootstrap-ping (Simar, Wilson, 2007), formulated according to (2). The model uses
the bias-corrected efficiency for country i, in year t, as the dependent variable, and as regressors variables related to amount of renewable
ener-gy used, the greenhouse gas emissions and electricity prices observed in each country. Due to the use of a panel data truncated model, the year
is also used as dummy variable to control the time effect (the reference
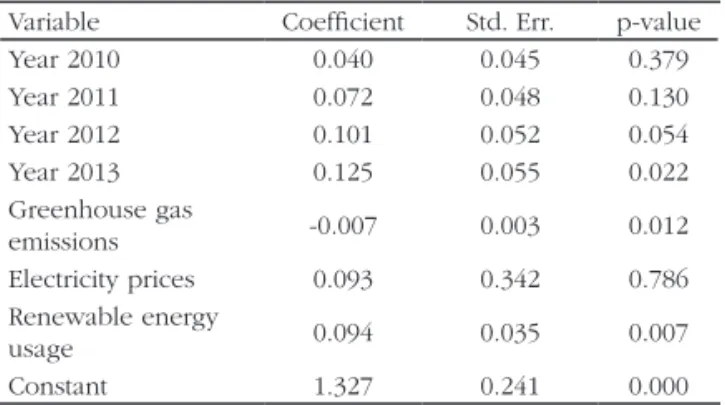
Table 4: Truncated regression analysis results.
Variable Coefficient Std. Err. p-value
Year 2010 0.040 0.045 0.379
Year 2011 0.072 0.048 0.130
Year 2012 0.101 0.052 0.054
Year 2013 0.125 0.055 0.022
Greenhouse gas
emissions -0.007 0.003 0.012
Electricity prices 0.093 0.342 0.786
Renewable energy
usage 0.094 0.035 0.007
Constant 1.327 0.241 0.000
Table 4 summarizes the results from the panel data truncated model in terms of coefficients, standard errors and p-values. The total number
of observations was 129. The truncated regression model is statistically
significant (χ2 Test with p-value equal to 0.0008), with a pseudo R2 equal to 0.17. From the obtained results, it is possible to confirm that countries
increased significantly the efficiency level from 2012 (at 10% level of sig-nificance). Apparently, the electricity prices increase with the efficiency
level, although this effect is not significant. It is observed a negative and significant coefficient for the greenhouse gas emissions, meaning that the
most efficient countries have lower levels of greenhouse gas emissions. The opposite occurs concerning the amount of renewable energy used which
has a positive and significant impact on the efficiency of the economies. The most efficient countries use higher levels of renewable energy. Thus,
it is possible to increase the share of renewable energy among total energy supply without deteriorating the technical efficiency of the economies,
which is in agreement with the findings by Chien and Hu (2007).
6. Conclusions
This study proposes a DEA framework to assess the technical efficien-cy of 26 European countries from 2009 till 2013. In order to fulfil some
to explore the impact of the usage of renewable energy, the greenhouse gas emissions and the electricity prices on the efficiency estimates. This
analysis is performed through the suitable bootstrap framework (Simar,
Wilson, 1998; 2007) to obtain statistical inferences on efficiency estimates derived from DEA models.
It is possible to conclude that since 2009 the bias-corrected efficiency of the economies increased approximately 13%, on average, which is a
relevant improvement. Three groups were identified taking into account the bias-corrected efficiency. The benchmarks are Denmark, Austria,
Netherlands and United Kingdom, Sweden and Germany which have the bias-corrected efficiency equal or higher than 95%. The medium
performers are Belgium, Cyprus, Spain, France, Italy, Finland, Malta and Portugal, presenting an efficiency ranging from 82% to 89%. The inefficient
countries are Bulgaria, Czech Republic, Estonia, Hungary, Latvia, Poland,
Romania, Slovakia, Croatia, Lithuania and Slovenia with an efficiency ranging from 51% to 75%.
Comparing the benchmarks with the lowest inefficient countries, by using similar number of units in each group, we investigate the
imple-mentation of the energy policy, concerning the attainment of 20-20-20 targets, imposed to EU countries. It emerges clearly that benchmarks
have developed a higher effort in reducing greenhouse gases emissions and have decreased the amount of energy used to produce one unit
of economic output, since 2009. Therefore, the DEA model reflects in great extent the energy efficiency promoted by European energy policy.
Regarding the penetration of renewables energies in the total energy consumption observed in 2013, it is observed that both groups have
developed similar efforts in increasing the renewable energy share of
the total energy consumption. Specifically, there are found good and bad performers concerning the exploitation of renewable energy in both
groups.
Regarding the relationship between the efficiency levels of the EU
economies and the targets on renewable energy share and greenhouse gas emissions, it is observed that the most efficient countries have lower
Concerning the effect of electricity prices on the efficiency estimates, results are not significant.
Based on the results achieved, we can conclude that the efforts
regard-ing the energy policies developed in each country to follow 20-20-20 targets, have not threatened the improvement of its technical efficiency.
In future developments, we propose to extend the methodology to incorporate other countries, to assess their performance concerning the
sustainable and environmentally friendlier development. Other perspec-tive can be to model other factors than can affect the energy efficiency
of the economies.
References
Boyd, Gale A.; Pang, Joseph X.; (2000). Estimating the linkage between energy efficiency and productivity. Energy Policy. Vol. 28(May 2000). pp. 289-296.
Charnes, A.; Cooper, W. W.; Rhodes, E.; (1978). Measuring the efficiency of decision making units. European Journal of Operational Research. Vol. 2, n.º 6. pp. 429-444.
Chien, Taichen; Hu, Jin-Li; (2007). Renewable energy and macroeconomic efficiency of OECD and non-OECD economies. Energy Policy. Vol. 35( July 2007). pp. 3606-3615.
Dyson, R. G., et al.; (2001). Pitfalls and protocols in DEA. European Journal of Operational Research. Vol. 132( July 16, 2001). pp. 245-259.
Efron, B.; (1979). Bootstrap Methods: Another Look at the Jackknife. The Annals of Statistics. Vol. 7, n.º 1. pp. 1-26.
EU; (2009). Directive 2009/28/EC of the European Parliament and of the Council of 23 April 2009 on the promotion of the use of energy from renewable sources. Official Journal of the European Union. pp. L 140/16: L140/62.
Hu, Jin-Li; Kao, Chih-Hung; (2007). Efficient energy-saving targets for APEC economies. Energy Policy. Vol. 35( January 2007). pp. 373-382.
Hu, Jin-Li; Wang, Shih-Chuan; (2006). Total-factor energy efficiency of regions in China. Energy Policy. Vol. 34(November 2006). pp. 3206-3217.
Khademvatani, Asgar; Gordon, Daniel V.; (2013). A marginal measure of energy efficiency: The shadow value. Energy Economics. Vol. 38( July 2013). pp. 153-159.
Menegaki, Angeliki N.; (2013). Growth and renewable energy in Europe: Benchmarking with data envelopment analysis. Renewable Energy. Vol. 60(December 2013). pp. 363-369.
Silverman, B. W.; (1986). Density Estimation for Statistics and Data Analysis. London: Chapman and Hall.
Simar, L.; Wilson, P.W.; (2007). Estimation and inference in two-stage, semi-parametric models of production processes. Journal of Econometrics. Vol. 136(2007). pp. 31-64.
WEC; (2008). Energy Efficiency Policies around the World: Review and Evaluation. World Energy Council. Available from: http://www.worldenergy.org/
Wilson, Paul W.; (2008). FEAR: A software package for frontier efficiency analysis with R. Socio-Economic Planning Sciences. Vol. 42(December 2008). pp. 247-254.
Zhang, Xing-Ping, et al.; (2011). Total-factor energy efficiency in developing countries. Energy Policy. Vol. 39(February 2011). pp. 644-650.
Zhou, P.; Ang, B. W.; Poh, K. L.; (2008). A survey of data envelopment analysis in energy and environmental studies. European Journal of Operational Research. Vol. 189(August 16, 2008). pp. 1-18.
Série Investigação
•
Imprensa da Universidade de Coimbra
Coimbra University Press