Doi: https://doi.org/10.25186/.v15i.1754
Spatial dynamics of coffee production in the state of Parana, Brazil
Marina Ronchesel Ribeiro1 , Talita Pijus Ponce1 , Tiago Santos Telles1
1Instituto de Desenvolvimento Rural do Paraná, Londrina, PR, Brasil
Contact authors: [email protected], [email protected], [email protected] Received in April 23, 2020 and approved in June 30, 2020
ABSTRACT
Coffee is a commodity of great economic importance for Brazil and for the state of Paraná. In the 1960s and 1970s, Paraná was responsible for half of coffee production in Brazil. However, after 1975, with the occurrence of what was called the “black frost” (geada negra), there was considerable reduction in the area devoted to coffee growing in Paraná. In this context, the aim of this study was to examine the spatial dynamics of coffee production in Paraná, identifying the microregions that have specialized in the activity, and analyze the evolution and spatial distribution of production in the period from 2003 to 2018. To do so, the locational quotient (LQ) method was applied, principal component analysis (PCA) was performed, and cluster analysis was carried out. A reduction in planted area and of the amount of coffee produced in Paraná was found. The results of the LQ denote changes in the spatial dynamics of coffee production, with reduction from 14 to 9 microregions specializing in the activity, and they are concentrated in the North Central and Northeast of Paraná. Two principal components that explained 88.06% of the total variability of the data were identified: the first formed by microregions with high participation in rural credit, and the second by microregions near the processing industries. Four groups were defined based on their degree of specialization, rural credit, and location of coffee industries. This trajectory implies gains in yield and reinforces the importance of investments in technology as a determining factor in development of the coffee production chain.
Key words: Regional analysis; agricultural economics; value chain; technological change; structural transformation.
1 INTRODUCTION
Coffee is one of the most consumed beverages in the world, it has a great economic importance and it is among the most exported commodities by Brazil (Thomé; Ferreira, 2015; Volsi et al., 2019). The country’s historical and economic formation is linked to coffee growing, an activity that was introduced in the national territory in the first half of the nineteen century, allowing the expansion of agricultural borders in the southern Brazil (Nicholls, 1970; Schulze; Fischer, 2019). Due to edaphic and climatic conditions that favor the crop, the states of Minas Gerais, Espírito Santo and São Paulo currently constitute the main production areas (Saraiva et al., 2018). Paraná, for its part, is the sixth largest coffee producer in Brazil (Instituto Brasileiro de Geografia e Estatística – IBGE, 2019a).
The development of coffee growing in the state of Paraná occurred along with expansion of the crop throughout Brazilian territory, beginning in the Vale do Paraíba, in Rio de Janeiro. In similar way that occurred in a manner similar to that which occurred in other regions of the country, coffee growing arrived in Paraná from the search for fertile land to broaden production. In the 1960s and 1970s, Paraná was responsible for around 50% of coffee production in Brazil. However, after 1975, with the occurrence of what was called the “black frost” (geada negra), there was a crisis in coffee growing in Paraná, with considerable reduction in coffee growing areas (Robusti; Zapparoli; Santoro, 2017). Since then, the organization and spatial distribution of coffee plantations had undergone changes, whether by replacing the areas with soybeans, corn, wheat and sugar cane, considered more profitable (Shikida;
Souza, 2009), or because of edaphic and climatic questions, since in certain regions, production was seen as unviable due to the risks involved. According to Assad et al. (2004), the climate conditions of Paraná shifted and reduced the size of production areas over time, affecting the entire coffee production chain.
Considering these changes, there is a need for detailed description of the spatial dynamics of coffee production and of the coffee value chain in Paraná over time. Given the significance coffee has held for Paraná, it is important to characterize its spatial distribution as well as to map coffee growing activity in its microregions in recent years, identifying the new dynamics and geographic distribution of this economic activity. Such information allows better understanding of these occurrences and the regional and temporal dynamics that have implications for the development of this activity within Paraná. The results are fundamental for directing public activity in regard to production, planning within the territory, storage, transport, commercialization of harvests and products derived from coffee growing, and credit and technical support programs (research, development and innovation, and rural extension). Thus, regional analysis is used to understand the spatial dynamics of the coffee producing regions in space and time.
The changes in the agricultural activity have profound impacts on the (re) organization of the territory, resulting in new spatial arrangements (Rocha; Parré, 2009). Among them, we highlight those related to agribusiness globalized areas chosen to receive the most significant productive investments in the sector, that represent its most competitive areas (Elias, 2011).
The aim of this study was to examine the spatial dynamics of coffee production in Paraná, identifying the microregions that specialize in the activity, and its evolution over time.
2 MATERIAL AND METHODS
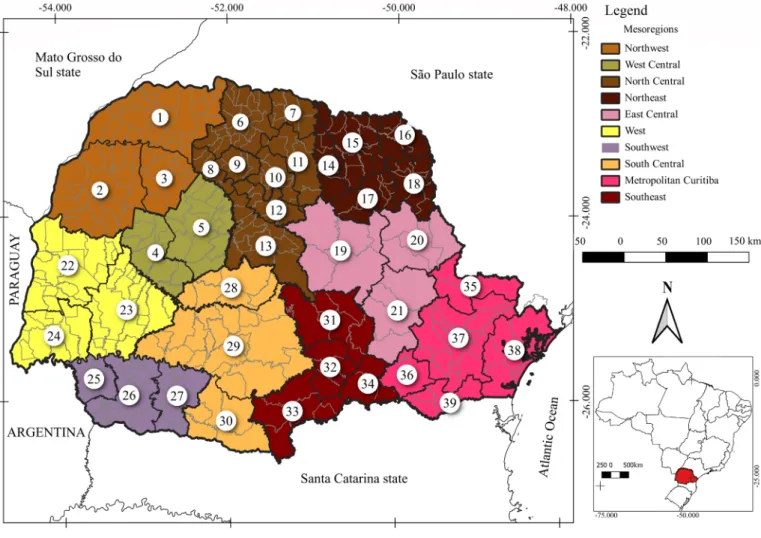
Analyses included the 39 microregions of the state of Paraná, distributed in 10 mesoregions, as defined by the Instituto Brasileiro de Geografia e Estatística (Geography and Statistics Institute of Brazil) - IBGE (Figure 1). Data on coffee growing from Municipal Agricultural Production (Produção Agrícola Municipal - PAM) were used, which were made available by the IBGE in reference to the years 2003 to 2018. In addition, data from the Programa Nacional de Fortalecimento da Agricultura Familiar (PRONAF), from the Programa Nacional de Apoio ao Médio Produtor Rural (PRONAMP), from general purpose credit, and from the Fundo de Defesa da Economia Cafeeira (FUNCAFÉ) made available by the Banco Central do Brasil
(BCB) for the years 2013 to 2018 were used for analysis of rural credit contracts regarding maintenance of the coffee crop.
To identify the microregions of Paraná specialized in coffee growing, the locational quotient (LQ) was used. The LQ identifies the production specialization of a determined location and eliminates the statistical noise originating from regions of different sizes. This index indicates specialization or diversification of the production structure of a region in a determined period. To reduce possible effects generated by seasonality in coffee production, the LQ was calculated based on mean values of the gross value of crop and livestock production (valor bruto da produção agropecuária - VBP) in periods corresponding to two biennia, in this case from 2003 to 2006, 2007 to 2010, 2011 to 2014, and 2015 to 2018. Thus, each period corresponds to two biennia. The reason for this is that coffee growing in Brazil is subject to an effect called biennality, a two-year cycle in which the coffee plant has high yield and, in the following year, has reduced production, due to the need for recomposition of the plant (Aparecido; Rolim, 2018).
Figure 1: Mesoregions and microregions of the state of Paraná.
Source: based on the Brazilian Institute of Geography and Statistics (Instituto Brasileiro de Geografia e Estatística - IBGEa). Notes: Microrregions: 1. Paranavaí. 2. Umuarama. 3. Cianorte. 4. Goioerê. 5. Campo Mourão. 6. Astorga. 7 – Porecatu. 8. Floraí. 9. Maringá. 10. Apucarana. 11. Londrina. 12. Faxinal. 13. Ivaiporã. 14. Assaí. 15. Cornélio Procópio. 16. Jacarezinho. 17. Ibaiti. 18. Wenceslau Braz. 19. Telêmaco Borba. 20. Jaguariaíva. 21. Ponta Grossa. 22. Toledo. 23. Cascavel. 24. Foz do Iguaçu. 25. Capanema. 26. Francisco Beltrão. 27. Pato Branco. 28. Pitanga. 29. Guarapuava. 30. Palmas. 31. Prudentópolis. 32. Irati. 33. União da Vitória. 34. São Mateus do Sul. 35. Cerro Azul. 36. Lapa. 37. Curitiba. 38. Paranaguá. 39. Rio Negro.
The LQ was determined from the proportion between the VBP of coffee and the total VBP of agricultural activity, composed of the sum of the VBP of perennial and annual crops permanent and temporary crops, as expressed in Equation 1 (Isserman, 1977):
QL, credit directed to agricultural activity (PRONAF, PRONAMP, FUNCAFÉ and credit without bond), and the number of coffee factories and roasters. Cluster analysis was performed based on PCA using the Ward method, considering the degree of similarity between the microregions specialized in coffee growing. This technique allows variables to be placed in homogeneous groups, according to a measurement of similarity or of distance (Volsi et al., 2019).
Data was adjusted for inflation based on the broad consumer price index (Índice de Preço ao Consumidor Amplo - IPCA) for December 2019; analyses were performed on the SPSS software, and maps were created using the ArcGIS 10.2 software.
3 RESULTS AND DISCUSSION
Considering the effect of biennality on coffee production, the area harvested in Paraná in the mean of the years 2003 and 2004 was 121 thousand ha, whereas the mean in the years 2017 and 2018 was 39 thousand ha, i.e., a reduction of 67.77%. Coffee production in the mean of the years 2003 and 2004 was 132.5 thousand tons, and that of the years 2017 and 2018 was 66 thousand tons, which represents a reduction of 50.19% (Figure 2). However, there was an increase in yield, since in the mean of the years 2003 and 2004, 1.10 tons of coffee were produced per hectare, but yield reached the level of 1.67 tons per hectare in the mean of 2017 and 2018, which corresponds to yield gains in the order of 1.36% per year in the period (Table 1).
It should be noted that yield gains in coffee growing in Parana were affected by transformations related to modernization of agriculture promoted by public policies that offered credit and technical assistance, backed by technologies generated by research. The results of research led to more efficient use of inputs and refinement of management techniques – such as irrigation, fertilization, and pruning; to development of cultivars resistant or tolerant to pests and diseases; and to selection of materials with greater vegetative vigor (Moda-Cirino et al., i j j i E E QL E E (1)
where Eij is the VBP of coffee in microregion j, Ej is the total VBP of agriculture in microregion j, Ei is the VBP of coffee in the state of Paraná, and E is the total VBP of agriculture in the state of Paraná. In other words, the numerator of the equation corresponds to the division between production from coffee activity of the microregion and the total from agriculture of the same microregion, whereas the denominator corresponds to the division between production from coffee activity in Paraná and the total agricultural production of the state. If the result obtained is greater than 1, then it is assumed that there is specialization of the activity in the microregion in question. In contrast, the microregions that have LQ < 1 are considered not to be specialized in the activity. Thus, the greater the LQ, the greater the specialization of the microregion in coffee growing.
Once the specialized micro-regions were defined, the principal component analysis (PCA) was carried out. In accordance with Telles et al. (2020), PCA considers total variance in the dataset and finds a linear combination of observed variables that maximizes total explained variance. If the variables are highly correlated, they are combined into a factor, or component, that can explain a larger portion of the variance in the sample. The second component will explain the second largest amount of variance and will be uncorrelated with the first, and so on. The following variables were considered:
Figure 2: Harvested area in hectares (ha) and amount produced in thousands of tons (Mg) of coffee in the state of Paraná in the
period from 2003 to 2018.
Source: based on the data of Municipal Agricultural Production (Produção Agrícola Municipal - PAM) of the Brazilian Institute of Geography and Statistics (Instituto Brasileiro de Geografia e Estatística - IBGE).
2012; Nogueira et al., 2005). In that sense, research, expressed in technological innovations, can be considered a relevant factor for the increase in yield (Voigt-Gair et al., 2013).
Another important point for improvement of coffee yield in Paraná stems from the edaphic and climatic conditions of the main coffee producing microregions in the state, which have conditions favorable to coffee growing. Coffee growers in the state of Parana are dedicated to production of Coffea
arabica L. type coffee (Volsi et al., 2019), which, according
to Andrade et al. (2012), is a species originating from regions with altitudes above 900 meters, and coffee in Paraná is under conditions similar to those found in its location of origin, Ethiopia. The areas with this characteristic altitude, as reported in the agricultural climate zones for coffee (Assad et al., 2004), i.e., the microregions most suited to coffee growing, are concentrated in the Northeast and North Central mesoregions, which have a mean altitude of 500 to 900 meters (Andrade et al., 2012). In this regard, the microregions of Maringá, Apucarana, Jacarezinho, Ibaiti, and Wenceslau Braz exhibit the best coffee yields in Paraná (Table 1). Moreover, these microregions had mean yield above that observed for Paraná in the period from 2003 to 2018.
In this context, it is important to realize that the spatial changes in coffee growing in Paraná, on the one hand,
represented an expressive reduction in crop area and total production, but, on the other hand, coffee growing increasingly occurs in regions more suitable for development of the crop, which ends up generating greater efficiency and profitability in coffee growing in Paraná.
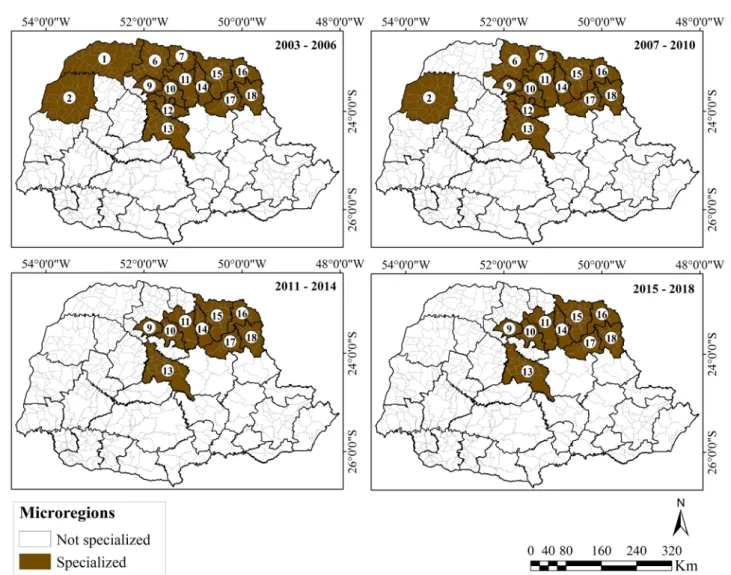
Analysis of the spatial dynamics of agriculture in Paraná shows that coffee lost representation. The LQ indicates reduction in the number of microregions specialized in coffee production in Paraná (Figure 3). There were 14 microregions specialized in coffee growing in the period of 2003 to 2006, 13 in the period of 2007 to 2010, 9 in the period of 2011 to 2014, and, once more, 9 microregions in the period of 2015 to 2018. Comparison of the first and the last periods shows that microregions of Paranavaí, Umuarama, Astorga, Porecatu, and Faxinal no longer continued to be specialized in coffee production.
It is noteworthy that the microregions of Paranavaí and Umuarama encountered difficulties in recovering coffee fields after 1975 (the time of extensive hard frosts) and later, after 2007, when there was an outbreak of pests (coffee leaf miner and nematodes) in the coffee fields. In these microregions, where there are areas of occurrence of Caiuá Sandstone (bringing about medium texture soils, i.e., more sandy), coffee fields were replaced with planted pastures and some perennial crops (Hofer et al., 2013), such as mulberry, orange, and annual crops, such as cassava, and sugarcane.
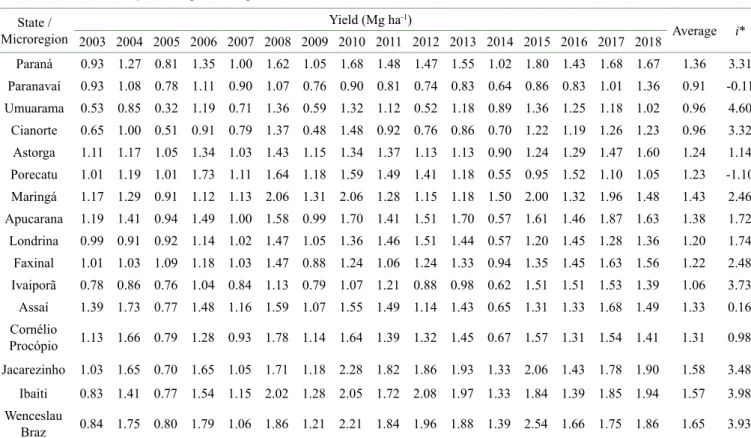
Table 1: Yield of coffee producing microregions in sate of Paraná, Brazil, from 2003 to 2018. State / Microregion Yield (Mg ha-1) Average i* 2003 2004 2005 2006 2007 2008 2009 2010 2011 2012 2013 2014 2015 2016 2017 2018 Paraná 0.93 1.27 0.81 1.35 1.00 1.62 1.05 1.68 1.48 1.47 1.55 1.02 1.80 1.43 1.68 1.67 1.36 3.31 Paranavaí 0.93 1.08 0.78 1.11 0.90 1.07 0.76 0.90 0.81 0.74 0.83 0.64 0.86 0.83 1.01 1.36 0.91 -0.11 Umuarama 0.53 0.85 0.32 1.19 0.71 1.36 0.59 1.32 1.12 0.52 1.18 0.89 1.36 1.25 1.18 1.02 0.96 4.60 Cianorte 0.65 1.00 0.51 0.91 0.79 1.37 0.48 1.48 0.92 0.76 0.86 0.70 1.22 1.19 1.26 1.23 0.96 3.32 Astorga 1.11 1.17 1.05 1.34 1.03 1.43 1.15 1.34 1.37 1.13 1.13 0.90 1.24 1.29 1.47 1.60 1.24 1.14 Porecatu 1.01 1.19 1.01 1.73 1.11 1.64 1.18 1.59 1.49 1.41 1.18 0.55 0.95 1.52 1.10 1.05 1.23 -1.10 Maringá 1.17 1.29 0.91 1.12 1.13 2.06 1.31 2.06 1.28 1.15 1.18 1.50 2.00 1.32 1.96 1.48 1.43 2.46 Apucarana 1.19 1.41 0.94 1.49 1.00 1.58 0.99 1.70 1.41 1.51 1.70 0.57 1.61 1.46 1.87 1.63 1.38 1.72 Londrina 0.99 0.91 0.92 1.14 1.02 1.47 1.05 1.36 1.46 1.51 1.44 0.57 1.20 1.45 1.28 1.36 1.20 1.74 Faxinal 1.01 1.03 1.09 1.18 1.03 1.47 0.88 1.24 1.06 1.24 1.33 0.94 1.35 1.45 1.63 1.56 1.22 2.48 Ivaiporã 0.78 0.86 0.76 1.04 0.84 1.13 0.79 1.07 1.21 0.88 0.98 0.62 1.51 1.51 1.53 1.39 1.06 3.73 Assaí 1.39 1.73 0.77 1.48 1.16 1.59 1.07 1.55 1.49 1.14 1.43 0.65 1.31 1.33 1.68 1.49 1.33 0.16 Cornélio Procópio 1.13 1.66 0.79 1.28 0.93 1.78 1.14 1.64 1.39 1.32 1.45 0.67 1.57 1.31 1.54 1.41 1.31 0.98 Jacarezinho 1.03 1.65 0.70 1.65 1.05 1.71 1.18 2.28 1.82 1.86 1.93 1.33 2.06 1.43 1.78 1.90 1.58 3.48 Ibaiti 0.83 1.41 0.77 1.54 1.15 2.02 1.28 2.05 1.72 2.08 1.97 1.33 1.84 1.39 1.85 1.94 1.57 3.98 Wenceslau Braz 0.84 1.75 0.80 1.79 1.06 1.86 1.21 2.21 1.84 1.96 1.88 1.39 2.54 1.66 1.75 1.86 1.65 3.93
Source: based on data from the Municipal Agricultural Production (Produção Agrícola Municipal - PAM), of the Instituto Brasileiro de Geografia e Estatística (IBGEa).
Figure 3: Microregions of the state of Paraná specialized in coffee production in the periods of 2003 to 2006, 2007 to 2010, 2011 to 2014, and 2015 to 2018.
Source: based on the data from the Municipal Agricultural Production (Produção Agrícola Municipal - PAM) of the Instituto Brasileiro de Geografia e Estatística (IBGEa). Notes - 01: Paranavaí. 02: Umuarama. 03: Cianorte. 06: Astorga. 07: Porecatu. 09: Maringá. 10: Apucarana. 11: Londrina. 12: Faxinal. 13: Ivaiporã. 14: Assaí. 15: Cornélio Procópio. 16: Jacarezinho. 17: Ibaiti. 18: Wenceslau Braz.
In the microregions of Astorga, Porecatu, and Faxinal, also affected by the extensive hard frosts of 1975, there was gradual change in land use and occupation – the properties that had produced coffee came to produce especially sugarcane, as it is better adapted to the specific edaphic and climatic conditions and has greater profitability (Shikida; Souza, 2009).
Thus, a spatial change occurred in coffee production in Paraná, with shifting of the specialized microregions from the Northwest to the Northeast. Furthermore, the results denote spatial concentration of coffee growing microregions in the Northeast of Paraná. The microregions of Ibaiti and Wenceslau Braz, for example, are the only specialized microregions of Paraná that are important in Brazilian coffee growing (Volsi et al., 2019).
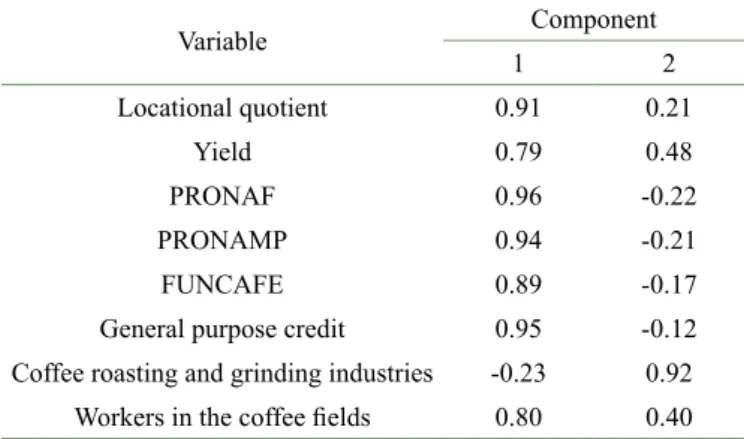
The PCA shows the formation of two principal components that together explain 88.06% of the total variability of the data (Table 2, Figure 4). Component 1 was positively correlated with LQ, PRONAF, PRONAMP, FUNCAFÉ,
general purpose credit, and workers in the coffee fields. It is composed of microregions that have a higher LQ, higher yield, and a stronger relationship with financing sources for small, medium, and large coffee producers, and that have greater participation of workers in the fields. Component 2, for its part, correlated positively with coffee roasting and grinding industries and is related to the specialized microregions that concentrate coffee processing industries (Londrina, Apucarana and Jacarezinho).
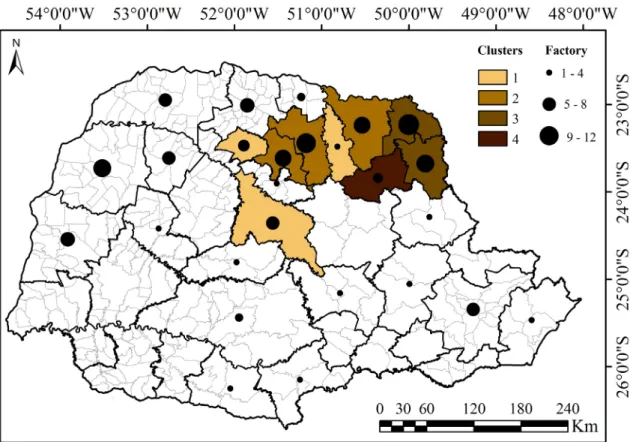
From cluster analysis, four groups of microregions specialized in coffee production were identified (Figure 5); these groups were formed according to specialization in coffee production, number of roasting and grinding industries, the amount and type of rural credit provided to producers, and the number of workers in coffee fields. The first and second groups were composed by three microregions, the third by two, and the fourth by only one microregion.
Table 2: Principal component analysis (PCA) in the period of 2015-2018. Variable Component 1 2 Locational quotient 0.91 0.21 Yield 0.79 0.48 PRONAF 0.96 -0.22 PRONAMP 0.94 -0.21 FUNCAFE 0.89 -0.17
General purpose credit 0.95 -0.12
Coffee roasting and grinding industries -0.23 0.92
Workers in the coffee fields 0.80 0.40
Notes: PRONAF: Programa Nacional de Fortalecimento da Agricultura Familiar. PRONAMP: Programa Nacional de Apoio ao Médio Produtor Rural, and FUNCAFÉ: Fundo de Defesa da Economia Cafeeira.
Figure 4: Principal component analysis (PCA) of the microregions specialized in coffee production in the state of Paraná, mean
of the period of 2015-2018.
Notes: indicates the microregions specialized in coffee production. indicates the variables LQ: locational quotient. PROD: yield. TRAB: workers in the coffee crop. IND: coffee roasting and grinding industries. PRONAF: Programa Nacional de Fortalecimento da Agricultura Familiar. PRONAMP: Programa Nacional de Apoio ao Médio Produtor Rural. CV: general purpose credit. and FUNCAFÉ: Fundo de Defesa da Economia Cafeeira.
Group 1 is formed by the microregions Maringá, Ivaiporã, and Assaí. Its main characteristic is use of PRONAF (24.47%) and of PRONAMP (19.22%). Group 2 is formed by the microregions Apucarana, Londrina, and Cornélio Procópio. This group is characterized by
regions that received expressive quantities of credit in the FUNCAFÉ modality, 40.02% of the total, and general purpose credit, 30.05% of the total. Production in these regions is highly technified. These regions concentrate 44.26% of the coffee processing industries; Cacique and Café Iguaçu are most prominent. They stand out in production and export of soluble coffee. In addition, they registered the greatest number of workers in the coffee crop, around 31% of the total. Group 3, composed of the microregions Wenceslau Braz and Jacarezinho, is characterized by concentrating regions with a high index of specialization and technification. Group 4 is represented by the microregion Ibaiti, which had the highest LQ (20.12), i.e., the highest index of specialization in coffee growing, as well as the best indicators of production and technification and positive relation with all the modalities of rural credit.
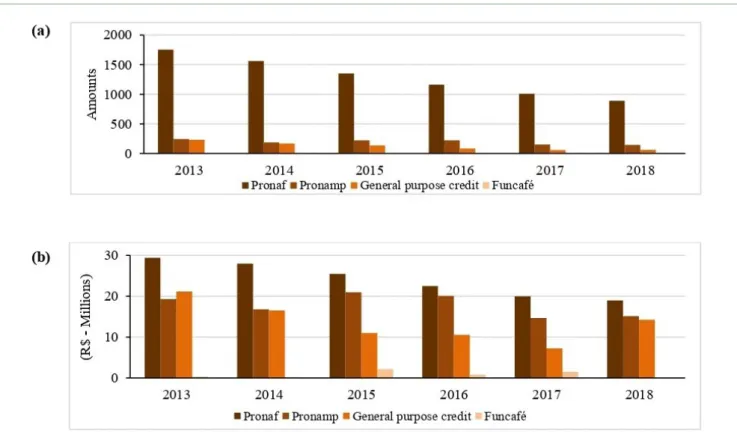
In relation to rural credit, which is an important variable in analyses regarding the dynamics of the agricultural sector, a decline is observed in the volume of maintenance contracts (Figure 6). This decline, which was expected, is closely associated with reduction in the number of agricultural establishments dedicated to coffee growing in Paraná. In
2006, there were 20,488 agricultural establishments dedicated to coffee growing in the state of Paraná (IBGE, 2019b), and in 2017, only 11,694 (IBGE, 2019c), a reduction of 42.93%. In 2018, the total number of agricultural contracts was 1,094, with 81.26% linked to PRONAF, 13.25% to PRONAMP, and 5.48% to general purpose credit. FUNCAFÉ1 was not
represented among the modalities contracted (Figure 6a). Most of the maintenance contracts of the state come from PRONAF. In 2013, the number of contracts was 1,754, and in 2018, it was 889, representing a decrease of approximately 51% in the period.
In relation to values in Brazilian reals (US$) of rural credit provided for maintenance of coffee production in the state of Paraná from 2013 to 2018, the amount made available by PRONAF and by general purpose credit remained constant, whereas the amount made available by PRONAMP increased, passing from US$ 14.12 million in 2013 to US$ 15.14 million in 2018 (Figure 6b).
Figure 5: Clusters of the specialized microregions in coffee production and location of the coffee processing industries in Paraná in the period from 2015-2018.
1FUNCAFÉ makes lines of credit available for maintenance and storage, Financing for
Acquisition of Coffee (FAC), recovery of coffee fields, and working capital for industries and cooperatives. In this respect, there was no acquisition of any of the lines of mainte-nance credit in 2018 in the state of Paraná.
The results suggest that there was a transformation in the coffee production systems, and the specialized microregions came to be concentrated in the North Central and Northeast regions of Paraná.
The coffee agricultural market in Paraná is passing through a structural change, coming to focus on quality. With that comes an emphasis on specialty coffees, which are distinguished from conventional coffees through attributes of quality, related to specific characteristics such as origin, variety, color, and size, or otherwise linked to questions of an environmental and social nature, the mode of production or working conditions (Nunes et al., 2013; Scholz et al., 2013). Specialty coffees consist of sources of value for strategies of differentiation (Barra; Ladeira, 2016; Guimarães et al., 2019).
In 2012, the North East region of Paraná received Geographic Indication (GI) for specialty coffee. This GI is registration granted to products or services whose recognition and reputation are tied to their geographic origin, whether by edaphic and climatic conditions of a determined region or by traditions and typical know-how that do not allow them to be reproduced in another location (Schmidt; Saes; Monteiro, 2014).
Therefore, specific strategic efforts, such as GI and regional strategies of differentiation, quality labels, traceability, and environmental labels, should be considered key elements for coffee producers to improve their merchandise aiming at final consumers (Caldarelli; Gilio; Zilberman, 2018). These institutional efforts need to focus on streamlining and technifying local production, and in attention to value redistribution at the farm (or farm worker) level (Grabs; Ponte, 2019). Such strategies allow improved development of these microregions specialized in coffee growing.
4 CONCLUSIONS
From 2003 to 2018, there was yield gain in the coffee crop in the state of Paraná of 1.36% a year. Such gains are associated with technological innovations and with specialization to areas more favorable in terms of edaphic and climatic conditions.
There was a transformation in coffee production systems. A decrease in the number of microregions of Paraná specialized in coffee production is observed, passing from 14 in the period of 2003-2006 to 9 in the period of 2015-2018.
The microregions specialized in coffee production are concentrated in the North Central and Northeast regions of Paraná, and are differentiated into four groups. The
main characteristic of group one (Maringá, Ivaiporã, and Assaí) is participation in all lines of credit, together with the second and fourth group. The microregions belonging to the third group (Wenceslau Braz and Jacarezinho) and fourth group (Ibaiti) are characterized by the high value of coffee production in the state. The microregions belonging to the second group (Apucarana, Londrina, and Cornélio Procópio) have the greatest concentration of roasting and grinding industries.
Harvested area and coffee production in Paraná declined by 69.18% and 44.44%, respectively. However, spatial changes in coffee growing in Paraná to more appropriate regions were fitting, generating greater efficiency and profitability in the activity.
5 ACKNOWLEDGMENTS
Our thanks to the Fundo Paraná of the Superintendência Geral de Ciência, Tecnologia e Ensino Superior (SETI) of the state of Paraná, for financial support.
6 REFERENCES
ANDRADE, G. A. et al. Agroclimatic zoning of robusta coffee in the State of Paraná and impacts of climate change. Semina: Ciências Agrárias, 33(4):1381-1390, 2012.
Figure 6: (a) Number of contracts and (b) Values of rural credit contracts for maintenance of coffee production by type of program, from 2013 to 2018.
APARECIDO, L. E. O.; ROLIM, G. S. Forecasting of the annual yield of Arabic coffee using water deficiency. Pesquisa Agropecuária Brasileira, 53(12):1299-1310, 2018. ASSAD, E. D. et al. Impacto das mudanças climáticas no
zoneamento agroclimático do café no Brasil. Pesquisa Agropecuária Brasileira, 39(11):1057-1064, 2004. BARRA, G. M. J.; LADEIRA, M. B. Teorias institucionais
aplicadas aos estudos de sistemas agroindustriais no contexto do agronegócio café: uma análise conceitual. REGE - Revista de Gestão, 23(2):159-171, 2016. CALDARELLI, C. E.; GILIO, L.; ZILBERMAN, D. The
coffee market in Brazil: Challenges and policy guidelines. Revista de Economia, 39(69):1-21, 2018.
ELIAS, D. Agronegócio e novas regionalizações no Brasil. Revista Brasileira de Estudos Urbanos e Regionais, 13(2):153-167, 2011.
GRABS, J.; PONTE, S. The Evolution of power in the global coffee value chain and production network. Journal of Economic Geography, 19(4):803-828, 2019.
GUIMARÃES, E. R. et al. The brandnew Brazilian specialty coffee market. Journal of Food Products Marketing, 25(1):49-71, 2019.
HOFER, E. et al. Relação de cointegração entre as diferenças de base nos preços do café pagos aos produtores nos principais núcleos regionais do Estado do Paraná. Custos e Agronegócio, 9(2):152-172, 2013.
INSTITUTO BRASILEIRO DE GEOGRAFIA E
ESTATÍSTICA – IBGE. Pesquisa Agrícola Municipal. Available in: <http://www.sidra.ibge.gov.br/>. Access in: September, 10, 2019a.
INSTITUTO BRASILEIRO DE GEOGRAFIA E
ESTATÍSTICA – IBGE. Instituto Brasileiro de Geografia e Estatística. Censo agropecuário 2006. Available in: <https://sidra.ibge.gov.br/>. Access in: October, 31, 2019b.
INSTITUTO BRASILEIRO DE GEOGRAFIA E
ESTATÍSTICA – IBGE. Instituto Brasileiro de Geografia e Estatística. Censo agropecuário 2017. Available in: <https://sidra.ibge.gov.br/>. Access in: October, 31, 2019c. ISSERMAN, A. The location quotient approach to estimating
regional economic impacts. Journal of the American Planning Association, 43(1):33-41, 1977.
MODA-CIRINO, V. et al. Plant breeding at Instituto Agronômico do Paraná: IAPAR. Crop Breeding and Applied Biotechnology, 12:25-30, 2012.
NICHOLLS, W. H. The agricultural frontier in modern Brazilian history: The state of Parana, 1920-65. Revista Brasileira de Economia, 24(4):64-92, 1970.
NOGUEIRA, A. M. et al. Avaliação da produtividade e vigor vegetativo de linhagens das cultivares catuaí vermelho e catuaí amarelo (Coffea arabica L.) plantadas individualmente e em diferentes combinações. Ciência e Agrotecnologia, 29(1):27-33, 2005.
NUNES, R. et al. Incentives to differentiation strategies for Brazilian coffee producers. Revista de Economia e Administração, 12(2):165-179, 2013.
ROBUSTI, E. A.; ZAPPAROLI, I. D.; SANTORO, P. H. Café arborizado no estado do Paraná, Brasil: indicadores financeiros e interferências ambientais, 2012-2014. Agroalimentaria, 23(44):79-91, 2017.
ROCHA, C. B.; PARRÉ, J. L. Estudo da distribuição espacial do setor agropecuário do Rio Grande do Sul. Revista Análise Econômica, 27(52):139-160, 2009.
SARAIVA, C. E. A. B. et al. Competitividade da cafeicultura brasileira. Revista de Política Agrícola, 27(3):9-16, 2018. SCHMIDT, C. M.; SAES, M. S. M.; MONTEIRO, G. F. A. Value
creation and value appropriation in networks: an empirical analysis of the role of geographical indication in the wine industry in Vale dos Vinhedos, RS, Brazil. Organizações Rurais & Agroindustriais, 16(3):343-62, 2014.
SCHOLZ, M. B. S. et al. Sensory attributes and physico-chemical characteristics of the coffee beverage from the IAPAR cultivars. Coffee Science, 8(1):5-14, 2013. SCHULZE, F. A.; FISCHER, G. B. Brazilian history as
global history. Bulletin of Latin American Research, 38(4):408-422, 2019.
SHIKIDA, P. F. A.; SOUZA, E. C. Agroindústria canavieira e crescimento econômico local. Revista de Economia e Sociologia Rural, 47(3):569-600, 2009.
THOMÉ, K. M.; FERREIRA, L. S. Competitividade e estrutura de mercado internacional de café: Análise de 2003 a 2012. Coffee Science, 10(2):184-194, 2015. TELLES, T. S. et al. Milk production systems in Southern
Brazil. Anais da Academia Brasileira de Ciências, 92(1):e20180852, 2020.
VOIGT-GAIR, L. et al. A dinâmica do concurso “Café Qualidade Paraná” na produção de cafés especiais. Semina: Ciências Agrárias, 34(6):3173-3180, 2013. VOLSI, B. et al. The dynamics of coffee production in Brazil.