(Annals of the Brazilian Academy of Sciences)
Printed version ISSN 0001-3765 / Online version ISSN 1678-2690 www.scielo.br/aabc
Implementation of a geographic information system (GIS) for the planning of beekeeping in the west region of Paraná
SIMONE C. CAMARGO1, REGINA C. GARCIA1, ARMIN FEIDEN1, EDMAR S. DE VASCONCELOS1, BRUNO G. PIRES2, ALCEU M. HARTLEBEN1, FERNANDA J. DE MORAES1, LUAN DE OLIVEIRA1, JUYVERSON GIASSON1, EDUARDO S. MITTANCK1, JEFERSON R. GREMASCHI1 and DIANA J. PEREIRA1
1
Centro de Ciências Agrárias/ UNIOESTE, Caixa Postal 91, 85960-000 Marechal Cândido Rondon, PR, Brasil
2
Centro de Ciências Biológicas e da Saúde/ UNIOESTE, Caixa Postal 701, 85819-110 Cascavel, PR, Brasil
Manuscript received on July 9, 2013; accepted for publication on January 17, 2014 ABSTRACT
This study aimed to develop a Geographic Information System (GIS), for storage of information and geographic location of apiaries in eight counties in western Paraná; study the local flora; the land used; and the honey productivity in the harvest of 2010 in two of these areas: Marechal Cândido Rondon and Santa Helena. In order to do so we used the software SPRING, delimiting a radius of action of bees of three kilometers around the apiaries. We interviewed and registered 126 beekeepers with 383 apiaries. By using the images we selected areas with greater and lower overlap of hives in Marechal Cândido Rondon (144 and 44 hives, respectively) and Santa Helena (165 and 40 hives, respectively), in a three kilometers radius, selecting 15 colonies in each area, for the study of the parameters cited. In the multivariate analysis of the grouping, five groups were formed, by their similarity of management, indicating the higher average production in the hives of the most populated area of Santa Helena and lower average production in the most populated of Marechal Cândido Rondon. The grouping of hives, the differences in the production of honey and floristic survey indicated that these differences could be associated with management, floristic and climatic differences recorded in the period of production, in the areas studied.
Key words: biodiversity, biosecurity, grouping, honey, planning.
Correspondence to: Regina Conceição Garcia E-mail: [email protected]
INTRODUCTION
Honey is a natural product of bees that may have its origin in the nectar of flowers (floral honey), secretions of living parts of plants or excretions of the same sucking insects (honeydew honey), which bees find, collect, transform and store in the combs of the hive (Crane 1985, Di Marco et al. 2012).
Today, Brazil stands out in honey production, occupying the 11th position in the world ranking
(Silva 2011). The Brazilian region that produces the most honey is to the south, representing 42% of the total production of Brazil. The state of Paraná is the 2nd largest national producer, with a production of 4,831 tons in 2009; of which western Paraná produced 950 tonnes, representing 20% of the total production of Paraná (IBGE 2009).
This success in the production of Brazilian honey is due to the biodiversity of the flora, the hardiness of the bees and the characteristics of the climate (Nogueira-Couto and Couto 2006, Komatsu et al. 2002).
Furthermore, the amount of honey that a bee colony can produce depends on other environ-mental factors, such as equipment and appropriate management, as well as the fundamental practice of rational beekeeping (Vilela 2000).
For a good performance and the development of hives a good bee pasture is needed (Wolff et al. 2006). Therefore, a detailed assessment of the vegetation around the apiary is essential, taking into account not only the species identification of honey, but also the population densities and the flowering periods (Rubio 1976).
One strategy to increase honey production is the mapping of the apiaries along with the assessment of land use and vegetation cover surrounding the apiaries. With the use of a GIS (Geographic Information System), the selection of the best location for the installation of the apiaries is facilitated, avoiding competition between clusters for the same bloom.
Studies on the production, composition and geographic characterisation of honey from the apiaries can be used for the improvement of Brazilian apiculture.
This study aimed to develop a general methodology, through the use of a Geographic Information System (GIS), which allows the storage of information and the geographic location of apiaries in eight counties in western Paraná, as well as the use of GIS for the evaluation of the effect of overcrowding of hives, its management, the local flora and land use on the quantitative and qualitative production of honey and the ability to support areas in the counties of Marechal Cândido Rondon and St. Helena.
MATERIALS AND METHODS
GEOGRAPHICAL INFORMATION
The study area included apiaries located in the counties: Diamante do Oeste (24°57'06'' S and 54°06'13'' W-GR), Entre Rios do Oeste (24°42'16" S
and 54°14'03" W-GR), Marechal Candido Rondon (24°33'22" S and 54°03'24" W-GR), Matelândia (25°14'32'' S and 53°58'54'' W-GR), Missal (25°05'04'' S and 54°14'49'' W-GR), Pato Bragado (24°37'40'' S and 54°13'33'' W-GR), Santa Helena (24°51'37" S and 54°19'58" W-GR), and Terra Roxa (24°09'25'' S and 54°06'02'' W-GR), in zone 21, which has an altitude of 400m. The coordinates are related to SIRGAS Datum 2000.
For conducting the research involving honey production of Apis mellifera Linn. and the carrying capacity of the area, two municipalities in the west of Paraná, Santa Helena (SH) and Marechal Cândido Rondon (MCR) were selected, because they presented the greatest number of geo-referenced apiaries. The climate of the municipalities were classified according to Köppen (1948): the Cfa type is humid subtropical, mesothermal, with hot summers, infrequent frosts, with a tendency toward a concentration of rain in the summer months and no definite dry season, and an annual rainfall of 1600mm. The average annual temperature is 21°C, with an average minimum of 15°C and maximum of 28°C.
The relief was placed on the third plateau of Paraná, with the predominant characteristic of flattened down (Maack 2002).
The vegetation of the municipality in question was designated by Veloso et al. (1991) as being a semideciduous forest (alternative names: Subtropical Rain Forest, Tropical Forest, or Forest of the Interior Highlands). According to Maack (2002), this is the same vegetation that covers much of the territory of Paraná, especially in western and northern portions of the state.
The topology of MCR has predominantly characteristics of mild wavy relief (60%), as well as wavy (30%) and strong wave (10%). With regard to soil conditions, the area consists of clayey soils due to its origin of basalt, being found soil of the type eutrophic Oxisol, Alfisol and eutrophic Udorthent (EMBRAPA 2006).
Meteorological data (precipitation, temperature and relative humidity) in the MCR municipality were obtained from the automatic meteorological station of this city, while the data from SH were obtained from the Meteorological System of Paraná (SIMEPAR).
The research began by conducting a survey of the geographical locations of apiaries in the municipa-lities, along with a registry of beekeepers, containing the following personal data: name, phone number, address, Social Security number (Registration of natural person) and RG (Registrar General); as well as data on the apiaries: number of hives, the number of apiaries, data management and total production of honey, wax and propolis from last year.
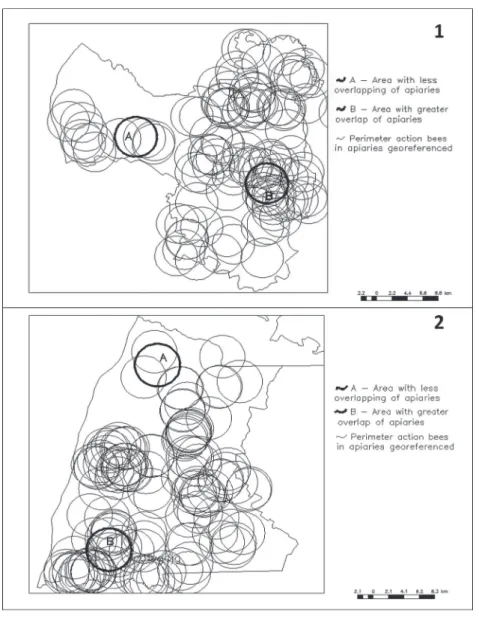
To survey the geographic locations of apiaries, the Global Positioning System (GPS), Garmin Etrex unit was used; points were Mapsource downloaded to the program, to convert the DXF file, and the information was then incorporated into a GIS file and systematised in a database. In the construction of GIS, for processing georeferenced information were used a software developed by the National Institute for Space Research (INPE-SPRING 2008), and current geo-referenced images. Around the point of the apiaries a radius of three Kilometers was drawn to demarcate the area of action of the bees (Figure 1).
After the end of the development of the GIS, it was possible to identify regions with a high concentration of apiaries and others with low concentrations, both in MCR and SH. As the saturation of hives in one location can affect the production of honey, two areas were chosen in each city: a feature with little overlap of the
apiary and another with high overlap, resulting in four areas to be evaluated, which were marked by a circle with a three Kilometers radius, as shown in Figure 1.
With the help of the database the owners of the beekeeper hives could be identified, with leased areas demarcated in order to choose 15 hives in each area. This totalled 60 hives, which were geo-referenced to include the quantity of honey produced, and accompanied by the extractions made on the harvest of 2010.
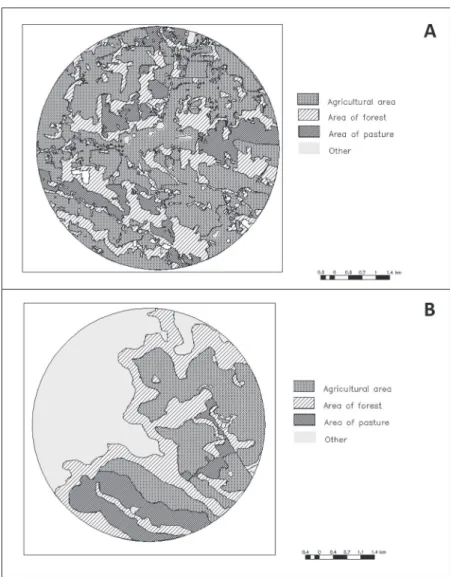
With the hives geo-referenced individually, it was possible to study the use and occupation of land within a radius of three Kilometers around each hive, using a colour composition in the picture of Red, Green and Blue (RGB), which provided a good characterisation and differentiation , defining four classes: forest (secondary forest), agriculture, grazing and other (water, buildings, bare soil, etc..), as shown in the examples of hives from MCR and SH, respectively (Figure 2).
It was also possible to determine the existing percentage of each class, to analyse the characte-ristics of the surroundings of each hive, and to consider the effects of the variables, which were evaluated with regards to the quantity and quality of honey. It was also possible to quantify the number of hives using the same foraging area for each colony studied, which was also considered a variable.
RATINGS OF HONEY
Measures were recorded, as were the amounts of supers and frames from each hive. Each was marked with ink (nest and honey super) and then taken to the local property used for the extraction of honey, where supers were weighed using a digital scale before and after centrifugation, so as to obtain an estimated production for the hive.
In each extraction, an average of 200g of honey samples were collected from each colony, placed in clear plastic jars with screw caps and then taken to the laboratory of Food Technology, State University
of Western Paraná, Campus MCR (UNIOESTE-MCR). They were stored at room temperature and then subjected to physical and chemical analyses.
The analysis of the parameters corresponding to the physicochemical characteristics of honey was performed according to the official methodology of Instruction No. 11, Oct. 20 (MAPA 2000).
The humidity was determined by refraction, in accordance with Association of Official Analytical Chemists - AOAC (2000) method, using an ABBE bench-top refractometer.
For pH, acidity, ash and colour analyzes of honey samples, the methods cited by Marchini et al. (2004) were used.
FLORISTIC SURVEY
For the floristic survey, the method of rectangular plots of fixed area of 5 x 20m was used (Cullen Junior et al. 2003), including 10 randomly allocated plots in each area, totalling 1.000m2 sampled.
Botanical materials were collected in the reproductive phase, which were herbalised according to standard techniques (Fidalgo and Bononi 1989).
Samples were collected monthly from Nov. 2010 to Oct. 2011, and all the material was deposited in the Herbarium of UNIOESTE-MCR. The presentation of the list of families was based on Cronquist (1988), with the exception of Leguminosae, in which the treatment was adopted by Barroso et al. (2002).
For the classification of species we adopted the definition of the Herbarium of the Federal Technological University of Paraná (HCF). The classification stages in succession were made according to Reitz et al. (1978, 1983) and Roderjan et al. (2002).
For analysis of plant diversity in the areas studied, the Simpson's Reciprocal Index was used, which emphasises the most abundant species, with a higher Index value signifying a greater diversity found (Larsen 1996). The Index is calculated by the formula 1/D, where D:
D =
S
p2
∑
i i ‒ 1In which: S = total number of species in the community (richness), i = ith species, and Pi = the proportion of the community (abundance) which belongs to the ith species.
STATISTICAL ANALYZES
To evaluate the similarity between the colonies studied, the following variables were used: production of honey; the hive volume; area of the table; quantities of frames and supers; exchange of wax; exchange of queen; bee feeding; percentage of areas of forest, cropland and pasture used in a three Kilometers radius around the hive; number of hives and apiaries in the same range; the last number of months of last crop until the current crop and the physicochemical characteristics: moisture, pH, acidity, ash and colour.
The data collected in the first extraction of honey from 60 hives were considered for statistical analyzes. In 21 of these there was a subsequent extraction, whose data were also analyzed separately. We carried out an analysis in order for the data of the total production of the hives 2010 harvest.
Data were analysed by multivariate analysis with the software GENES (Cruz 2006), using the technique of cluster analysis to identify the similarities between the variables. Cluster analysis aimed to organize the sample units into groups in order to obtain homogeneity within the group, but there was heterogeneity among the groups (Cruz and Regazzi 1994, Johnson and Wichern 1992).
The results were expressed as a "dendrogram" (or tree diagram). The grouping used was UPGMA (Unweighted Pair-Group Method using an
Arithmetic Average), which is also known as the method of averages of distances. The groups were assembled into a new group when the mean distance between its elements was minimal. A group was defined as being a set of individuals in which each has more similarities, on average, with all of the members of that group than all of the elements of any other group (Reis 1997).
RESULTS AND DISCUSSION
In the eight counties studied, 126 beekeepers and 383 apiaries were registered, which were distributed throughout the eight municipalities, and farmers were classified according to the number of hives as either: small (5 to 20 colonies), medium (21 to 50 hives) or large (more than 50 hives), comprising 46%, 29% and 25%, respectively, of the total registered producers. The total production of these beekeepers in the year 2009 was 86,291 kg, and 9%, 20% and 71% of honey was produced by small, medium and large producers, respectively. As for the extraction of honey, of 126 beekeepers registered 23% use centrifugal stainless steel, 39% use non-stainless steel centrifugal, 6% let drain the honey of combs and 32% squeeze the combs; 82% use filter and 37% use decanter.
In the county of MCR, one of the counties selected for the study, 114 apiaries including 1,661 beehives belonging to 68 beekeepers were geo-coded, with a mean of 14.57 and 24.42 hives per apiary hive per farmer.
In the area of greatest overlap of apiaries in that district, 144 colonies were observed in the 14 apiaries distributed, i.e. an average of 10.28 hives per apiary, while in the lower area of overlap, with the same radius, 44 colonies were observed in 5 apiaries, making an average of 8.8 hives per apiary.
each producer had 2.63 times more hives than the producers in MCR, which was important with respect to the management of hives.
The area of greatest overlap of apiaries, a radius of three Kilometers in SH, showed 165 colonies in 12 apiaries distributed as an average of 13.75 hives per beekeeper apiary, which belonged to three farmers, while the lower area of overlap, with the same radius, had 40 hives in two apiaries, an average of 20 hives per apiary belonging to two beekeepers. It is observed that, although the area had a larger number of colonies per apiary, the overlap was lower due to the smaller number of apiaries.
FIRST EXTRACTION
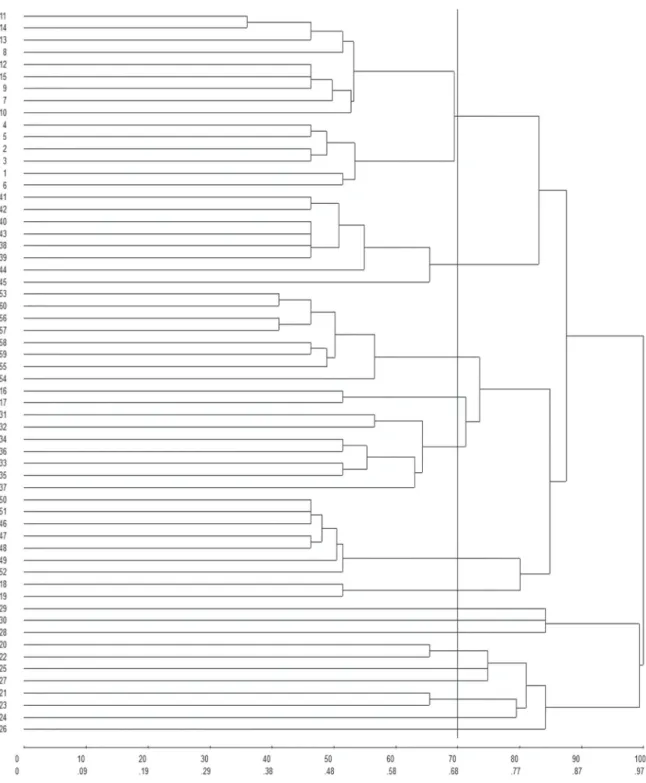
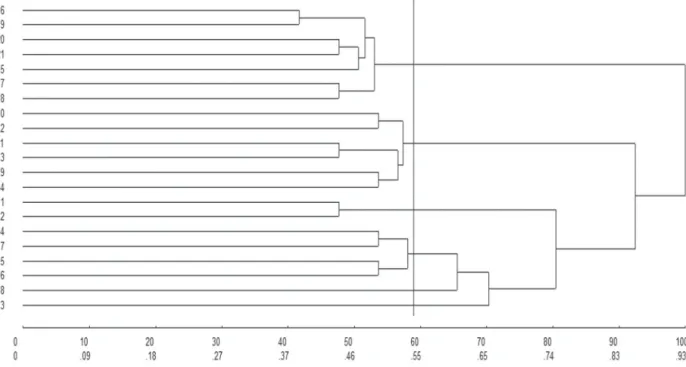
With respect to data collected in the first extraction of honey from hives, Figure 3 shows the dendrogram produced by cluster analysis using the mean Euclidean distance and UPGMA (Unweighted Pair-Group Method using an Arithmetic Average) method, involving 60 beehives and 20 variables. The point chosen for cutting was 0.68 of average distance between the groups, with 70% variation, represented by a vertical line in figure. Note the formation of the 16 groups.
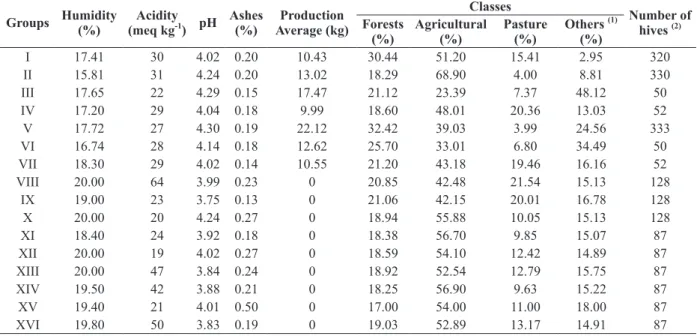
In the county of MCR, the 15 hives in the area with the highest concentration of hives were sorted into group I, indicating a greater similarity to the observed features. These colonies had an average yield of 10.43kg. The area had an average of 320 hives (Table I) and 30.44% were forests, 51.20% and 15.41% for agriculture and grazing available for foraging, respectively.
In the area of lower concentration, the 15 colonies evaluated formed 11 groups: IV, VII, and VIII to XVI. Group IV showed an average production of 9.99kg, and the area available for foraging was 18.60% of forests, 48.01% for agriculture and 20.36% for pasture. Group VII had a production of 10.55kg, with 21.20% of forest area, and 43.18% and 19.46% agricultural pasture. In both groups there were 52 colonies using the
same area. There were differences between these groups in the management, use and occupation, and group VII had the largest area of forest and farmland compared to group IV.
The hives that were part of groups VIII to XVI had zero production, due to the delay of the beekeeper extracting honey, with a loss of the 2010 harvest. Thus, it was only possible to study the use and occupation and analysis of the physicochemical parameters of honey (Table I). A difference in the physicochemical characteristics of honey of these groups was observed, particularly in acidity and ashes. The composition of the honey was directly related to the type of plant, the weather and environmental conditions (Serrano et al. 1994). Thus, the observed variations in physicochemical characteristics may be related to the botanical diversity of this area.
Honey production in the first collection was similar between the two areas of MCR. By analysing the use and occupation, there was a greater coverage of forest area in most hives, but when performing the calculation of diversity by Simpson's reciprocal index, this area had a lower diversity (13.0143) compared to the area under hives (14.3378). These areas of forest have been human-affected and, according to Victor (2000) and Fahrig (2003), when there is loss of vegetation, the diversity of plant species is negatively affected. Beekeeping is extremely dependent on plant resources for honey production, but the amount of vegetation cannot be considered in isolation to estimate the carrying capacity of an area; diversity also has fundamental influence on the availability of resources.
Figure 3 - Dendrogram obtained by cluster analysis using the mean Euclidean distance and the UPGMA method, for
measuring the output of the first collection of honey. Set of 20 variables in 60 honey samples of A. mellifera in the counties of Marechal Cândido Rondon and Santa Helena.
68.90%, respectively), and group V showed a mean forest area of 32.42% and an agricultural area of 39.01% (Table I).
natural resource management (Graymore et al. 2009, Amaral et al. 2009).
According to Dauber et al. (2003), the types of land use and land cover can be used as indicators of species richness. Agriculture contributes to environmental heterogeneity and the increased number of fragments, due to the clearing of natural areas (Tamme et al. 2010, Vuilleumier et al. 2011).
In the area with a lower density in SH, the 15 hives were also divided into two groups (III and VI). The average yield of Group III was greater than that of Group VI (17.47kg and 12.62kg, respectively), and the agricultural area of Group VI was superior to that of the group III. According to Brodschneider and Crailsheim (2010), in order for a colony to have good productivity it is necessary to balance their nutrition, such as the supply of carbohydrates, proteins, lipids, vitamins and minerals. However, due to monoculture, diversity has been reduced, affecting the nutrition of bees and consequently decreasing their production (Brodschneider et al. 2010).
SECOND EXTRACTION
Figure 4 shows the dendrogram produced by the mean Euclidean distance and the UPGMA method, involving 21 beehives and 20 variables. The point chosen for cutting is 0.66 of the average distance between the groups 71% variation, represented by a vertical line in figure. In this analysis, four main groups were formed.
In the area of lower density in the county of SH, only seven hives contained the second extraction of honey, all of which constituted group I, with an average production of 11.83kg (Table II). The mean areas of forest, agriculture and pasture were 26%, 33% and 7%, respectively.
In the higher density area of the county of SH, 12 hives were evaluated in this second extraction, which were groups II and IV, which showed an average yield of 10.42kg and 14.45kg, respectively. Group IV contained a larger area of bush (30%) and a lower agricultural area (45%) compared to Group II, which had 18% and 70% of the same areas, respectively. Groups Humidity
(%)
Acidity (meq kg-1) pH
Ashes (%)
Production Average (kg)
Classes
Number of hives (2) Forests
(%)
Agricultural (%)
Pasture (%)
Others (1) (%)
I 17.41 30 4.02 0.20 10.43 30.44 51.20 15.41 2.95 320
II 15.81 31 4.24 0.20 13.02 18.29 68.90 4.00 8.81 330
III 17.65 22 4.29 0.15 17.47 21.12 23.39 7.37 48.12 50
IV 17.20 29 4.04 0.18 9.99 18.60 48.01 20.36 13.03 52
V 17.72 27 4.30 0.19 22.12 32.42 39.03 3.99 24.56 333
VI 16.74 28 4.14 0.18 12.62 25.70 33.01 6.80 34.49 50
VII 18.30 29 4.02 0.14 10.55 21.20 43.18 19.46 16.16 52
VIII 20.00 64 3.99 0.23 0 20.85 42.48 21.54 15.13 128
IX 19.00 23 3.75 0.13 0 21.06 42.15 20.01 16.78 128
X 20.00 20 4.24 0.27 0 18.94 55.88 10.05 15.13 128
XI 18.40 24 3.92 0.18 0 18.38 56.70 9.85 15.07 87
XII 20.00 19 4.02 0.27 0 18.59 54.10 12.42 14.89 87
XIII 20.00 47 3.84 0.24 0 18.92 52.54 12.79 15.75 87
XIV 19.50 42 3.88 0.21 0 18.25 56.90 9.63 15.22 87
XV 19.40 21 4.01 0.50 0 17.00 54.00 11.00 18.00 87
XVI 19.80 50 3.83 0.19 0 19.03 52.89 13.17 14.91 87
TABLE I
Average results of physicochemical analyzes of honey samples, the use and occupation of the ground around the hives within a radius of three Kilometers
and the average data for production of the first extraction.
(1)
The difference in production between the groups may be related to the predominance of monoculture short cycles (soy and corn) planted in the region, which do not provide a continuous flow of nectar and pollen, and the reduced floristic diversity of the area which does not provide a good potential beekeeping.
The more saturated area of SH, even having 325 hives, could produce similar, and even a higher average production in this second collection, than the less saturated area with 50 hives. When performing the calculation of diversity by Simpson's reciprocal index, the first area showed the greatest diversity (15.0168), compared to the second area (5.8601), which gives the first area a higher potential beekeeping.
In the county of MCR, only two hives held the second collection, both belonging to the area that was less saturated. They formed group III, indicating a greater similarity between them, as to the characteristics observed. The average production of these hives was 7.91kg.
ALL EXTRACTIONS FROM THE 2010 HARVEST
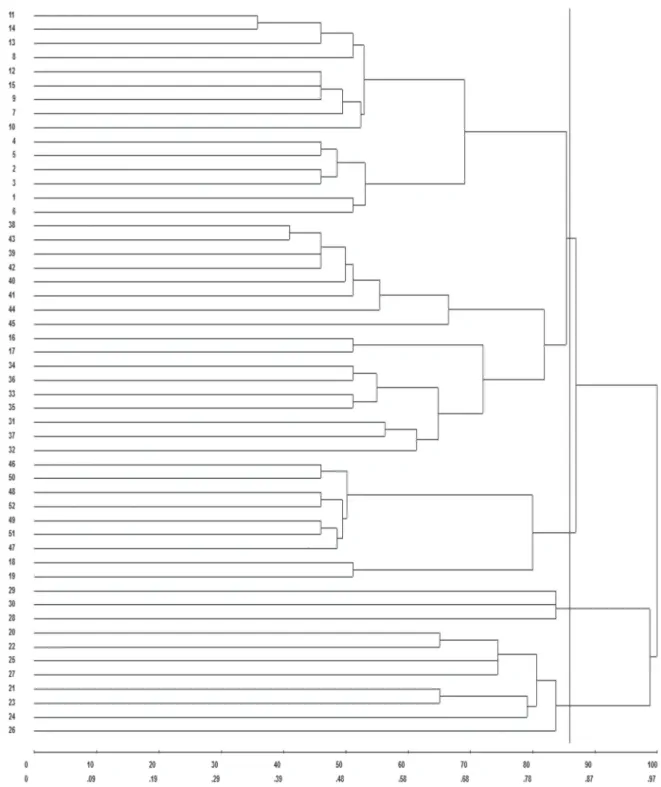
Figure 5 shows the dendrogram produced by the mean Euclidean distance UPGMA method, involving 52 beehives and 20 variables. The point chosen for cutting was 0.81 the average distance between the groups 84% variation, represented by a vertical line. Five groups of beehives were formed.
The 15 colonies evaluated in the area of highest density of MCR were grouped in Group I. The average yield obtained at the end of the season was 10.43kg, with the lowest production of the four areas studied. The managements of these colonies were the same, and a single extraction was performed during the harvest.
In the same county, in an area of less overlap, of the 15 colonies studied, three formed group IV and eight comprised group V. Both of these groups had zero production, due to the delay of the beekeeper in extracting honey, losing the 2010 harvest. These two groups differed in the number
Groups Humidity (%)
Acidity (meq.kg-1) pH
Ashes (%)
Production Average (kg)
Class
Number of hives (2) Forests
(%)
Agricultural (%)
Pasture (%)
Others(1) (%)
I 16 20 4.33 0.12 11.83 26 33 7 34 50
II 18 32 3.97 0.13 10.42 18 70 4 8 338
III 18 37 3.91 0.17 7.91 19 48 20 13 52
IV 16 23 4.36 0.12 15.15 39 26 2 33 384
V 17 22 4.35 0.15 12.25 27 53 5 15 321
VI 16 33 4.39 0.16 15.96 23 57 10 10 236
TABLE II
Average results of physicochemical analyzes of honey samples, the use and occupation of the ground around the hives within a radius of three Kilometers
and the average data for production of the second extraction.
(1)
Other - wetlands, buildings and bare soil, (2) Number of hives - which are in the same radius of action of hives in the study.
of colonies using the same area, with this number being higher in Group IV than in Group V (128 and 87, respectively).
Two hives of that area were grouped in group II, along with 15 hives in the area with the highest density of SH, with a mean of 27.41kg, which was the highest among the groups. Two other hives were grouped in Group III, along with seven hives evaluated in the less congested area of the city of SH, achieving an average production of 21.36kg. The similarity between the management of the hives, though they were from different areas, may have contributed to its inclusion in the group.
With the cluster analysis performed using the UPGMA algorithm, it was possible to regroup the hives, regarding the area where they were, the use and occupation of land and the production thereof.
Concerning the management, the hives where the exchange took place, wax, feeding bees in winter periods, the use of Langstroth hives and extracting more than one harvest, obtained a better performance. The beeswax bees save work, save time and maximise the amount of honey produced, as a bee consumes approximately 6 -7kg of honey to produce 1kg of wax, and prevent apiculture diseases (Barros et al. 2009).
In the absence of flowering, when the food reserve is insufficient for the colony, it is advisable to provide artificial feeding bees (Wiese 1986). The Langstroth hive is the one which best meets the
needs of the bees, respect the bee’s space, the position fixing of the frames and, the rational use of inner space of the hive (Nogueira-Couto and Couto 2006).
It was observed that the hives in which the beekeeper performed only one extraction of honey, produced a smaller amount in relation to those colonies that performed more samples (groups II and VI). According to Peldoza (1994), performing more than one extraction per year has advantages over a single crop, because the bees work harder when they have reserves of honey. Manrique (1995), when evaluating the production of honey, noted a 42.33% increase in honey production, when continuous extraction was performed.
Different productivities in different areas can be explained by the relationship between the productivity of swarms, climatic conditions and flora.
Figure 5 - Dendrogram obtained by cluster analysis using the mean Euclidean distance and the UPGMA method for the evaluation of the total production of honey. Set of 20 variables in 52 honey samples of A. mellifera in the counties of Marechal Cândido Rondon and Santa Helena.
Part of the difference in the average of production observed was due to the vegetation distribution, since both the survey of plants, as the
(15.0168), with 15 hives that produced more. The other major productions were two hives in the area of lower density in the municipality of MCR (14.3378).
The calculation of the index of diversity per se may not be directly related to honey production, but can be an effective tool to estimate the potential associated with this bee flora.
The low diversity observed in the area of least overlap of apiaries in the city of SH, due to the dominance of the species Leucaena leucocefala, Lam., accounted for 39.14% of the individuals in this area. In the west region of Paraná, Leucaena
was introduced during the reforestation of the protective strip from the Itaipu reservoir and Biological Sanctuary of SH (Moreira 1997). This species was inventoried by Marchini et al. (2001), and was found to be visited by A. mellifera
bees in two localities in the state of São Paulo (Piracicaba and Pindamonhangaba), being of interest in beekeeping and contributing to the production of honey.
The species L. leucocephala (leucaena), together with the species Psidium guajava Linn. (guava), Eriobotrya japonica Lindl. (loquat), and
Hovenia dulcis Thunb. (grape-Japan), are classified
as invasive species, according to Decree 125/2009 of the Environmental Institute of Paraná (IAP 2009). In the county of SH, in the area of highest concentration, L. leucocephala and P. guajava
were found, with a relative abundance of 0.07 and 0.02, respectively. In the same city, in the area of lower concentration, L. leucocephala, P. guajava,
E. japonica and H. dulcis were found, with relative abundances of 0.39, 0.02, 0.06, and 0.03, respectively. In the county of MCR, two invasive species were found: E. japonica and H. dulcis in the most saturated area, with relative abundances of 0.02 and 0.03, respectively.
Jacobus (F.J. Moraes et al. unpublished data) conducted analysis of pollen in honey samples also in the county of SH and found as dominant pollen type H. dulcis (Rhamnaceae) in 40% of the samples,
the remainder being classified as heterofloral. As pollen accessories we found Senecio sp. (Asteraceae),
P. rigida (Mimosaceae), type Myrcia (Myrtaceae)
Eucalyptus sp. (Myrtaceae), Glycine max (Fabaceae),
L. leucocephala (Mimosaceae), Zanthoxylum sp. (Rutaceae), type Palmae (Arecaceae). The author found pollen of Glycine max (soybean) as dominant pollen type in county of Terra Roxa, predominantly agricultural area in the west region of Paraná.
Sekine et al. (2013) studied the melliferous flora and pollen characterization of honey samples of A. mellifera in twocounties of the west region of Paraná, Ubiratã and Nova Aurora, that embraces rural areas with pastures, cultivated areas and forest remnants. It was observed that the honey collected in the region was heterofloral, the pollen types of cultivated crops were very representative and the dominant pollen were soybean (G. max) and
Eucalyptus spp. From 34 exotic species collected in the area of study, seven were classified as exotic invader species, among them the leucena (L. leucocephala) and grape-Japan (H. dulcis), however among the exotics, only the L. leucocephala,
Ricinus communis (mamona) and Melia azedarach
(santa-bárbara) were representative in the pollen spectrum of the honey collected in the region.
Sereia et al. (2011) analyzed and compared 17 honey samples, 11 organic and six non-organic
of the Paraná River, in nearby regions, the floristic composition of riparian recomposed in dammed portion differs from forest formation of the islands of the portion not dammed.
In non-organic honey, Sereia et al. (2011) classified 50.0% of the samples as multifloral, and 50.0% as unifloral. The unifloral non-organic honey presents pollen grains mainly from Myrtaceae (Eucalyptus sp.) and Mimosaceae (Anadenanthera peregrina). In the multi-floral kinds, pollen
grains were observed mainly from the families Euphorbiaceae (C. urucurana), Mimosaceae (A. peregrina) and Myrtaceae (Eucalyptus sp.), which proves the importance of these families as main sources of the nectar and pollen in Southwest Brazil.
Santos et al. (2011) studied the influence of the dynamics of use and vegetation cover in Cáceres, Mato Grosso, Brazil, in 2005, 2006, 2008 and 2009 on the diversity of honey plants and the influence both on the pollen types in honey, concluded that the most important plants in honey (three species) were not influenced by this dynamic, which caused little variation in disturbed areas and savanna. Perhaps the low stocking of hives in the area or the wide availability of these plants or floral fidelity bees may have contributed to this result.
According to Wilms et al. (1996), the highly eusocial honeybees, such as A. mellifera, collect resources preferentially from plants that exhibit a syndrome of mass flowering with numerous flowers opening over short periods of time; this feature can be observed in many crop plants and invasive species.
In the floristic survey of two urban areas of the municipality of MCR, 50 species were recorded in the area with the highest concentration of hives and 42 species in the area of the least overlap of apiaries, distributed as 24 and 20 families, respectively. The areas were characterized as having 66% of pioneer species, 25% early secondary, 3% late secondary and 6% secondary.
Comparing the two locations, 32 families and 15 species of plants were found. The families
Fabaceae (18%), Malvaceae (8%), Myrtaceae (8%),
Asteraceae (6%), Rutaceae (6%) and Sapindaceae
(6%), accounted for 52% of the species found in the area of higher saturation apiaries. The species
Paraptadenia rigida Benth. had the largest number of individuals in the area (21.45%). In another area, with lower concentrations of hives, the families
Fabaceae (21.43%), Asteraceae (7.14%),
Boraginaceae (7.14%), Malvaceae (7.14%) and
Sapindaceae (7.14%) represented approximately 50% of the wealth of the area. The species Eugenia
uniflora had the highest number of individuals in the area, representing 17%.
According to Pirani and Cortopassi-Laurino (1993), the family most visited by several species of social bees, including honeybees, was Compositae, which is classified today as Asteraceae and Leguminosae. The family Fabaceae showed the largest number of species in the studied areas, having already been reported by Viana et al. (2006), as one of the most important in terms of quantity in bee flora of an area of restinga in Bahia, and Carvalho and Marchini (1999), and an ecotone between deciduous forest, savanna and dense rain forest in the county of Castro Alves, Bahia.
Of the total species identified, 95% are native and 5% are exotic. Among them, introduced species, cultivated in the vicinity of apiaries are of economic importance, such as G. max.
In the floristic survey of two urban areas of the city of SH, 50 species were recorded in the area of greatest overlap of apiaries and 51 species in the area of least overlap apiaries, distributed among 22 and 27 families, respectively. The area was characterised by pioneer species (71%), 15% early secondary, 2% late secondary and 12% secondary.
Comparing the two locations, 19 families and 34 species of plants were coincident. The families
Fabaceae (12%), Lauraceae (10%), Myrtaceae
(6%) and Sapindaceae (6%), represented the most species found in areas of high saturation apiaries (58%). The species Parapiptadenia rigid had the highest number of individuals in the area (12%). In the other, the families Lauraceae (10%), Fabaceae (8%),
Malvaceae (8%), Myrtaceae (8%), Poaceae (6%) and
Rutaceae (6%), represented about 46% of the species. The species L. leucacephala had the highest number of individuals in the area, representing 39%.
Families such as Fabaceae and Myrtaceae
were identified by Salome and Orth (2004) in the state of Santa Catarina, with the largest number of plant species being important to the bees.
Sekine et al. (2013) found, by pollen analysis, a diversity of native species in honey samples, proving the use of native species by bees and highlighting the importance of preservation of native vegetation for the survival of the hives.
This study created a methodology for implementing a Geographic Information System, linked to registration data from beekeepers in the west of Paraná, which allowed the mapping of information obtained in the field. This tool may enable beekeepers and their associations to operate more efficiently, using spatial planning and the adequacy of the areas and may add value to the product by the traceability of the same.
The use of a Geographic Information System (GIS) in monitoring use and occupation may assist beekeepers in order to evaluate the influences of changes made over time about beekeeping.
The number of hives using the same area can be a limiting factor in honey production, but is not a determinant of the same, since the adequacy of management techniques and improved local flora can bring significant increases in productivity.
The floristic survey, the diversity index and the number of hives in each area reflected its ability to support bee, which was more dependent on the floristic diversity, since the area of greatest production had a higher number of hives and greater diversity floristic.
Accordingly, it is recommended an impro-vement of the local flora of Marechal Cândido Rondon, increasing the number or introducing plants present in the area St Helena, as: Cordia ealyculata, P. rigida, Peltophorum dubium, Leucaena leucocephala, Luehea divaricata, Psidium guajava, Hovenia dulcis, Allophylus edulis, Aloysia virgata, and other families: Boraginaceae, Cecropiaceae, Fabaceae, Lauraceae and Malvaceae.
ACKNOWLEDGMENTS
The authors want to thank the beekeepers and the Agrofamiliar Beekeepers Cooperative Partnership of West Paraná (COOFAMEL) for their support and for supplying honey samples. Aditional acknowledgements to the State University of Western Paraná (UNIOESTE), ITAIPU Binational and Secretary of State for Science and Technology and Higher Education (SETI - Legal Term: 032 / 2008).
RESUMO
nas colmeias da área mais povoada de Santa Helena e menor na área mais povoada de Marechal Cândido Rondon. O agrupamento das colmeias, as diferenças nas produções de mel e o levantamento florístico indicaram que estas diferenças podem estar associadas ao manejo, diferenças florísticas e climáticas registradas no período de produção nas áreas estudadas.
Palavras-chave: biodiversidade, sobreposição, agrupa-mento, produção de mel, planejamento.
REFERENCES
AMARAL MVF, SOUZA ALS, SOARES VP, SOARES CPB, MARTINS SV, LEITE HG, INÁCIO-FILHO E AND GASPAR RO. 2009. Dinâmica da cobertura vegetal (1980-2004) em
um projeto de produção florestal, nos municípios de Bugre
e Ipaba, MG. Rev Árvore 33(2): 315-325.
AOAC - ASSOCIATION OF OFFICIAL AGRICULTURAL CHEMISTS. 2000. Official methods of the Association of the Agricultural Chemists. 17th ed., Washington: AOAC, 1175 p.
BARROS AIRNA, NUNES FHFM AND COSTA MMF. 2009. Manual de boas práticas na produção de cera de abelha. Lisboa: FNAP, 64 p.
BARROSO GM, COSTA CG, GUIMARÃES EF, ICHASO CL AND PEIXOTO AL. 2002. Sistemática de angiospermas do Brasil. v. 1 – 2nd ed., Viçosa: UFV, 304 p.
BRODSCHNEIDER R AND CRAILSHEIM K. 2010. Nutrition and health in honey bees. Apidol 41: 278-294.
BRODSCHNEIDER R, MOOSBECKHOFER R AND CRAILSHEIM K. 2010. Surveys as a tool to record winter losses of honey bee colonies – a 2 year case study in Austria and South Tyrol. J Api Res 49: 23-30.
CARVALHO C AND MARCHINI LC. 1999. Plantas visitadas por
Apis mellifera L. no vale do rio Paraguacu, Município de
Castro Alves, Bahia. Rev Bras Bot 22: 333-338. CRANE E. 1985. O livro do mel. São Paulo: Nobel, 226 p. CRONQUIST A. 1988. The evolution and classification of
flowe-ring plants. 2nd ed., New York: The New York Botanical Garden, 555 p.
CRUZ CD. 2006. Programa GENES: análise multivariada e simulação. Viçosa: UFV, 175 p.
CRUZ CD AND REGAZZI AJ. 1994. Divergência genética. In: CRUZ CD AND REGAZZI AJ (Eds), Métodos biomé-tricos aplicados ao melhoramento genético, Viçosa: UFV, Viçosa, BR, p. 287-323.
CULLEN JUNIOR L, RUDRAN R AND VALLADARES-PÁDUA C. 2003. Métodos de estudos em biologia da conservação e manejo da vida silvestre. 2a ed., Curitiba: UFPR, Fundação O Boticário de Proteção a Natureza, 667 p.
DAUBER J, HIRSCHA M, SIMMERING D, WALDHARDT R, OTTEB A AND WOLTERS V. 2003. Landscape structure as an indicator of biodiversity: matrix effects on species richness. Agric Ecosyst Environ 98: 321-329.
DI MARCO G, CANUTI L, IMPEI S, LEONARDI D AND CANINI A. 2012. Nutraceutical properties of honey and pollen produced in a natural park. Agric Sci 3(2): 187-200. EMBRAPA - EMPRESA BRASILEIRA DE PESQUISA AGROPECUÁRIA.
2006. Centro Nacional de Pesquisa de Solos. Sistema
brasileiro de classificação de solos.2a ed., Rio de Janeiro: Embrapa Solos, 412 p.
FAHRIG L. 2003. Effects of habitat fragmentation on biodiversity. Annu Rev Ecol Evol Syst 34: 487-515.
FIDALGO O AND BONONI VLR. 1989. Técnicas de coleta, preservação e herborização de material botânico, n.4. São Paulo: Instituto de Botânica, 62 p.
GRAYMORE MLM, WALLIS AM AND RICHARDS AJ. 2009. An Index of Regional Sustainability: A GIS-based multiple criteria analysis decision support system for progressing sustainability. Ecol Complex 6(4): 453-462.
IAP - INSTITUTO AMBIENTAL DO PARANÁ. 2009. Lista de espécies exóticas invasoras do Paraná. Portaria 125/2009. Available at: http://www.iap.pr.gov.br/arquivos/File/ Legislacao_ambiental/Legislacao_estadual/PORTARIAS/ PORTARIA_IAP_125_2009_ESPECIES_EXOTICAS.pdf. IBGE - INSTITUTO BRASILEIRO DE GEOGRAFIA E ESTATÍSTICA.
2009. Pesquisa da pecuária nacional. Available at: http:// www.sidra.ibge.gov.br/bda/tabela/listabl.asp?c=74&z= p&o=23.
INPE/SPRING - INSTITUTO NACIONAL DE PESQUISAS ESPACIAIS/ SISTEMA DE PROCESSAMENTO DE INFORMAÇÕES GEOREFERENCIADAS. 2008. Available at: http://www.dpi. inpe.br/spring/usuario/ indice.htm.
JOHNSON RA AND WICHERN DW. 1992. Applied multivariate statistical analysis.3rd ed., New Jersey: Prantice Hall, 642 p. KÖPPEN W. 1948. Climatologia, com um estúdio de los climas
de la tierra. México: FCE, p. 482-487.
KOMATSU SS, MARCHINI LC AND MORETI ACCC. 2002.
Análises físico-químicas de amostras de méis de flores
silvestres, de eucalipto e de laranjeira, produzidos por
Apis mellifera L. 1758 (Hymenoptera, Apidae) no Estado de São Paulo. 2. Conteúdo de açúcares e de proteina. Cienc Tecnol Aliment 2: 143-146.
LARSEN DR. 1996. Measures of Diversity. Nat Res Bio. Missouri, USA.
MAACK R. 2002. Geografia física do Estado do Paraná. 3a ed.,
Curitiba: Imprensa Oficial do Paraná, 440 p.
MANRIQUE AJ. 1995. Evaluación de prácticas de manejo de abejas sobre la producción de miel y cera. Zoot Trop 13(2): 215-223.
MAPA - MINISTÉRIO DA AGRICULTURA, PECUÁRIA E ABASTECIMENTO. 2000. Instrução Normativa n.11, de 20 de outubro de 2000. Regulamento técnico de identidade e
qualidade do mel. Brasília: Diário Oficial 1: 16-17.
MARCHINI LC, MORETI AC, TEIXEIRA EW, SILVA ECA, RODRIGUES RR AND SOUZA VC. 2001. Plantas visitadas por abelhas africanizadas em duas localidades do Estado de São Paulo. Sci Agric 58: 413-420.
MELLO MHSH, SILVA EA AND NATAL D. 2003. Abelhas africanizadas em área metropolitana do Brasil: abrigos e
influências climáticas. Rev Saúde Pública 37(2): 237-241.
MOREIRA CR. 1997. Substituição da leucena (Leucaena leucocephala) na faixa de proteção do reservatório da Itaipu Binacional. Foz do Iguaçu: Centro de Estudos da Itaipu Binacional (CEPI), 21 p.
NOGUEIRA-COUTO RH AND COUTO LA. 2006. Apicultura: manejo e produtos. 3a ed., Jaboticabal: FUNEP, 193 p. PELDOZA J. 1994. Apicultura y control de varroasis. Colección
Manuales Prácticos FAO. Santiago de Chile: FAO, 144 p. PIRANI JR AND CORTOPASSI-LAURINO M. 1993. Flores e
abelhas em São Paulo. São Paulo: EDUSP, 192 p. REIS E. 1997. Estatística multivariada aplicada. Lisboa:
Edições Silabo, 342 p.
REITZ R, KLEIN RM AND REIS A. 1978. Projeto madeira de Santa Catarina:levantamento das espécies florestais nativas em Santa Catarina com a possibilidade de incremento e
desenvolvimento. Itajaí: Herbário Barbosa Rodrigues, 320 p.
REITZ R, KLEIN RM AND REIS A. 1983. Projeto madeira do Rio Grande do Sul. Porto Alegre RS: Secretaria da Agricultura e de Abastecimento, 524 p.
RODERJAN CV, GALVÃO F, KUNIYOSHI YS AND HATSCHBACH GG. 2002. As unidades fitogeográficas do Estado do Paraná. Ciência & Ambiente 24: 75-92.
RUBIO EM. 1976. Abejas y colmenares. Buenos Aires: Marymar, 199 p.
SALOME JA AND ORTH AI. 2004. Diversidade da flora apícola de Santa Catarina. Agropecu Catarin 17(2): 84-88.
SANTOS MF, GALBIATI C, NEVES SMAS AND LOUREIRO EM. 2011. Temporal analysis of the use and vegetal coverage
and the honey pollen diversity in Cáceres (MT). Geografia
36: 73-83.
SEKINE ES, TOLEDO VAA, CAXAMBU MG, CHMURA S, TAKASHIBA EH, SEREIA MJ, MARCHINI LC AND MORETI ACCC. 2013. Melliferous flora and pollen characterization of honey samples of Apis mellifera L., 1758 in apiaries in the counties of Ubiratã and Nova Aurora, PR. An Acad Bras Cienc 85: 307-326.
SEREIA MJ, ALVES EM, TOLEDO VAA, MARCHINI LC, SEKINE ES, FAQUINELLO P, ALMEIDA D AND MORETI ACCC. 2011. Physicochemical characteristics and pollen spectra of organic and non-organic honey samples of Apis mellifera
L. An Acad Bras Cienc 83: 1077-1090.
SERRANO RB, VILLANUEVA MT AND MARQUINA AD. 1994. La miel. Edulcorante natural por excelência. Alimentaria 253: 29-35.
SILVA RA. 2011. Apicultura. Available at: http://www.seab.pr.gov. br/modules/qas/ uploads/2510/mel_001_07fev2011.pdf. TAMME R, HIIESALU I, LAANISTO L, SZAVA-KOVATS R AND
PÄRTEL M. 2010. Environmental heterogeneity, species diversity and co-existence at different spatial scales. J Veg Sci 21: 796-801.
VELOSO HP, RANGEL FILHO ALR AND LIMA JCA. 1991.
Classificação da vegetação brasileira adaptada a um
sistema internacional. Rio de Janeiro: IBGE, 124 p. VIANA BFV, SILVA FO AND KLEINERT AMP. 2006. A flora
apícola de uma área restrita de dunas litorâneas, Abaeté,
Salvador, Bahia. Rev Bras Bot29: 13-25.
VICTOR R. 2000. NAÇÕES UNIDAS. Relatório-Síntese da Avaliação Ecossistêmica do Milênio, Available at: http:// www.rbma.org.br/mercadomataatlantica/pdf/sem_ma_ serv_amb_18.pdf.
VILELA SLO. 2000. A importância das novas atividades
agrícolas frente a globalização: a apicultura no estado do Piauí. Terezina: Embrapa Meio-Norte, 228 p.
VUILLEUMIER S, BUTTLERB A, PERRINA N AND YEARSLEY JM. 2011. Invasion and eradication of a competitively superior species in heterogeneous landscapes. Ecol Model 222: 398-406.
WIESE H. 1986. Nova apicultura. 7a ed., Porto Alegre: Agropecuária, 493 p.
WILMS W, IMPERATRIZ-FONSECA VL AND ENGELS W. 1996. Resource partitioning between highly eusocial bees and possible impacto fo the introduced africanized honey bee on native stingless bees in the brazilian Atlantic Rainforest. Stud Neotrop Fauna e Environm 31(3-4): 137-151. WOLFF LF, LOPES MTR, PEREIRA FM, CAMARGO RCR AND