A Work Project, presented as part of the requirements for the Award of a Master’s Degree in Management from the NOVA – School of Business and Economics
DIMENSIONS OF SOURCE CREDIBILITY IN THE CASE OF USER-GENERATED ADVERTISEMENTS
ANNIE LAUZON-DUGUAY MST15000610
A project carried out in the Marketing area under the supervision of: Tomasz Miaskiewicz
ABSTRACT
User-generated advertising changed the world of advertising and changed the strategies used by marketers. Many researchers explored the dimensions of source credibility in traditional media and online advertising. However, little previous research explored the dimensions of source credibility in the context of user-generated advertising. This exploratory study aims to investigate the different dimensions of source credibility in the case of user-generated advertising. More precisely, this study will explore the following factors: (1) objectivity, (2) trustworthiness, (3) expertise, (4) familiarity, (5) attractiveness and (6) frequency. The results suggest that some of the dimensions of source credibility (objectivity, trustworthiness, expertise, familiarity and attractiveness) remain the same in the case of user-generated advertising. Additionally, a new dimension is added to the factors that explain source credibility (reputation). Furthermore, the analysis suggests that the dimension “frequency” is not an explanatory factor of credibility in the case of user-generated advertisement. The study also suggests that companies using user-generated advertisement as part of their overall marketing strategy should focus on objectivity, trustworthiness, expertise, attractiveness and reputation when selecting users that will communicate sponsored user-generated advertisements.
1. INTRODUCTION
Since the creation of Internet, online advertising experimented a sharp progression. Since the invading emails, pop-ups and banners era, marketers now display the advertisements in a less invading way. Moreover, online advertising contributed to the abolition of time and geographic barriers by making the ads available to users worldwide at any time of the day. The rise of web 2.0, (a platform where “a large group of people can create a collective work
whose value far exceeds that provided by any of the individual participants” (O’Reilly,
2005: 2) contributed to a shift of the power to edit the content from companies to users. This phenomenon increased the need for marketers to adapt their advertising strategies.
One way of advertising online is through user-generated content. User-generated content is defined as content created by the public rather than by paid professionals1. Advertising via user-generated content (also called user-generated advertising) consists in advertising published by the consumers rather than the companies. For example, many companies started targeting users of social media to make them the spokesperson of their marketing campaigns. However, this type of advertising presents some risks. Namely, user-generated advertisement can be a reason to despise social media, may decrease the authenticity of the conversation and make companies using such a marketing strategy look desperate2.
It was demonstrated that one element that influences the acknowledgement of an ad is source credibility (Ohanian, 1991). Source credibility is the set of positive characteristics from the communicator that will influence the acceptance of the message communicated (Ohanian,
1 http://www.pcmag.com/encyclopedia_term/0,2542,t=user-generated+content&i=56171,00.asp 2
Gregory, Sean. 2009, “How to Make Money on Twitter: Do commercials!” Time Magazine, September 2009, http://www.time.com/time/
1991). This study aims to identify the dimensions of source credibility in the context of user-generated advertisements. After looking at the dimensions of source credibility in the literature concerning traditional and online advertising, a factor analysis is performed. The goal of the factor analysis is to define which dimensions also explain source credibility in the case of user-generated advertising.
The first section addresses the research question. Then, this study presents an extensive literature review on the dimensions that will be studied. Afterwards, a factor analysis is performed. The analysis includes the pre-requisite conditions and a discussion of the results. Finally, a conclusion on the factor analysis is presented to confirm, (1) from a theoretical perspective, which factors are identified as dimensions of source credibility and (2) from a managerial perspective, on which of the users’ characteristics to focus for the companies specializing in user-generated advertising.
2. RESEARCH QUESTION
Before presenting the literature review, it is important to address the research question studied in this research: What are the explanatory factors of source credibility in the case
of user-generated advertisement? This study explores which of the factors identified in the
research literature explain source credibility in the context of user-generated advertising. More specifically, this study analyzes the factors that proved to have an influence on source credibility in traditional media. Afterwards, this research verifies if the constructs can be considered as dimensions of source credibility.
3. LITERATURE REVIEW
This review of the literature reviews the existing studies on advertising and source credibility. More precisely, relevant literature is reviewed to demonstrate the relevance of the topic. This section is divided in four parts. First, definitions of the key concepts used in this study are provided. Then, this research looks at user-generated advertising as a form of online advertising. The third section explores the impact of source credibility on advertising effectiveness. Finally, a presentation of the factors identified in the literature as dimensions of source credibility is done.
3.1. Definitions
Online advertising: Online advertising is defined as “the use of Internet as a medium where promotional messages appear on a computer screen3”. Since the communication softwares
reveal sufficient information about the sites’ visitors, online advertising can be custom-tailored to match users’ preferences. Online advertising includes mainly emails, banners, pop-up and most recently user-generated advertisements. The definition of user-generated advertising is provided further in this study.
User-generated content: The most common definition of user-generated content (UGC) is
“the production of content by the general public rather than paid professionals and experts
in the field.4” UGC is also called “peer production” and is available on the websites via
wikis, blogs and social media.
3
http://www.businessdictionary.com/definition/online-advertising.html
User-generated advertising: User-generated advertising (UGA) is a form on online
advertising. There is no exact definition of UGA. However, Karla and Schwieren (2010) combined the definition of Kotler and Bliemel (1998) and the definition of Schweiger and Schrattenecker (2005) to get to the following definition of UGA: “User-generated
advertising includes all forms of communication that influence market-relevant attitudes, using user-generated advertising techniques via advertising media and at the request of an identifiable client” (Karla and Schwieren, 2010: 274). In other words, UGA is advertising
created by the consumers. There is a distinction in the literature between sponsored and non-sponsored UGA (Arhnold, 2010). The non-sponsored UGA involves that the consumer gets a compensation for advertising (Arhnold, 2010). This research focuses on sponsored UGA.
3.2. User-generated advertising as a form of online advertising
Unlike previous types of online advertising (often email advertising, pop-up and banners) UGA consists in advertising created by users that are not related to a company. Therefore, UGA allows for an interactive use of the Web. It was already recognized to allow the users to communicate their thoughts and opinion without any confirmation or approval, shifting the power from institutions to people (Li and Bernoff, 2011). Therefore, advertising requires companies to understand the interactions between the consumers online. Rieh (2002) stated that consumer judgments of website information credibility are more a function of the website provider’s credibility, meaning that online advertising will be perceived as biased by the consumers if it is edited by the company.
3.3. Source credibility and advertising effectiveness
Ohanian (1991) described source credibility as the message senders’ positive characteristics that influence the receiver’s acceptance of the message communicated. Ad credibility is defined as the extent to which consumers perceive the message in the ad to be believable (Choi and Rifon, 2002) and is based largely on “the trust a consumer places in the source of
that particular ad” (MacKenzie and Lutz, 1989: 61). Both items have been recognized to be
important factors determining advertising effectiveness (Atkin and Block, 1983; Freiden, 1982; Friedman and Friedman, 1979; Kamins et al., 1989; Ohanian, 1991; Rifon and Choi, 2002). Additionally, more credible sources (often endorsers in advertising) have been found to produce more favourable attitudes and stronger behavioural intentions than less credible sources (Atkin and Block, 1983). According to the literature, perceived advertiser’s credibility is positively and directly related to credibility in traditional media (Choi and Rifon, 2002). In the case of online advertising, advertisers’ and website’s credibility perceptions appear to influence credibility that subsequently affects attitudes towards the ad/brand and purchase intentions (Choi and Rifon, 2002).
3.4. Factors that contribute to source-credibility
The following factors have been identified in the literature as constructs explaining or contributing to source credibility. This section will review the factors that explain source credibility in traditional or online media. Overall, the literature highlights six dimensions that influence source credibility. These factors are objectivity, trustworthiness, expertise, familiarity, attractiveness and frequency.
3.4.1. Objectivity: One of the most studied dimensions of source credibility is the objectivity
of the advertiser. Objectivity is defined as “the expression of facts or conditions as perceived
without distortion by personal feelings, prejudice or interpretations”5
. Whitehead (1968) demonstrated that in the case of public speakers, objectivity is one of four factors influencing credibility. Lee and Park (2009) also demonstrated that there is a significant interaction of electronic-word-of-mouth objectivity with perceived credibility. In the case of online advertising, the perceived objectivity of the source will have a huge influence on the acceptance of the message. Darley and Smith (1993) demonstrated that objective claims are more effective than subjective ones. As a result, it is expected that objectivity will be a dimension of credibility in the case of UGA.
3.4.2. Trustworthiness: Many studies in the scientific literature on traditional and online
media highlight the unequivocal link between trustworthiness and credibility. Trustworthiness refers to an audience’s belief that the communicator provides information in an honest manner, without a motivation for a manipulation or deception (Ohanian, 1991). It also refers to the perceived willingness to provide valid and accurate information (Hovland et al., 1953). Trustworthiness was identified as one of the most important dimension of source credibility when endorsers are involved in the advertising campaign (Hovland et al., 1953; Ohanian, 1991; Tripp, 1994). Source credibility theory states that people are more likely to be persuaded when the source presents itself as credible (Hovland et al., 1953; Ohanian, 1991; Petty and Cacioppo 1986; Phillips and Dholakia 1978)
In the case of blogging, Chu and Kamal (2008) suggest that when perceived blogger trustworthiness is high, argument quality has a greater impact on brand attitudes than when perceived blogger trustworthiness is low. They also elaborated that when the reader of a blog is confident that the blogger is trustworthy, they will accept the argument as valid without careful thought. In the case of online advertising, Moran (1999) stated that online consumers are likely to seek out and purchase brands they trust. As the literature is clear on the effect of trustworthiness on credibility in traditional and online advertising, it is expected trustworthiness will be a factor that helps to explain credibility in the case of UGA.
3.4.3. Expertise: Literature on expertise and source credibility appears to be ambivalent.
Especially concerning its impact in traditional and online media. Expertise is the extent to which a communicator is perceived to be able to provide valid and accurate information (Hovland et al., 1953). Expertise has been identified as a potentially important and enduring dimension of source credibility (Hovland et al., 1953; Ohanian 1991; Tripp et al., 1994). In advertising, expertise is the knowledge that an endorser or spokesperson seems to possess to support the claims made in the advertisement. It is also described as the perceived ability of the source to make valid assertions. Source expertise appears to be one of the strong influencing factors of credibility (Hovland and Weiss, 1951; Gaziano and McGrath, 1986; Homer and Kahle, 1990; Lafferty and Goldsmith, 1999; Meyer, 1988; Newell and Goldsmith, 2001; Petty and Cacioppo, 1981). However, Karmakar and Tormal (2010) demonstrated that expressing uncertainty in opinion from the expert sources can increase credibility. Due to the different findings in the literature, it is difficult to predict the effect of
source credibility in the case of UGA and therefore explains the relevance of the evaluation of the dimension.
3.4.4. Familiarity: Little literature explores the impact of familiarity or closeness to the
advertiser on credibility. Christakis and Fowler’s (2009) research demonstrated that the spread of influence in social network obeys the three degrees of influence rule. “Everything
we do tends to ripple through the network, having an impact on our friends (one degree), on our friends’ friends (two degrees) and on our friends’ friends’ friends (three degrees)”(Christakis and Fowler, 2009 : 28). It was also proved that the use of a celebrity
(familiar image to the consumer) as an endorser has a positive impact on credibility (Ohanian, 1991). Therefore, familiarity can be predicted to be a dimension of credibility in the case of UGA. As little literature exists, it will be relevant to explore familiarity as a dimension of source credibility in this study.
3.4.5. Attractiveness
Attractiveness is identified in the research literature as a construct that influences source credibility. Attractiveness is a dimension of source credibility that refers to the source perceived social value, such as physical appearance, personality, social status or similarity to the receiver (Baker and Churchill, 1977; Caballero and Solomon, 1984; Choi et al., 2005; McGuire, 1958). Attractive communicators are consistently liked more and have a positive impact on products with which they are associated (Joseph, 1982). Simon, Berkowitz and Moyer (1970) as well as Kahle and Homer (1985) added that communicators’ attractiveness enhances positive attitude change. Hence, it is expected that attractiveness will be a dimension of source credibility in the case of UGA.
3.4.6. Frequency: Literature on the frequency of the advertising mostly exists for online
advertising. It was previously determined that perceived advertising clutter in the social media can cause consumers to discriminate and avoid ads that are not relevant or important to them (Ingram 2006). If the perceived clutter is excessive, consumers are likely to have difficulty discriminating the message, which could result in ignorance of the message (Cho and Cheon, 2004). Kelly et al., (2010) suggested that advertising clutter in social media is acceptable because it keeps the site free of charge. Therefore, this study predicts that frequency of advertisement will be a dimension of credibility.
All of the factors that are used in this research are taken from the existing literature and presented in the previous section. These dimensions have been highlighted as explanatory and influencing factors of credibility in multiple contexts (credibility of endorsers, credibility of public speakers, and credibility of the advertisers in the context of traditional media).
4. METHODOLOGY
4.1. Selection of an analytic method
The selection of the analytic method is based on the fact that UGA is a very recent technique of online advertising. The dimensions of credibility have been primarily studied in the context of traditional media. Therefore, an exploratory study based on a factor analysis is selected over any other method since the dimensions of source credibility in the case of UGA have not been explored yet. Additionally, little literature on UGA and source-credibility is available. Hence, this study will be able to examine which constructs are dimensions of source credibility in the specific case of UGA. Moreover, some of the factors
previously identified seem to have ambivalent effect on source credibility depending on whether they are studied in the frame of traditional or online advertising.
4.2. Selection of the indicators
The measures have been taken from existing scales. The following section explains how the scales to measure each construct were selected based on previous literature. Table 1 (Appendix 1) depicts the details on the indicators.
To measure objectivity, three measures have been selected based on Eisend (2006) study. Eisend’s study provides a rigorous analysis of the source credibility concept based on the extraction of a series of measurements in the frame of traditional advertising. Eisend found three effective indicators for objectivity. Eisend’s scale is used to measure the credibility of the advertiser in a context where a specific scenario is provided. For the purpose of this more general study, the scale is adapted. To measure trustworthiness, expertise and attractiveness constructs, the indicators are based on Ohanian’s scale (1991). These scales, originally used to measure celebrity endorser’s credibility, are adapted to fit the needs of this more general study. The indicators for familiarity are based on the existing literature, mostly on Christakis and Fowler (2009) three degrees of influence theory. Finally, due to the absence of scales to measure the impact of the frequency of advertising on source credibility, the indicators are based on existing literature.
5. PRESENTATION AND ANALYSIS OF THE RESULTS
In order to perform a factor analysis, multiple conditions have to be observed. This section goes through seven conditions that have to be observed in order for the analysis to be valid
(Tabachnick and Fidell, 2009). The seven prerequisites are the nature of the variables, the size of the sample, the linearity hypothesis, the absence of deviant cases, the multicollinearity, the factorability of R, and the verification of deviant cases between the variables. Afterwards, the results of the analysis will be divided in the following points: (1) number of factors selected, (2) percent of the variance explained for each factor, (3) analysis of the indicators after the rotations, and (4) general assessment of the quality of the results and possible improvements.
5.1. Prerequisite conditions
Nature of the variables: To be able to perform a factor analysis, the manipulation of
indicators represented as ordinal variables has to be ensured. For this study, every indicator was represented with a five items Likert-type scale. The items used in the scale go from “strongly disagree” to “strongly agree” (with a neutral point “neither agree nor disagree”).
Sample selection: In the case of a factor analysis, a ratio of 5 to 10 cases for each indicator
is accepted (Everitt, 1975; Gorsuch, 1983). With 28 indicators, a sample size n = 140 can be accepted. Due to low funding and time limitations, the sample was originally constituted of 200 cases. The answers were collected on Mturk, a website that is used to collect surveys’ answers. 71 of those surveys did not go pass the pre-screening process. The pre-screening process aimed to select participants that are social media users and that make a reasonable use of the platform (i.e., more than 5 hours a week). For the pre-screening process, two questions were used make sure the previous conditions were fulfilled. As most of the sponsored UGA appear on social media, this study required the participant to have knowledge of UGA and use social media. For that reason, the definitions of UGA, ad, user
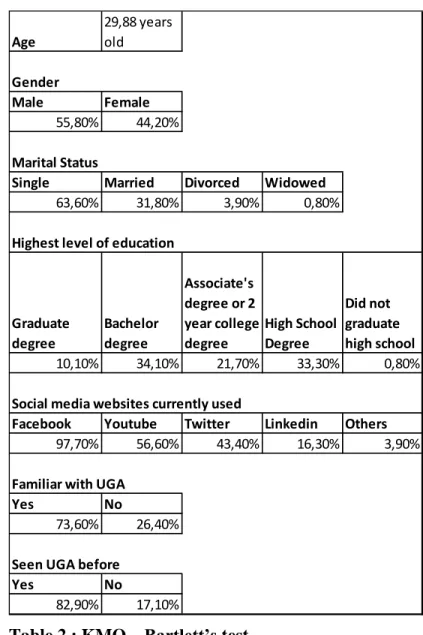
and advertiser were included. Table 1 (Appendix 2) depicts descriptive statistics for the sample.
Linearity hypothesis: The linearity hypothesis supposes that the simple linear model is
respected. In the actual case, with 28 indicators, 784 relationships between the variables would need to be verified to ensure the hypothesis is observed. A random verification could be accepted; however for this research, the assumption under which the relationship between the variables is linear (Tabachnik and Fidell, 2007) is used.
Absence of deviant cases: This pre-requisite has been verified through an analysis of the
standard deviation for each of the measures. If the standard deviation is not higher or lower than 3.5, there are no extreme values in the set of data. Through a descriptive analysis of the 28 variables, the absence of extreme values is confirmed.
Multicollinearity: Multicollinearity can be defined as the relationship between multiple
explicative variables that are collinear. In other words, the variables will systematically display a variation in the same direction or in opposite directions6. A correlation above .70 indicates multicollinearity (Cassel et al., 1997). After running the correlation analysis, two indicators were removed due to a high correlation with another variable. For this reason, the indicators Fam2 (correlation of .706 with Fam1) and Fre1 (Correlation of .803 with Fre2) were removed from the analysis.
Factorability of R: To verify this condition, the correlation matrix needs to display
correlations higher than 0.3 (both negative and positive). As presented in table 1 (Appendix
3) this part of the condition is respected. The sampling adequacy has to be verified with the Keiser-Meyer-Olkin (KMO) measure. The KMO measure confirms the adequacy of the sample. Indeed, a KMO higher than 0.6 with a Bartlett significance at a 0.05 level are accepted (Tabachnick and Fidell, 2007). With a KMO of 0.751 as depicted in Table 3 (Appendix 2), the correlations are valid.
Verification of deviant cases between the variables: To ensure that no deviant cases exist
within the variables, an extensive analysis of the squared multiple correlations is done. We usually have to reconsider the use of the variable when the SMC are lower than 0.1 (SMC ≤ 0.10) (Tabachnick and Fidell, 2007). The communalities matrix confirms that this condition is observed for each variable.
As all the necessary conditions to run a factor analysis are respected, the following section presents the results of the principal component analysis obtained with the Varimax rotation method. The Varimax method consists of an orthogonal rotation that is used in principal component analysis that aims to represent a construct based on a combination of indicators such that the variance of the loadings is maximized (Abdi, 2003)
5.2. Number of factors selected
In order to assess the number of factors selected with the factor analysis, an evaluation of the variables with the Eigenvalues is necessary. According to the Kaiser-Guttman rule, the factors will be considered only if the Eigenvalue is higher than 1 (VP ≥ 1) “A first quick
estimate of the number of factors is obtained from the sizes of the Eigenvalues reported as part of an initial run, (…), a component with an Eigenvalue less than 1 is not important,
from a variable perspective, as an observed value” (Tabachnick and Fidell, 2007: 644). According to the Kaiser-Guttman rule, 7 factors are extracted from the analysis. All of the 7 factors show Eigenvalues higher than 1 (F1 = 5.427, F2 = 3.923, F3 = 1.980, F4 = 1.569, F5 = 1.446, F6 = 1.149, F7 = 1.037)
5.3. Percent of the variance explained by each factor and cumulated variance
The extraction of the Eigenvalues from the factor analysis shows that F1 explains 21.71% of the variance in the analysis. F2 explains 15.69%, F3, 7.92%, F4 6.27% F5 5.78%, F6, 4.59% and F7, 4.15%. The total variance explained by these 7 factors is therefore 66.12%.
5.4. Analysis of the indicators after the rotation analysis according to the loadings
In order to relate the indicators to the constructs, one has to observe the loadings linking the factors and the indicators. To do this analysis, it is essential to keep in mind that the greater the loading, the more the variable is a pure measure of the construct. Comrey and Lee (1992) suggest the following scale to evaluate the loadings.
Loading Evaluation >0,71 Excellent >0,63 Very good >0,55 Good >0,45 Fair >0,32 Poor
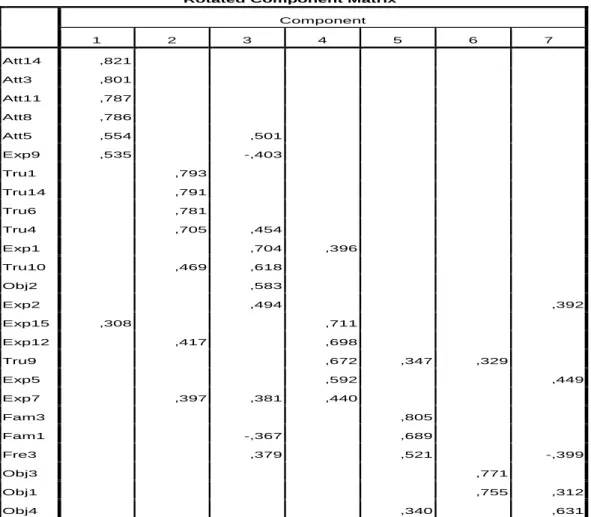
The analysis of the indicators is based on this scale. The research is based on the on the Principal Component Analysis with the Varimax rotation method that can be found in Table 3 (Appendix 2). The original criteria for the Varimax rotation analysis is that the indicators display loadings higher than 0.32. However, for each factor the selection is restrained to the measures with loadings higher than 0.55 (Good). Additionally, complex variables are
attributed (variables that have high loadings for more than one factors) to the factor where it shows the highest loading.
Factor 1: The first factor is composed by five measures with loadings higher than 0.55.
Those variables, according to Comrey and Lee’s scale show a contribution to the factor that goes from good to excellent. In the following discussion, the indicators are added in parenthesis. Att14 (Sexiness) shows a loading of .821, Att3 (Attractiveness) with a loading of .801, Att11 (Elegance) with a loading of .787 Att8 (Beauty) with a loading of .786 and Att5 (Class) with a loading of .554.
Factor 2: The second factor is made up of four variables that have loadings higher than
0.55: Tru1 (Dependability) with a loading of .793, Tru14 (Trustworthiness) with a loading of .791, Tru6 (Reliability) with a loading of .781 Tru4 (Honesty) with a loading of .705.
Factor 3: Three variables contribute to the third factor. First, the variable Exp1 (Expertise)
indicates a loading of .704. Second, the variable Tru10 (Sincerity) indicates a loading of .618. Finally, the variable Obj2 (Open-Minded) show a loading of .583.
Factor 4: The fourth factor is built of four indicators with loadings higher than 0.55. Exp15
(Skills) show a loading of .711, Exp12 (Qualifications) has a loading of .698, Tru9 (Reliability) has a loading of .672, Exp5 has a loading .592.
Factor 5: Factor 5 is explained by two variables with loadings higher than .55. Fam3
(Closeness) and Fam1 (Closeness) show loadings going from very good to excellent (.805 for Fam3 and .689 for Fam1).
Factor 6: Two variables explain the sixth factor. The two variables are Obj1 (Unprejudiced)
and Obj3 (Objectivity) that show both excellent loadings (.771 for Obj1 and .755 for Obj3).
Factor 7: Finally the last factor is explained by one variable. The variable this factor is Obj4
(Objectivity).
It is important to note the presence of complex variables with low loadings for multiple factors. Complex variables are variables that have a relationship to many factors or that show only poor loadings (Tabachnick and Fidel, 2007). Exp7 (Knowledge), Fre3 (Perceived clutter), Exp2 (Experience) and Exp9 (Knowledge) display only loadings lower than 0.55 for several factors. When facing a complex variable that has poor to fair loadings for all the factors, we can withdraw the variable from the analysis (Durand, 2005). For this reason, these indicators are not considered in our study.
5.5. General assessment of the quality of the results and possible improvements
The factor analysis suggests the presence of seven different factors. These factors have been determined with the Kaiser-Guttman rule as well as Comrey and Lee (1992) loadings. In combination with the existing literature, this research suggests the following dimensions of source credibility.
The first factor appears to be a good measure for attractiveness as described in the literature. Indeed, variables Att14, Att3, Att11, Att8 and Att5 show a good to excellent contribution to Factor1.
The analysis suggests that the second factor would be a good measure of trustworthiness. The following indicators: Tru1 (dependability), Tru14 (Trustworthiness), Tru6 (Reliability), Tru4 (Honesty) and Tru10 (Sincerity) have high loadings. Hence, the results suggest that Factor 2 is a valid measure for the Trustworthiness dimension.
The third factor is built with indicators from multiple dimensions pointed in the literature regarding source-credibility. Indeed, indicators Exp1 (Expertise), Tru10 (Sincerity) and Obj2 (Open-Minded) appears to deviate from the scales built in the literature. At first glance, it could be interesting to assess these indicators to a new dimension that could be related to reputation. A further analysis in this direction would confirm this idea.
The fourth factor appears to be related to the expertise dimension. Most of the variables related to expertise show high loadings, such as Exp12 (Qualifications), Exp5 (Expertise) and Exp7 (Knowledge). Therefore, the results suggest that the fourth factor is a good measure of expertise.
The fifth factor is built up with two items related to closeness (Fam1 and Fam3). As it was demonstrated in the literature that closeness is an indicator of familiarity, the analysis suggest that the fifth factor is related the familiarity dimension of source credibility.
Both sixth and last factors appear to be linked at the objectivity construct. Although only two variables contribute to the sixth dimension – Obj1 (Unprejudiced) and Obj3 (Objectivity),
they are both related to the same factor. The last factor is only confirmed by one indicator (Obj4 – Objectivity) that is also related to objectivity. As the last factor is showing an Eigenvalue very close to 1 and is linked to the same dimension as the fifth factor, it would be possible to question the pertinence of including this factor in the original analysis.
It is also important to note that multiple elements that were predicted to have a link to a specific dimension had loadings higher for other factors. Namely the variables Tru9 (related to Expertise), Exp7 (related to trustworthiness), Obj2 (related to no factor identified in the literature), Exp9 (related to attractiveness), Fre3 (related to familiarity) show higher loading in dimensions different than what was predicted in the literature. Therefore, this study suggests that some of the indicators taken from previous scales are not valid measures of the constructs established in the case of UGA. Hence, when measuring source credibility in UGA, the items would have to be used as indicators of different dimensions than the ones predicted by literature.
Finally, the literature also suggests a frequency factor. However, the factor analysis did not highlight such a dimension and the indicators related to frequency were either eliminated due to multicollinearity or identified as indicators of other dimensions.
6. DISCUSSION AND CONCLUSION
Sponsored UGA is a new phenomenon that rose with the popularity of the social media. As it is very recent, little literature and studies on the factors influencing credibility in the specific case of sponsored UGA currently exists. This study provides a basis for future research on the impact of different factors on source credibility. This study also allows
sorting the ambivalence in the existing literature, namely regarding use of some factors as measures of credibility whether they are studied in the context of traditional or online advertising.
This research started with the identification of six dimensions of source credibility in the literature (mainly related to traditional media and online advertising). These six factors are objectivity, trustworthiness, expertise, familiarity, attractiveness and frequency. For each factor, multiple indicators were taken from existing scales in the theory. Based on these existing scales, this study adds new items that can be specifically used to measure source credibility in the case of UGA. These new items can also be used by advertisers to investigate the perception of their advertisements. The identified indicators have been used as the basis to build our questionnaire and our factor analysis. The use of a factor analysis to achieve this exploratory study is justified by many elements. First the novelty of UGA, second, the small quantity of research that exists on the specific topic of source credibility in the case of UGA and last, the ambivalence in the literature on the use of some construct to measure source credibility.
6.1. Next steps for investigation
The present study presents initial testing and suggests indicators that could be used to measure source credibility in the case of user-generated advertising. However, confirmatory steps would have to be performed to confirm the validity of the indicators. Namely, further analysis could determine the presence of bias in the measures. A study on the exact correlation between the dimensions and source-credibility would have to be performed. Finally, this study does not provide a direction to the relationships established between the
constructs and source credibility. It would be relevant to identify whether the dimensions suggested in this study have a positive or negative impact on source credibility. From these results, it would be important to measure the impact of source credibility on the success of UGA. To achieve that, a study would have to determine how source credibility will influence the propensity of the user to click on the advertisement.
6.2. Theoretical implications of the research
This study suggests that five of the dimensions of source-credibility identified in the existing literature are dimensions of source credibility in UGA. These dimensions are attractiveness, trustworthiness, expertise, familiarity and objectivity. This research also suggests that a new dimension, reputation, might exist specifically in the UGA context. One of the factors (frequency), that was mentioned as a dimension of credibility in the literature was not highlighted as a dimension of source credibility in the analysis. Therefore, the results suggest that due to the increasing number of advertisements in the social media, the consumers developed strategies to avoid UGA (also made easier by social media platforms). Therefore frequency does not appear as a dimension of source-credibility in this specific situation. It was also confirmed that the attractiveness dimension is the one accounting for the most variance in the analysis, followed by trustworthiness, reputation, expertise, familiarity and objectivity. Finally, a further study could investigate the exact impact of the users’ attractiveness on source credibility and eventually on the propensity to click on a UGA.
6.3. Managerial implications of the research
As more and more UGA companies (such as MyLikes and IZEA) emerge on the market it is important, from a managerial point of view, to understand which factors will influence the
credibility of the user that publishes the advertisement. More specifically, it was previously stated that source credibility has an influence on the consumption behaviour of the consumers.
This study explores which factors explain source credibility in the case of UGA. From a managerial point of view, it is important for companies as MyLikes or IZEA to understand the impact of the different factors presented in this study. They will have to consider these factors when selecting the advertisers. From the point of view of the companies investing in UGA, understanding which factors explain source credibility is a key factor for the success of marketing campaign based on UGA.
6.4. General conclusions
Finally, an answer is provided to the research question addressed at the beginning of this study.
What are the explanatory factors of source credibility in the case of user-generated advertisement?
This study suggests that the explanatory factors of source credibility in the case of UGA are attractiveness, objectivity, trustworthiness, expertise and familiarity. This research also added a new dimension, not discussed in the literature that was identified as reputation. Although a further confirmatory study would have to be performed, the results suggest that companies investing in UGA should pay attention to those six factors.
REFERENCES
Atkin, C., Martin B. 1983. “Effectiveness of Celebrity Endorsers” Journal of Advertising Research, 23 (2): 57-61
Bernard, J and Zhang, M. 2009. “Twitter Power: Tweets as Electronic Word of Mouth”. Journal of the American Society for Information Science and Technology, 60 (11):
2169-2188
Clemons, E., Barnett, S., Appardurai, A. 2007, The future of advertising and the value of social network websites: Some preliminary examinations.,, USA p.267
Christakis, N., Fowler, J. 2011. Connected: How your friends’ friends’ friends affect everything you feel, think and do, Little, Brown and Company
Cho, C. 1999. “How Advertising Works on the WWW: Modified Elaboration Likelihood
Model”, Journal of Current Issues and Research in Advertising, 27 (1): 33-50
Chu, S., Kamal, S. 2008. “The effect of Perceived Blogger Credibility and Argument
Quality on Message Elaboration and Brand Attitudes: An Exploratory Study”. Journal of
interactive advertising 8 (2): 1-31
Darley, K.William, Smith, E. Robert. 1993. “Advertising Claim objectivity: Antecedents
and Effects”, The Journal of Marketing 57 (4): 100-113
Eisend, M. 2006. “Source credibility Dimensions in Marketing Communication – A
generalized solution”. Journal of Empirical Generalisations in Marketing, 10 (2): 1-33
Freiden, J. 1982. “An Evaluation of Spokesperson and Vehicle Source Effects in
Advertising”, Current Issues and Research in Advertising, 5 (1): 77-88
Friedman, H., Friedman, L.1979. “Endorser Effectiveness by Product Type”, Journal of Advertising Research, 19 (5): 63-71
Fortin,M.F., 2006. Fondements et étapes du processus de recherche, Chenelière Éducation Goldsmith, R., Lafferty, B., Newell S. 2000. “The Impact of Corporate Credibility and
Celebrity Credibility on Consumer Reaction to Advertisements and Brands”, Journal of
Advertising 29 (3): 43-54
Gregory, Sean, How to make Money on Twitter, Times online,
Hovland, C., Janis, I.L., Kelley, H. 1953. Communication and Persuasion Psychological Studies of Opinion Change, Yale University Press
Hovland, C., Weiss, W. 1951. “The Influence of Source Credibility on Communication
Effectiveness”, Public Opinion Quarterly, 15 (4): 635-650
Kamins, M. Brand, M., Hoeke, S., Moe J. 1989. “Two-sided Versus One-sided Celebrity
Endorsements: The Impact on Advertising Effectiveness and Credibility, Journal of
Advertising.” 18 (2): 4-10
Kamins, M. Kamal G. 1994. “Congruence Between Spokesperson and Product Types: A
Matchup Hypothesis Perspective”, Psychology and Marketing 11 (6): 569-586
Kelly, L., Kerr, G., Drenan. J. 2010. “Avoidance of advertising in social networking sites :
the teenage perspective”. Journal of Interactive Advertising, 10 (2): 16-27
Li, Charlene., Bernoff, Josh., 2011. Groundswell: Winning in a world transformed by social technologies, Harvard Business Review Press
Ohanian, R. 1990. “Construction and Validation of a Scale to Measure Celebrity
Endorsers Perceived Expertise, Trustworthiness, and Attractiveness”. Journal of Advertising, 19(3): 39-52
Ohanian, R. 1991. “The Impact of Celebrity Spokespersons' Perceived Image on
Consumers' Intention to Purchase” Journal of Advertising Research, 31(1): 46-53
Rieh, S. Y. 2002. “Judgment of information quality and cognitive authority in the web.” Journal of the American Science for Information Science and Technology, 53(2), 145-161. Rifon, N., Choi, S.M., 2002, “Antecedents and Consequences of Web Advertising
Credibility : A study of Consumer Respon to Banner Ads”, Journal of Interactive
Advertising., 3(1): 12-24
Tabachnick, B.G., Fidell, L.S. 2007. Using multivariate statistics. Fifth Edition.
APPENDIX 1 – INDICATORS AND SCALES
CONCEPT INDICATORS
Attractiveness
Att3: It is important that the user is attractive Att5: I want the advertiser to be classy Att8: The beauty of the
advertiser is important Att11: It is important that the advertiser is elegant Att14: It is important that the advertiser is sexy.
Familiarity
Fam1: It is important that I know personally the user Fam2: I want the advertiser to be one of my direct friends Fam3: I will ignore an ad from a user that is not my friend or that I don’t follow on social media
Expertise
Exp1: An advertiser that has expertise related to the product/service advertised is credible. Exp2: It is important that
the advertiser as experience related to the product/service advertised. Exp5: I want the advertiser to be an expert in a field related to the product/service advertised. Exp7: I want the advertiser to have knowledge of the field related to the advertisement posted. Exp9: It is important that the advertiser has a college degree. Exp11: The knowledge of the advertiser is important Exp12: The qualifications of the advertiser are important. Exp15: The skills of the advertiser important.
Trustworthiness
Tru1: I want the advertiser to be dependable. Tru4: It is important that the advertiser is honest Tru6: I want the
advertiser to be reliable Tru9: I will ignore the ad if other users posted negative comments about the advertisement
Tru10: I want the advertiser to be sincere. Tru14: I want the advertiser to be trustworthy. Objectivity
Obj1 :I would prefer that the advertiser is not paid Obj2 : I would prefer an ad from an open-minded advertiser Obj3 : I want the advertiser to be objective Obj4 : I will ignore an ad if I know that the advertiser has a direct link
with the product/service advertised
Source credibility
APPENDIX 2 - TABLES OF THE ANALYSIS Table 1 : Sample descriptive statistics
Table 2 : KMO – Bartlett’s test
Age 29,88 years old Gender Male Female 55,80% 44,20% Marital Status
Single Married Divorced Widowed
63,60% 31,80% 3,90% 0,80% Highest level of education
Graduate degree Bachelor degree Associate's degree or 2 year college degree High School Degree Did not graduate high school 10,10% 34,10% 21,70% 33,30% 0,80% Social media websites currently used
Facebook Youtube Twitter Linkedin Others
97,70% 56,60% 43,40% 16,30% 3,90% Familiar with UGA
Yes No
73,60% 26,40% Seen UGA before
Yes No
82,90% 17,10%
KMO and Bartlett's Test
Kaiser-Meyer-Olkin Measure of Sampling Adequacy. ,751 Bartlett's Test of Sphericity Approx. Chi-Square 1307,708
Df 300
Table 3: Rotated Component Matrix
Rotated Component Matrixa
Component 1 2 3 4 5 6 7 Att14 ,821 Att3 ,801 Att11 ,787 Att8 ,786 Att5 ,554 ,501 Exp9 ,535 -,403 Tru1 ,793 Tru14 ,791 Tru6 ,781 Tru4 ,705 ,454 Exp1 ,704 ,396 Tru10 ,469 ,618 Obj2 ,583 Exp2 ,494 ,392 Exp15 ,308 ,711 Exp12 ,417 ,698 Tru9 ,672 ,347 ,329 Exp5 ,592 ,449 Exp7 ,397 ,381 ,440 Fam3 ,805 Fam1 -,367 ,689 Fre3 ,379 ,521 -,399 Obj3 ,771 Obj1 ,755 ,312 Obj4 ,340 ,631
Extraction Method: Principal Component Analysis. Rotation Method: Varimax with Kaiser Normalization.