Vol.55, n. 6: pp.921-926, November-December 2012
ISSN 1516-8913 Printed in Brazil BRAZILIAN ARCHIVES OF
BIOLOGY AND TECHNOLOGY
A N I N T E R N A T I O N A L J O U R N A L
Glutathione Production Using Magnetic Fields Generated by
Magnets
Lucielen Oliveira dos Santos
1*, Tatiane Araujo Gonzales
2, Beatriz Torsani Úbeda
2and
Ranulfo Monte Alegre
21Departamento de Tecnologia de Alimentos; Instituto de Tecnologia; Universidade Federal Rural do Rio de
Janeiro; C. P.: 74573; 23890-971; Seropédica - RJ - Brasil. 2Departamento de Engenharia de Alimentos; Faculdade de Engenharia de Alimentos;Universidade Estadual de Campinas; C. P.: 6121; 13083-862; Campinas - SP - Brasil
ABSTRACT
The objective of this work was to study the production of GSH by Saccharomyces cerevisiae ATCC 7754 in a fermentor (5 L) using a cell recycle system with magnets. The fermentation conditions were 20°C, 500 rpm, 5% (v/v) of inoculum, pHinitial 5, 1.1 vvm aeration and total fermentation time of 72 h. The time of application of MF ranged
from 24, 48 or 72 h. In comparison to the control experiment, the best results were obtained with 72 h of application of MF. The cell concentration reached 19.5 g/L and GSH concentration was 271.9 mg/L that corresponded to an increase of 2.63 and 32.1% compared to the control experiment, respectively.
Key words: glutathione, magnetic field, Saccharomyces cerevisiae, batch fermentation
*Author for correspondence: [email protected]
INTRODUCTION
Glutathione, (GSH) is a biologically active tripeptide consisting of L-glutamate, L-cysteine
and glycine (Zhang et al. 2007). The biosynthesis
of GSH in humans occurs in virtually all cell types, with the liver being the major producer and
exporter (Wu et al. 2004). One of its most
important functions is as an antioxidant against the toxic effects of oxygen and other oxidative
compounds (Fan et al. 2004). Glutathione
deficiency contributes to oxidative stress, which plays a key role in aging and the pathogenesis of many diseases (including kwashiorkor, seizure, Alzheimer’s disease, Parkinson’s disease, liver disease, cystic fibrosis, sickle cell anemia, HIV, AIDS, cancer, heart attack, stroke and diabetes)
(Wu et al. 2004). Zhang et al. (2007) reported that
GSH was widely used as a pharmaceutical
compound and has the potential to be used in food additives and in the cosmetic industries.
Some yeast strains have the ability to accumulate glutathione in the cells. Yeast fermentation is an efficient approach to commercially produce
glutathione (Wen et al. 2005). Glutathione can be
produced by direct fermentative methods using
sugar as a starting material. Saccharomyces
cerevisiae and Candida utilis are currently used to
produce glutathione on an industrial scale (Li et al.
2004). S. cerevisiae is widely used in ethanol
production. Many studies have been conducted to assess the culture media, types of fermenters and
immobilization of yeasts (Alegre et al. 2003).
Santos, L. O. et al. 922
technology than to elevate the intracellular GSH content. Improving the intracellular GSH content in yeast is more attractive because it would not only increase GSH production remarkably but also be helpful for the down processing (Wen et al. 2004).
Stimulation or inhibition of cellular processes by the magnetic fields (MF) are of considerable interest in cell biology and biotechnology for not only establishing the basic mechanisms of this interaction but also its potential practical applications (Lei and Berg 1998). Depending on the shape and values of characteristic parameters (intensity, frequency, length or time constant in the case of impulses), different effects appears
(Fologea et al. 1998). The inhibition or stimulation
of the vital activity of microorganisms can be obtained by selecting the appropriate parameters of the MF (Pichko and Povalyaeva 1996).
The mechanism of the stimulation is not yet known. It might be connected with some changes
at the membrane level, because many
transmembrane flows are enhanced (Fologea et al. 1998). Under laboratory conditions, a variety of biological responses can be induced by exposure to MF. Representative examples include altered rates of DNA, RNA and protein synthesis, effects on cell growth, increased levels of enzymes associated with cell proliferation and changes in cell surface properties (Binninger and Ungvichian 1997). The fields affect the direction of migration and alter the growth and reproduction of microorganisms, causing a change in the rate of
cell growth (Zapata et al. 2002; Zapata et al.
2005).
The objective of this study was to determine the
influence of MF generated by magnets in GSH
concentration, produced by S. cerevisiae ATCC
7754.
MATERIALS AND METHODS
Microorganism and medium
The S. cerevisiae ATCC 7754 was obtained from the Tropical Culture Collection of the “Fundação André Tosello” (Campinas-SP, Brazil). The strain used was maintained on YM agar (yeast extract – malt extract). The medium for GSH production contained (g/L): glucose (54), yeast extract (50) and magnesium sulphate (12). The medium was sterilized by autoclaving at 121ºC for 20 min, except to glucose that was sterilized separately.
Inoculum and culture conditions
The slants were transferred into Erlenmeyer flasks and during 24 h the yeast grew on YM broth at 30ºC and 150 rpm. The batch fermentation was operated in a 5-L fermentor (New-Brunswick-Bioflo III), equipped with sensors measuring temperature and pH. The fermentor was adapted to a system of recycling of cell suspension through a magnetizer with magnets as shown in Fig. 1. The
working volume was 3.5 L. The pHinitial,
temperature, aeration, agitation, fermentation time and inoculum concentration were 5, 20°C, 1.1 vvm, 500 rpm, 72 h and 5% (v/v), respectively. The air was supplied by the compressor and filtered by passing through a filter. During fermentation, amino acids were added after 6 h: 2 mM cysteine and after 28 h: 3.35 mM cysteine, 10 mM glutamic acid and 18 mM glycine and samples were taken at regular intervals of time.
Legend:
1- Fermentor Bioflo III
2- Pump to cell suspension recirculation
3- Magnetizer 4- Magnets
5- Cell suspension/culture medium
A control experiment (CE) was made without the application of MF and with cell recycling, under the same conditions of fermentation with the application of MF. After that three fermentations were made by varying the time of application of CM at 24, 48 or 72 h. The magnets were placed at a distance of 5 mm of tube recycle and MF was 20 mT (200 Gauss). The cell recycling was done by using a peristaltic pump (Anko 913 MITY Flex, USA) and the speed of cell recycling was 5.2 cm/s.
Analytical Determinations
Biomass concentration was determined using HACH spectrophotometer (Mod. DR/4000U) at 600 nm. A standard curve correlating the absorbance and dry mass was made to calculate. The supernatant obtained after centrifugation of the sample was used as a blank to eliminate the interference of the medium. The determination of pH of each sample was done by pH meter
(Digimed, Mod. DM 20 µP, Santo Amaro, Brazil).
The concentration of glucose was determined using an enzymatic kit and colorimetrically (Bio-Diagnostics). The concentration of GSH was determined using the method of Owens and Belcher (1965).
RESULTS
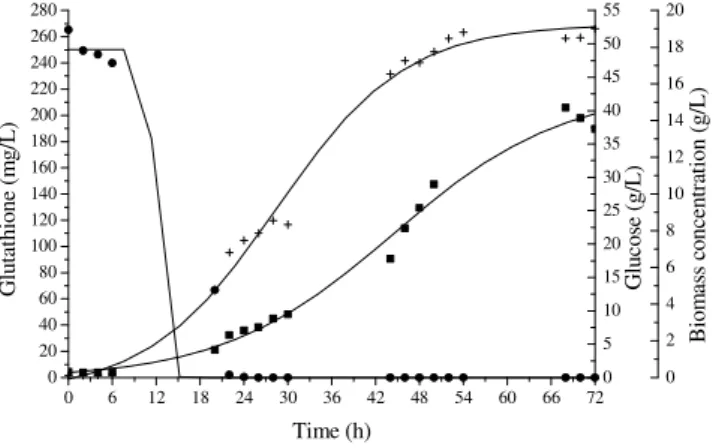
Fig. 2 shows the results obtained during the control experiment (without application of MF).
The pHfinal was 6.5 and the glucose was consumed
within 24 h of fermentation. The maximum cell concentration and GSH were 19.0 g/L (72 h) and 205.8 mg/L (68 h), respectively. These values were used to compare with experiments made with the application of MF. In the second experiment, the application of MF occurred from 0 to 24 h of fermentation. The results are shown in Fig. 3.
0 6 12 18 24 30 36 42 48 54 60 66 72
0 20 40 60 80 100 120 140 160 180 200 220 240 260 280 G lu co se ( g /L ) B io m as s co n ce n tr at io n ( g /L ) G lu ta th io n e (m g /L ) Time (h) 0 5 10 15 20 25 30 35 40 45 50 55 0 2 4 6 8 10 12 14 16 18 20
Figure 2 - Control experiment (without MF): (+) biomass concentration (g/L), (•) glucose (g/L)
and ( ) GSH (mg/L).
0 6 12 18 24 30 36 42 48 54 60 66 72
0 20 40 60 80 100 120 140 160 180 200 220 240 260 280 G li c o se ( g /L ) B io m a s s c o n c e n tr a ti o n ( g /L ) G lu ta th io n e ( m g /L ) Time (h) 0 5 10 15 20 25 30 35 40 45 50 55 0 2 4 6 8 10 12 14 16 18 20
Figure 3 - Experiment with application of MF for 24 h: (+) biomass concentration (g/L), (•)
Santos, L. O. et al. 924
Evidently, glucose was completely consumed by
22 h and the pHfinal was 5.44. The maximum
biomass concentration was 18.6 g/L after 70 h and concentration of GSH was 245.7 mg/L at 72 h. In the experiment with application of MF from 0 to
48 h, the pHfinal was 5.59 and the glucose was
consumed by 21 h. The highest biomass concentration was achieved between 69-70 h (18.8 g/L) and GSH was 259.9 g/L after 72 h of fermentation (Fig. 4).
0 6 12 18 24 30 36 42 48 54 60 66 72
0 20 40 60 80 100 120 140 160 180 200 220 240 260 280 G lu co se ( g /L ) B io m as s co n ce n tr at io n ( g /L ) G lu ta th io n e (m g /L )
Tim e (h)
0 5 10 15 20 25 30 35 40 45 50 55 0 2 4 6 8 10 12 14 16 18 20
Figure 4 - Experiment with application of MF for 48 h: (+) biomass concentration (g/L), (•)
glucose (g/L) and ( ) GSH (mg/L).
Figure 5 shows the results with application of 72 h of MF. The glucose was consumed until 26 h of
fermentation and pHfinal was 6.02. The biomass
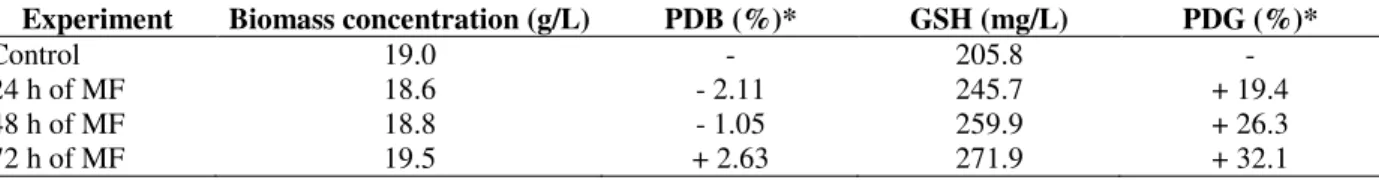
concentration was 19.5 g/L and the highest concentration of GSH was 271.9 mg/L after 70 h of fermentation. Table 1 shows the percentage of difference in biomass concentration (PDB) and the percentage of difference in GSH concentration
(PDG) in relation to the control experiment. The highest values of biomass concentration and GSH for each test were used to compare the results. With the application of magnetic fields for longer times, best results were achieved. In relation to the biomass concentration with only 72 h of application of MF, a small stimulatory effect in relation to the control experiment was observed.
0 6 12 18 24 30 36 42 48 54 60 66 72 0 20 40 60 80 100 120 140 160 180 200 220 240 260 280 G lu co se ( g /L ) B io m as s co n ce n tr at io n ( g /L ) G lu ta th io n e (m g /L ) Time (h) 0 5 10 15 20 25 30 35 40 45 50 55 0 2 4 6 8 10 12 14 16 18 20
Figure 5 - Experiment with application of MF for 72 h: (+) biomass concentration (g/L), (•)
glucose (g/L) and ( ) GSH (mg/L).
Table 1 - Results of percentage of difference in biomass concentration (PDB) and the percentage of difference in
GSH concentration (PDG).
Experiment Biomass concentration (g/L) PDB (%)* GSH (mg/L) PDG (%)*
Control 19.0 - 205.8 -
24 h of MF 18.6 - 2.11 245.7 + 19.4
48 h of MF 18.8 - 1.05 259.9 + 26.3
72 h of MF 19.5 + 2.63 271.9 + 32.1
DISCUSSION
Results showed that the time of application of magnetic fields influenced the concentrations of biomass and GSH produced by the yeast. In the experiments with 24 or 48 h of application of MF, the values of PDC were small and could be due to errors inherent in the process; the application of MF had no effect for the biomass concentration. However, for GSH concentration in all the experiments, stimulatory effects, ranging from 19.4 to 32.1% were observed, which was the
highest value was achieved with the
implementation of the MF throughout the fermentation (72 h).
The advantage of the application of MF with the use of magnets is the cell recycling, because this system makes it easy to scale-up. According to
Alvarez et al. (2006), several MF generator
devices have been developed to study the biological effects of MF on biological materials. Although, the application on industrial scale is very difficult, due to the MF devices generator be designed to cover all or most part of the fermentor and certainly, this is technically and economically unviable for application on larger volumes. The apparatus used in this study, i.e., the medium of fermentation containing the cells was recycled through stainless steel tube insert between the
magnet prisms, which could be easily
implemented on industrial scale.
Regarding the biomass concentration S. cerevisiae,
some authors have observed stimulatory effects using others MF and exposure times. Picho and Povalyaeva (1996) achieved 12% increase in biomass concentration of 100 mT for 0.67 h, which was also by Mehedintu and Berg (1997)
25% (0.2 mT and 10 h), Motta et al. (2001) 1.84%
(220 mT and 24 h), Zapata et al. (2005) 14.4% using 0.002 mT for 30 s.
Muniz et al. (2007) studied the growth of S.
cerevisiae DAUFPE-1012 when exposed to MF (220 mT). The biomass growth rate increased 2.5 times in relation to un-exposed culture.
In the literature, only one work has been reported the application of MF for the production of GSH by fermentation. Santos et al. (2010) study the
effect of MF on GSH production by S. cerevisiae
ATCC 7754. In all experiments, the amount of biomass produced was higher than in control experiments (CE). The highest GSH (340.0 mg/L)
and biomass (16.3 g/L) were obtained using MF induction and these results were 39.0% and 19.6% higher than in the CE, respectively.
In this work an increase of 32% was a considerable a good value, because it was an intracellular product.
CONCLUSIONS
The results of this work were important and showed that the MF influenced the cell growth of
S. cerevisiae. With the implementation of MF using magnets, stimulating effects were observed for the production of GSH and biomass. The highest cell concentrations (19.5 g/L) and GSH (271.9 mg/L) were achieved with the application of MF during the 72 h of fermentation, representing an increase 2.63% and 32.1% in relation to control experiment.
REFERENCES
Alegre RM, Rigo M, Joekes I. Ethanol fermentation of a diluted molasses medium by Saccharomyces cerevisiae immobilized on chrysotile. Braz Arch Biol Technol. 2003; 46: 751-757.
Alvarez DC, Pérez VH, Justo OR, Alegre RM. Effect of the extremely low frequency magnetic field on nisin production by Lactococcus lactis subsp. lactis using cheese whey permeate. Process Biochem. 2006; 41: 1967-1973.
Binninger DM, Ungvichian V. Effects of 60 Hz AC magnetic fields on gene expression following exposure over multiple cell generations using
Saccharomyces cerevisiae. Bioelectrochem. Bioenerg. 1997; 43: 83-89.
Fan X, He X, Guo X, Qu N, Wang C, Zhang B. Increasing glutathione formation by functional expression of the γ-glutamylcysteine synthetase gene in Saccharomyces cerevisiae. Biotechnol Lett. 2004; 26: 415-417.
Fologea D, Vassu-Dimov T, Stoica I, Csutak O, Radu M. Increase of Saccharomyces cerevisiae plating efficiency after treatment with bipolar electric pulses. Bioelectrochem Bioenerg, 1998; 46: 285-287. Lei C, Berg H. Electromagnetic window effects on
proliferation rate of Corynebacterium glutamicum. Bioelectrochem Bioenerg. 1998; 45: 261-265.
Santos, L. O. et al. 926
Mehedintu M, Berg H. Proliferation response of yeast
Saccharomyces cerevisiae on electromagnetic field parameters. Bioelectrochem Bioenerg. 1997; 43: 67-70.
Motta MA, Montenegro EJN, Stamford TLM, Silva AR, Silva FR. Changes in Saccharomyces cerevisiae
development induced by magnetic fields. Biotechnol Prog. 2001; 17: 970-973.
Muniz JB, Marcelino M, Motta M, Schuler A, Motta MA. Influence of static magnetic fields on S. cerevisiae biomass growth. Braz Arch Biol Technol.
2007; 50: 515-520.
Owens CWI, Belcher RV. A colorimetric micro-method for the determination of glutathione. Biochem J.
1965; 94: 705-711.
Pichko VB, Povalyaeva IV. Electromagnetic stimulation of microorganism productivity: possible mechanisms. Appl Biochem Microbiol. 1996; 32: 425-428.
Santos LO, Alegre RM, Garcia-Diego C, Cuellar J. Effects of magnetic fields on biomass and glutathione production by the yeast Saccharomyces cerevisiae. Process Biochem. 2010; 45: 1362-1367.
Wen S, Zhang T, Tan T. Utilization of amino acids to enhance glutathione production in Saccharomyces cerevisiae. Enzyme Microb Technol. 2004; 35: 501-507.
Wen S, Zhang T, Tan T. Optimization of the amino acid composition in glutathione fermentation. Process Biochem. 2005; 40: 3474-3479.
Wu G, Fang Y, Yang S, Lupton JR, Turner ND. Glutathione metabolism and its implications for health. J Nutr. 2004; 134: 489-492.
Zapata JE, Hoyos M, Moreno G. Acción de un campo magnético sobre un cultivo aireado de
Saccharomyces cerevisiae. Interciencia. 2005; 30: 409- 413
Zapata JE, Moreno G, Márquez EJ. Efectos de los campos magnéticos sobre el crecimiento de
Saccharomyces cerevisiae. Interciencia. 2002; 27: 544- 550.
Zhang T, Wen S, Tan T. Optimization of the medium for glutathione production in Saccharomyces cerevisiae. Process Biochem. 2007; 42: 454-458.