Printed version ISSN 0001-3765 / Online version ISSN 1678-2690 http://dx.doi.org/10.1590/0001-3765201520140231
www.scielo.br/aabc
Tropane alkaloids and calystegines as chemotaxonomic markers in the Solanaceae
ALINE G.S. PIGATTO1
, CAROLINA C. BLANCO2
, LILIAN A. MENTZ1
and GERALDO L.G. SOARES1
1
Programa de Pós-Graduação em Botânica, Universidade Federal do Rio Grande do Sul, Campus do Vale, Av. Bento Gonçalves, 9500, Bairro Agronomia, 91501-970 Porto Alegre, RS, Brasil 2
Programa de Pós-Graduação em Ecologia, Laboratório de Ecologia Quantitativa, Universidade Federal do Rio Grande do Sul, Campus do Vale, Av. Bento Gonçalves, 9500, Setor 4, Prédio
43422, Sala 205, Bairro Agronomia, 91501-970 Porto Alegre, RS, Brasil
Manuscript received on June 10, 2014; accepted for publication on February 20, 2015
ABSTRACT
This study assessed the occurrence and distribution of tropane alkaloids and calystegines in genera of the family Solanaceae to identify patterns of distribution and make evolutionary inferences. A database of tropane alkaloids and calystegines occurrences was constructed from the results of a search of scientific websites and a hand search of periodicals. The terms “Solanaceae”, “tropane alkaloids”, and “calystegines” were used as index terms for a full-text article search unrestricted by date of publications. The number of occurrence and chemical diversity indices were calculated and cluster analysis and principal components analysis were performed. Overall, 996 occurrences were reported, 879 of tropane alkaloids (88.3%) and 117 of calystegines (11.7%). The calystegines were significantly more relevant than tropane alkaloids for characterization of distinct groups of genera on both analyses performed here. This corroborates the trend toward a chemical dichotomy observed on database analysis and somewhat reinforces the correlation between geographic distribution and occurrence of secondary metabolites, as the presence of calystegines alone (without tropane alkaloids) was only reported in genera that have South America as their center of diversity.
Key words: chemical diversity, number of occurrence, geographic distribution, multivariate analysis, Solanaceae.
Correspondence to: Aline Grohe Schirmer Pigatto E-mail: [email protected]
INTRODUCTION
Solanaceae Juss. is one of the largest and most important families of flowering plants, and major crop plants species such as Solanum tuberosum L., Solanum lycopersicum L., Solanum melongena L., and Capsicum annum L. belong to this taxa. Several species of pharmaceutical interest due to their secondary metabolites (i.e. Atropa belladonna
L., Hyoscyamus niger L., and Datura stramonium L.), species of economic relevance (i.e. Nicotiana tabacum L.) and toxic species (i.e. Nicotiana glauca Graham) are also classified in this cosmopolitan family. The greatest species diversity of Solanaceae is observed in the Americas (Olmstead et al. 2008) and according to Hunziker (2001) the center of diversity of this taxa is in South America.
known at the time, into two tribes. Two decades later, in 1873, Bentham and Hooker proposed a new division of 67 genera into five tribes. In the late 19th century, Wettstein was the first to divide the Solanaceae into subfamilies: the Solanoideae and Cestroideae, comprising three and two tribes respectively. Two additional classifications were proposed in the 20th century. In 1979 and 1991, D’Arcy added the Nolanoideae subfamily to the two subfamilies proposed before. In 1987, Tétényi proposed a classification based on chemical characteristics, dividing the family into three subfamilies based on the occurrence of alkaloids and steroids. The author stressed that the validity of the chemical pattern is based on the biosynthetic pathways of these substances, rather than on their isolated occurrences.
Two proposed classifications are currently accepted. The first, proposed by Hunziker (2001) and based on morphological and chemical criteria, comprises approximately 2300 species in 92 genera distributed across the subfamilies Solanoideae, Cestroideae, Juanulloideae, Salpiglossoideae, Schizanthoideae, and Anthocercidoideae. The second, a more recent proposal, was presented by Olmstead et al. (2008) in a molecular study conducted on a sample of 89 genera and 190 species. The authors proposed seven subfamilies: Solanoideae, Cestroideae, Nicotianoideae, Petunioideae, Schizanthoideae, Goetzeoideae, and Schwenckioideae. Both proposals agree that Solanoideae is the most derived subfamily in relation to the Cestroideae.
The wealth of information available on the secondary metabolites produced by Solanaceae species may be used to elucidate taxonomic issues at the subspecies, species, or even genus level. Alkaloids and steroid derivatives (including steroidal alkaloids) are known to be the main secondary metabolite classes in the Solanaceae. Among the nitrogen-containing secondary metabolites, the tropane alkaloids (TAs) and
calystegines (CAs) exhibit a pattern of distribution and frequency of occurrence that establish them as chemotaxonomic markers in the Solanaceae (Schimming et al. 1998, Hunziker 2001, Griffin and Lin 2000).
TAs are among the earliest active pharma-ceutical ingredients used by man: the first scientific studies of a TA - namely atropine, isolated from Atropa belladonna L. - were published in 1809 (Eich 2008). The broad pharmacological effect profile of this class of compounds includes mydriatic, antiemetic, antispasmodic, and bronchodilator activity (Grynkiewicz and Gadzikowska 2008). The calystegines, in turn, were only discovered in the 1980s, when a group of French researchers isolated calystegine A3, B1, and B2 from the roots of Calystegia sepium R.Br. (Convolvulaceae) (Tepfer et al. 1988). Research interest in the CAs is on the rise, particularly in view of their potential antiviral, anticancer, and antidiabetic effects (Dräger 2004).
CAs, which are nonesterified polyhydroxylated nortropane alkaloids whose structure consists solely of the tropane ring and a varying number of hydroxyl substituents (three, four, or five) (Dräger 2004).
It is believed that elucidation of the pattern of TA and CA distribution in the Solanaceae may aid in the understanding of the subdivisions of this family and its geographic distribution patterns. Within this context, the present study sought to construct a database of the occurrences of TAs and CAs in Solanaceae species and ascertain whether the patterns of distribution of these compounds corroborate the phylogenetic classification proposed by Olmstead et al. (2008) and are associated with geographic distribution. Furthermore, evolutionary inferences shall be made whenever possible.
MATERIALS AND METHODS
dataBase
A database containing information on the occurrence of TAs and CAs in Solanaceae was constructed using the method proposed by Gottlieb (1996) and updated by Santos et al. (2010). A wide-range review of the literature was carried out by means of a search of online databases (ISI Web of Science and Chemical Abstracts) and a hand search of relevant journals. The keywords “Solanaceae”, “tropane alkaloids”, and “calystegines” were used as search terms. The full text of all articles was analyzed, and the search was unfiltered by date of publication. The Lounasmaa and Tamminen (1993) review was used as a basis for pre-1992 research.
Occurrences were tabulated by struc-tural class. TAs were defined as esters of 3α-hydroxytropane with aliphatic acids, esters of 3α,6β- or 3α,7β-dihydroxytropane, esters of 3α,6β- or 3α,7β-trihydroxytropane, esters of 3α-hydroxytropane with arylpropionic acids, esters of 6β,7β-epoxy-3α-hydroxytropane, esters of 3β-hydroxytropane, and their rare dimeric
and trimeric forms. The CAs of interest were trihydroxynortropanes, tetrahydroxynortropanes and pentahydroxynortropanes.
numBerof oCCurrenCes (NO) and diversity index (DI)
The NO and the DI were calculated as reported by Santos et al. (2010). The NO was defined as the sum of all TA and CA structural types found in each of the studied species. The number of occurrences is an indicator of the degree of importance of a certain category of metabolites within a given taxon (Gottlieb et al. 1996) thus providing a snapshot of the trend toward production of these compounds.
The DI, a rate that expresses the frequency of distribution of a biosynthetic class (Silva 1988), was obtained by multiplying the NO by the number of structural types and dividing the result by the number of species studied. The NO and DI were calculated first for the sampled genera and then for the tribes as proposed in the Olmstead et al. (2008) classification, and, finally, plotted onto the Solanaceae phylogeny proposed by the same author. These indexes were also plotted onto the Solanaceae phylogeny proposed by the same author.
GeoGrapHiC distriBution
Data on the core center of diversity for TA- and/ or CA-producing Solanaceae genera were obtained from Hunziker (2001). Genera were organized jointly by geographic distribution and division into subfamilies, according to the classification scheme proposed by Olmstead et al. (2008). Depending on their centers of diversity, genera were categorized as cosmopolitan, South American, North American, Eurasian, Asian, and Oceanic.
statistiCal analyses
frequently occurring TAs and CAs (variables), using the Euclidean distance between sampling units and the minimum variance clustering method. Cluster robustness was then assessed by the bootstrap method (Pillar 1999). For principal components analysis (PCA), we used the correlation between variables to assess the relative contributions of TAs and CAs towards a definition of the genus clustering patterns in terms of the frequency of TA and CA occurrence.
RESULTS AND DISCUSSION
dataBase, numBerof oCCurrenCesand diversity index
The occurrence of TAs and CAs in 29 genera of Solanaceae is shown in Table I. The total number of occurrences was 996, 879 instances of TAs (88.3%) and 117 of CAs (11.7%). TAs were found in 24 genera, with Anthocercis Labill., Brugmansia Pers., Datura L., Hyoscyamus L., and Solandra Swartz accounting for 65.4% of occurrences. CAs were found in 14 genera, with Hyoscyamus L., Lycium L., Solanum L., Physalis L., and Scopolia Jacq. accounting for 62.6% of occurrences.
We identified occurrences of 107 compounds in the TA class. The esters of 3α,6β- or 3α,7β-dihydroxytropane (group TA2 in Table I) were the most diverse group (29 compounds), whereas esters of 3α-hydroxytropane with phenylpropanoid acids (group TA4 in Table I), comprising 16 different compounds, were the most commonly occurring group (261 occurrences). Compounds in this group, particularly hyoscyamine and atropine, were found in 70 species of 17 genera. Scopolamine, an ester of 6β,7β-epoxy-3α-hydroxytropane (group TA5 in Table I), was also quite common, with 80 occurrences in 18 genera.
Overall, 17 CAs were identified: five trihydro-xynortropanes, nine tetrahydroxy nortropanes, and three pentahydroxynortropanes.
Table I shows a broad range of frequencies of occurrence of TAs and CAs among the various
Solanaceae genera: some had extremely high frequencies of occurrence, such as Datura L., Brugmansia Pers., Hyoscyamus L., and Anthocercis Labill., with 246, 95, 91, and 84 occurrences of TAs respectively, whereas other genera had very low frequencies, such as Nicandra Adans. and Capsicum L. (with only two and three occurrences of CAs, respectively).
It is noteworthy that the widespread use and medicinal relevance of some species have prompted more in-depth studies of these species, which in turn leads to isolation and knowledge of a greater number of active metabolites. Examples include Datura stramonium L., which is one of the most widely studied plant species from a phytochemical standpoint (Berkov et al. 2005) and from which more than 60 different TAs have been isolated (Bazaoui et al. 2011). In an attempt to mitigate any discrepancies brought about by calculation of the number of occurrences alone, we calculated the diversity index of ornithine-derived alkaloids (TAs and CAs) (Table I). This index expresses the frequency of occurrence of a biosynthetic class (Silva et al. 1988) and, unlike the number of occurrence, takes into account the number of species studied, thus somewhat obviating the bias caused by the lack of standardization of the frequency of occurrence. However, the DI must still be interpreted with caution, as it may reflect aspects not directly related to chemical diversity. The genera of the tribe Datureae provide a good example of this phenomenon.
TABLE I
Number of occurrence (NO) and diversity index (DI) of tropane alkaloids and calystegines of the Solanaceae subfamilies
and genera (based on Olmstead et al. 2008), according to structural types.
Subfamilies/ Genera
Tropane alkaloids
Total DIk
Calysteliges TA1a
TA2b TA3c
TA4d TA5e
TA6f TA7g
CAh CBi
CCj
Total DIl Solanoideae
Anisodus Link 3 5 0 8 6 1 0 23 38.0 0 0 0 0 0.0
Atropa L. 1 3 0 16 8 1 2 31 31.0 3 4 0 7 14.0
Atropanthe Pascher 0 0 0 2 2 0 0 4 8.0 0 0 0 0 0.0
Brugmansia Pers. 10 27 15 15 14 14 0 95 143.0 0 0 0 0 0.0
Capsicum L. 0 0 0 0 0 0 0 0 0.0 0 2 1 3 6.0
Datura L. 27 63 27 61 38 26 4 246 144.0 1 1 0 2 2.0
Hyoscyamus L. 14 5 0 34 26 8 4 91 50.0 9 9 0 18 7.0
Latua Phil. 0 0 0 5 1 0 0 6 6.0 0 0 0 0 0.0
Lycium L. 0 0 0 0 0 0 0 0 0.0 4 8 3 15 45.0
Mandragora L. 1 1 0 4 3 0 2 11 18.0 2 5 0 7 7.0
Nicandra Adans. 0 0 0 0 0 0 0 0 0.0 0 2 0 2 2.0
Physalis L. 4 0 0 0 0 3 0 7 5.0 3 6 1 10 10.0
Physochlaina G.Don 2 9 0 9 8 0 2 30 25.0 0 0 0 0 0.0
Przewalskia Maxim. 1 1 0 2 2 0 0 6 24.0 0 0 0 0 0.0
Salpichroa Miers 1 0 0 1 0 1 0 3 9.0 0 0 0 0 0.0
Solandra Sivartz 20 0 0 23 6 10 0 59 39.0 0 0 0 0 0.0
Scopolia Jacq. 3 0 0 8 7 1 0 19 25.0 3 7 1 11 17.0
Solanum L. 0 0 0 0 0 0 0 0 0.0 5 16 0 21 5.0
Withania Pauq. 2 0 0 0 0 1 0 3 6.0 1 4 1 6 12.0
Nicotianoideae
Anthocercis Labill 6 16 8 30 17 7 0 84 56.0 0 0 0 0 0.0
Anthotroche Endl. 4 0 0 13 3 0 0 20 20.0 0 0 0 0 0.0
Crenidium Haegi 1 1 0 4 3 0 0 9 36.0 0 0 0 0 0.0
Cyphanihera Miers 10 10 2 15 13 1 0 51 44.0 0 0 0 0 0.0
Duboisia RBr 9 1 0 9 6 1 2 28 56.0 1 3 2 6 18.0
Gramnosolen Haegi 2 2 0 2 2 0 0 8 32.0 0 0 0 0 0.0
Symonanthus Haegi 1 3 1 0 2 1 0 8 40.0 0 0 0 0 0.0
Petunioideae
Brunfelsia L. 0 0 0 0 0 0 0 0 0 1 3 1 5 15.0
Nierembergia Ruiz et Pav. 1 0 0 0 0 1 0 2 4.0 2 2 0 4 12.0
Schizanthoideae
Schizanthus Ruiz et Pav. 5 16 0 0 0 0 14 35 21.0 0 0 0 0 0.0
Total 128 163 53 261 167 77 30 879 35 72 10 117
a Esters of 3α-hydroxytropane with aliphatic acids
b Esters of 3α 6β- or 3α,7β hydroxytropane
c Esters of 3α 6β- 7β -trihydroxytropane
d Esters of of 3α-hydroxytropane with phenyipropanoid acids
e Esters 6β, 7β- epoxy- 3α,hydroxytropane
f Esters of 3β-hydroxytropane
g
Dimeric and trimeric forms h
Trihydroxynortropane i
Tetrahydroxynortropane j
Pentahydroxynortropane k
Diversity index of tropane alkaloids l
two genera. However, in this particular case, the DI also reflects the research effort put into these two genera, both of which are relevant sources of important pharmacologically active substances.
The DI of the subfamily Nicotianoideae, represented in this study by the tribe Anthocercideae, can also be called in question. Analysis of the frequency of TA occurrence shows a broad range of values: from eight occurrences of TAs each in the Grammosolen and Symonanthus genera, to 84 occurrences in the Anthocercis genus (Table I). However, analysis of the DI yielded values of 32 and 56, respectively, which demonstrates the importance of this index.
The diversity index of CAs observed in this tribe – 18 - also merits analysis. Although this value represents the DI for the tribe as a whole, it only concerns the genus Duboisia, the only one of the seven Anthocercideae genera in which CAs were detected.
Another important aspect that merits discussion is the trend toward correlation between TA and/or CA synthesis pathways and the centers of diversity of each genus. Overall, the broader the latitudinal range of a cluster (with South America as the starting point), the greater is the diversity of secondary metabolite classes. Therefore, South American genera preferably produce CAs alone or CAs and TAs. South American genera with a more restricted range, such as Nicandra and Capsicum produce CAs alone. Brunfelsia, a genus from South and Central America, also contain CAs alone. Conversely, species of Datura, a genus from Central and North America, contain TAs and CAs alike.
Eurasian genera also exhibit production of TAs and CAs alike, just as Datura, whereas exclusively Asian genera product TAs alone, as do all Oceanic genera analyzed, other than Duboisia.
The genera Schizanthus and Withania did not follow the trends toward TA and CA occurrence found in other genera with a similar geographic distribution. However, it should be noted that these
two genera are distributed over more restricted ranges. Schizanthus is endemic to the region of Chile, whereas Withania is an Old World genus, found mostly by the Mediterranean.
Based on our comparison of the patterns of occurrence of these ornithine-derived alkaloids and the phylogenetic scheme proposed by Olmstead et al. (2008), we may suggest that the TA synthesis pathway is more basal than the CA pathway, as the occurrence of tropane alkaloids has been reported from the most basal genus of the Solanaceae, Schizanthus, to the most derived Solanoideae genera. Conversely, in the Solanoideae family, and particularly in the Solaneae tribe, which is considered to be more derived, only calystegines were detected.
Chemical data can contribute to the elucidation of relationships among genera and two examples were observed during the course of this study: Nicandra and Latua, both of which are monotypic genera with a highly restricted range. The former is native to South America, most specifically from the Peruvian Andes to Argentina, and the latter is endemic to Southern Chile.
In the phylogeny proposed by Olmstead et al. (2008), Nicandra is placed into an as-yet unresolved branch, near genera that mainly produce TAs of different structural classes. However, as other South American genera, Nicandra has only been reported to contain CAs. According to D’Arcy (1979) the Nicandra genus is related to Solanum and Physalis, two genera remarkable for their frequency of CA occurrence and that are located on more derived branches of the Olmstead phylogeny.
Jaboroseae tribe of the Solanoideae subfamily, due to the presence of tropane alkaloids, among
other characteristics. In the Olmstead phylogeny, the genus Jaborosa lies close to Latua, supporting these previous findings.
Cluster analysisand prinCipal Components analysis
On qualitative analysis of the database, we noticed a clear trend toward a correlation between the
geographic distribution of genera and the joint distribution of TAs and CAs. To corroborate these
potential patterns, we conducted multivariate
analysis, that is, exploratory analysis that provides summary insight into the complexity of the
observed information so as to enable visualization and ratification of suggested patterns (Valentin
2000).
We also tested the significance of the patterns observed on multivariate analysis by means of the bootstrap method, which enables testing of group sharpness in cluster analysis and assessment of the significance of principal components in PCA (Pillar 1999).
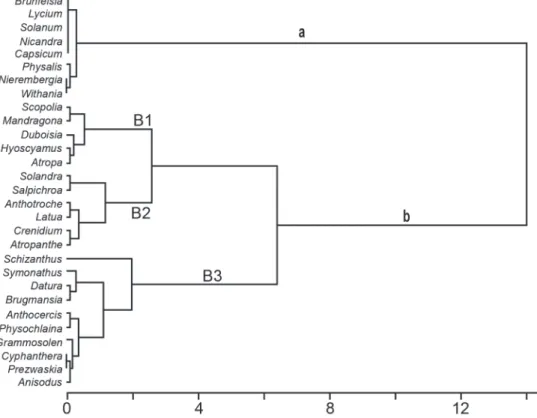
Cluster analysis suggested the formation of two distinct groups of genera (P(G°≤G*) = 0.381 – probability after bootstrap resampling with 10,000 iterations; Pillar 1999) in terms of the most frequently occurring TAs and CAs (Fig. 1).
Group A comprises the New World genera Brunfelsia, Lycium, Solanum, Nicandra, Capsicum, Physalis, and Nierembergia and the Eurasian genus Withania. All are in the subfamily Solanoideae, except for Nierembergia, which is in the subfamily Petunioideae. Solanum and Lycium, despite their cosmopolitan distribution, have America -
particularly South America for the genus Solanum
- as their center of diversity and the center of their range. The genera Capsicum, Lycium, Nicandra and Solanum have in common the exclusive presence of CAs, whereas species in the genera Nierembergia, Physalis and Withania also produce TAs of the type TA1 and TA6 (Table I).
It is noteworthy that CAs were isolated from species of the subfamilies Petunioideae, Nicotianoideae, and Solanoideae. Furthermore, the greatest frequency of occurrence was found in the more derived genera, which tend to specialize in the production of these compounds.
Group B shows evidence of three distinct clusters: B1 comprises the Eurasian genera of the Solanoideae subfamily - Scopolia, Mandragora, Hyoscyamus and Atropa - and the Australian genus Duboisia, of the family Nicotianoideae. Cluster B2 comprises the Solanoideae genera Solandra, Salpichroa and Latua (South American), the genus Atropanthe (exclusively Asian), and the Australian genera Anthotroche and Crenidium, of the Nicotianoideae.
In cluster B3, Schizanthus (Schizanthoideae) lies relatively far from the remaining genera, probably due to the occurrence of dimeric and trimeric forms of the compounds of interest, which are exclusive to this genus; Symonanthus belongs to the subfamily Nicotianoideae, whereas Datura and Brugmansia belong to the Solanoideae. This cluster also includes the Australian genera of the Nicotianoideae subfamily, Anthocercis, Physochlaina, Gramnosolen and Cyphanthera, and the Asian genera of the Solanoideae, Anisodus and Przewalskia.
The use and interpretation of data on secondary metabolites to elucidate taxonomic issues is beset by two major challenges. The first is the construction of a reliable database; the second is the use of statistical methods that can prove and validate data (Alvarenga et al. 2001).
Indeed, statistical analysis has been used in previous chemotaxonomy studies as a valuable tool
for analysis of the correlation between chemical and taxonomic data; such studies include Depege et al. (2006), Alvarenga et al. (2001) and Halinski et al. (2011). In the present study, multivariate analysis at least partly elucidated correlations between the occurrence of secondary metabolites and taxonomic and phytogeographical aspects.
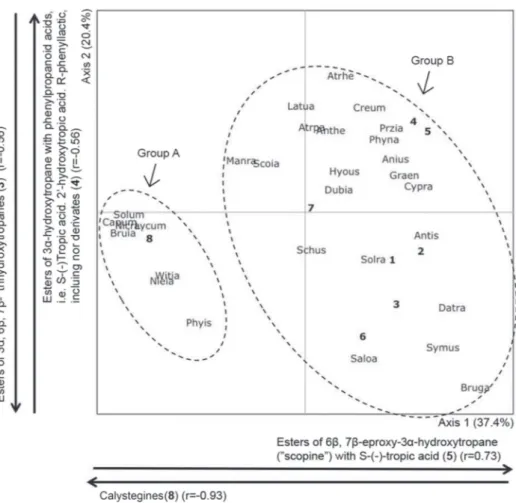
The diagram generated by PCA (Fig. 2) represents 57.8% of total variation and shows that the pattern of occurrence of two sharply distinct groups of genera (defined by the first principal component – axis 1) correlates highly with the presence of CAs (represented by number 8) (r = -0.93) (Group A) and esters of 6β,7β-epoxy-3α-hydroxytropane (represented by number 5) (r = 0.73) (Group B). Furthermore, within Group B, there was a clear trend toward the formation of two subgroups (defined by the second principal component – axis 2) with respect to the presence of 3α,6β,7β-trihydroxytropanes (represented by number 3) and esters of 3α-hydroxytropane with phenylpropanoid acids (represented by number 4), with r = -0.56 and r = 0.56, respectively.
Several authors have provided evidence of the importance of TAs as chemotaxonomic markers for the Solanaceae (Hunziker 2001, Griffin 2000), the Datureae tribe (Doncheva et al. 2006), the genus Schizanthus (Eich 2008), and the Convolvulaceae genus Merremia Dennst. ex Endl. (Jenett-Siems et al. 2005). Likewise, the CAs have been described as chemotaxonomic markers in the Convolvulaceae and Solanaceae (Schimming et al. 1998).
distribution of these compounds can be observed, as noted in Database, Number of Occurrences and Diversity Index.
In a 2003 study designed to reconstruct phylogenies and map and interpret the distribution of secondary metabolites, including TAs in the Solanaceae, Wink (2003) found that TAs are produced in a number of apparently unrelated taxa, and that the occurrence of these compounds does not represent a consistent characteristic, thus isolated use of this criterion might lead to misguided clustering. Wink (2003) argues that different biosynthetic pathways for these compounds evolved independently and that their occurrence in unrelated taxa may be regarded as a result of convergent evolution.
In the present study, we sought to carry out a joint analysis of TAs and CAs to ascertain the
extent to which these compounds contribute to the chemotaxonomy of the Solanaceae. We found that the CAs were significantly more relevant as a variable for characterization of groups of genera, as shown both by cluster analysis and principal components analysis (Fig. 1 and Fig. 2). This
is consistent with the trend toward a chemical dichotomy observed during data analysis, and reinforces, to a certain extent, the association between geographic distribution and occurrence of chemical compounds, since CAs were found to occur only in genera whose center of diversity was
South America.
RESUMO
Este estudo analisou a ocorrência e a distribuição de alcaloides tropânicos e calisteginas em gêneros da família Solanaceae com o objetivo de identificar padrões de distribuição e fazer inferências evolutivas. Um banco de dados com ocorrências de alcaloides tropânicos e calisteginas foi elaborado a partir dos resultados de um levantamento em websites científicos e pela consulta direta em periódicos. Os termos “Solanaceae”, “alcaloides tropânicos” e “calisteginas” foram utilizados como indexadores para a busca de artigos na íntegra, sem restrição na data das publicações. O número de ocorrências e o índice de diversidade química foram calculados e análises de agrupamentos e de componentes principais foram realizadas. Um total de 996 ocorrências foi registrado, 879 de alcaloides tropânicos (88,3%) e 117 de calisteginas (11,7%). As calisteginas foram significativamente mais relevantes que os alcaloides tropânicos para a caracterização de distintos grupos de gêneros em ambas as análises realizadas. Isso corrobora a tendência de dicotomia química observada na análise do banco de dados, além de reforçar, de certa forma, a correlação entre a distribuição geográfica e a ocorrência de metabólitos secundários, visto que a presença exclusiva das calisteginas (sem alcaloides tropânicos) ocorre somente em gêneros cujo principal centro de diversidade é a América do Sul.
Palavras-chave: Solanaceae, diversidade química, número de ocorrências, análise multivariada, distribuição geográfica.
REFERENCES
alvarenGa SAV, ferreira MJP, emerenCiano vp and CaBrol-Bass d. 2001. Chemosystematic studies of natural compounds isolated from Asteraceae: characterization of tribes by principal component analysis. Chemometr Intell Lab Syst 56: 27-37.
BaCCHi em. 2002. Alcaloides tropânicos. In: Simões CMO (Org), Farmacognosia, da planta ao medicamento, 4a
ed., Porto Alegre/Florianópolis: UFRGS/UFSC, p. 667-687. Bazaoui ae, Bellimam ma and soulaymani a. 2011.
Nine new tropane alkaloids from Datura stramonium L. identified by GC/MS. Fitoterapia 82: 193-197.
Berkov s, donCHeva t, pHilipov s and alexandrov k. 2005. Ontogenetic variation of the tropane alkaloids in
Datura stramonium. Biochem Syst Ecol 33: 1017-1029. d’arCy wG. 1979. The classification of the Solanaceae.
In: Hawkes JG, Lester RN and Skelding AD (Eds), The
Biology and Taxonomy of the Solanaceae, London: Academic Press, London, p. 3-48.
depeGe C, lizzani-Cuvelier l, loiseau m, CaBrol -Bass d, ferreiraMJP, BrantAJC, militão JSLT
and emerenCiano vp. 2006. Chemotaxonomic study of Artemisia. An approach based on multivariate statistics of skeletal types retrieved from essential oils. Bol latinoam Caribe Plantas Med Aromát 5: 72-83.
donCHeva t, Berkov s and pHilipov s. 2006. Comparative study of the alkaloids in tribe Datureae and their chemosystematic significance. Biochem Syst Ecol 34: 478-488.
dräGer B. 2004. Chemistry and biology of calystegines. Nat Prod Rep 21: 211-223.
eiCH ee. 2008. Solanaceae and Convolvulaceae: secondary metabolites, Berlin: Springer, 637 p.
GottlieB or, BorinMRMBand kaplanMAC. 1996. Biodiversidade: um enfoque químico-biológico, Rio de Janeiro: UFRJ, 267 p.
Griffin wJ and lin Gd. 2000. Chemotaxonomy and geographical distribution of tropane alkaloids. Phytochemistry 53: 623-637.
GrynkiewiCz G and Gadzikowska m. 2008. Tropane alkaloids as medicinally useful natural products and their synthetic derivates as new drugs. Pharmacol Rep 60: 439-463.
Halinski lp, szafranek J and stepnowski p. 2011. Leaf cuticular n-alkanes as markers in the chemotaxonomy of the eggplant (Solanum melongena) and related species. Plant Biol 13: 932-939.
Hunziker at. 2001. Genera Solanacearum: the genera of Solanaceae illustrated, arranged according to a new system, Ruggell: Gantner, 500 p.
Jenett-siems k et al. 2005. Chemotaxonomy of the pantropical genus Merremia (Convolvulaceae) based on the distribution of tropane alkaloids. Phytochemistry 66: 1448-1464.
lounasmaa m and tamminen t. 1993.The tropane alkaloids. In: Brossi A (Ed), The alkaloids, New York: Academic Press 44: 1-114.
olmstead rG, BoHs l, miGid Ha, santiaGo-valentini e, GarCia vf and Collier sm. 2008. A molecular phylogeny of the Solanaceae. Taxon 54: 1159-1181. pillar vd. 1999. How sharp are the classifications? Ecology
80: 2508-2516.
pillar vd. 2011. Multiv software para análise multivariada, testes de aleatorização e autorreamostragem “bootstrap”, Versão Beta 2.90, Porto Alegre: Departamento de Ecologia, Universidade Federal do Rio Grande do Sul. Available at: http://ecoqua.ecologia.ufrgs.br/ecoqua/MULTIV.html. santos MIS, lima HRP and kaplan MAC. 2010.
sCHimminG t, tofern B, mann p, riCHter a, Jenett -siems k, dräGer B, asano n, Gupta mp, Correa md and eiCH e. 1998. Distribution and taxonomic significance of calystegines in the Convolvulaceae. Phytochemistry 49: 1989-1995.
silvaMFG, GottlieB rr and eHrendorfer f. 1988. Chemosystematics of the Rutaceae: suggestions for a more natural taxonomy and evolutionary interpretation of the family. Pl Syst Evol 161: 97-134.
tétényi p. 1987. A chemotaxonomic classification of the Solanaceae. Ann Mo Bot Gard 74: 600-608.
tepfer d, Goldmann a, pamBoukdJian n, maille m, lepinGle a, CHevalier d, dénarié J and rosenBerG C. 1988. A plasmid of Rhizobium meliloti 41 encodes catabolism of two compounds from root exudates of Calystegium sepium. J Bacteriol 170: 1153-1161. valentim Jl. 2000. Ecologia numérica: uma introdução à
análise multivariada de dados ecológicos. Rio de Janeiro: Editora Interciência, 117 p.