http://www.uem.br/acta ISSN printed: 1679-9275 ISSN on-line: 1807-8621
Acta Scientiarum
Doi: 10.4025/actasciagron.v36i4.17892
Light interception, leaf area and biomass production as a function
of the density of maize plants analyzed using mathematical models
Tomás de Aquino Portes and Hyrandir Cabral de Melo*
Laboratório de Fisiologia Vegetal, Departamento de Botânica, Instituto de Ciências Biológicas, Universidade Federal de Goiás, Campus Samambaia, s/n, 74001-970, Goiânia, Goiás, Brazil. *Author for correspondence. E-mail: [email protected]
ABSTRACT. Mathematical models were tested to correlate the leaf area index (LAI) of maize to the percentage of light intercepted by the canopy (% LIC) and this with the total dry matter of aerial parts (TDM), as well with the grain yield (GY). The experiment was conducted in a randomized block design, with four replications. The treatments consisted of hybrid maize at five plant densities: 4.0, 2.66, 2.0, 1.6, and 1.3 plants per m2 (pl m-2). At densities of 4.0 and 2.66 pl m-2, the average LAI and TDM did not differ
among themselves but were significantly higher than those presented at the densities of 2.0, 1.66 and 1.3 pl m-2, which also did not differ among themselves. The number of corncobs per plant (cob pl-1) and GY
behaved similarly. The LAI grew exponentially with the plant density. For all ages of plants, the exponential model fit well with the % LIC values according to the LAI and also fit well to the data of dry mass as a function of % LIC. GY depending on the density fit well to quadratic, exponential straight line and logarithm-modified equations, and the number of cobs per plant depending on the density fit well to hyperbolic and exponential-modified equations.
Keywords: age, corn, radiation, yield.
Interceptação de luz, área foliar e produção de biomassa em função da densidade de
plantas de milho analisados por modelos matemáticos
RESUMO. Modelos matemáticos foram testados a fim de correlacionar o índice de área foliar (LAI) de milho com a porcentagem de luz interceptada pela copa (% LIC) e esta com a massa seca total da parte aérea (TDM), bem como com a produtividade de grãos (GY). O experimento foi instalado em blocos ao acaso, com quatro repetições. Os tratamentos consistiram de um híbrido de milho cultivado em cinco densidades de plantas: 4,0; 2,66; 2,0; 1,6 e 1,3 plantas m-2 (pl m-2). Nas densidades de 4,0 e 2,66 pl m-2 os LAI médios e
as TDM não diferiram entre si, mas foram significativamente superiores àqueles das densidades 2,0; 1,6; 1,3 pl m-2, os quais, nestas densidades, não diferiram entre si. LAI cresceu exponencialmente com a
densidade de plantas. Para todas as idades o exponencial ajustou-se bem ao % LIC em função da LAI. A mesma equação também ajustou-se bem aos dados de matéria seca total em função da % LIC. A GY em função da % LIC foi bem representada pelas equações exponencial, linear e logística. GY em função da densidade ajustaram bem ao quadrático; exponencial linha reta e o logaritmo modificado. O número de espigas por planta em função da densidade ajustou-se o hiperbólico e exponencial modificado.
Palavras-chave: idade, milho, radiação, produtividade.
Introduction
Photosynthetic CO2 fixation by plants responds
immediately to fluctuations in the density of the photosynthetic photon flux (Q), such that the gain of dry mass is closely related to the light utilization ability of plants. This ability, in turn, depends primarily on the leaf area index (LAI) and also the arrangement of leaves in the canopy, the morphology and anatomy of leaves, the sun elevation, changes in the quality or spectral distribution and the multiple reflection of Q within the canopy (BAVEC; BAVEC, 2002; MONTPIED et al., 2009; NOBEL et al. 1993; PATAKAS et al., 2003; STEWART et al., 2003).
According to Nobel et al. (1993), the flux density of photons reaching each level in the tree canopy is considered to be the main factor determining the rate of CO2 assimilation by individual leaves. It has
both the Q absorbed by the leaf canopy and also on its distribution in the culture profile (MONTPIED et al., 2009; NOBEL et al., 1993).
There is a close relationship between biomass production and light interception, a parameter that is mainly determined by LAI (EWERT, 2004; GITELSON et al., 2003; HIROSE, 2005; LINDQUIST et al., 2005). In turn, changes in LAI depend on such factors as climate seasonal variations, water, nutrition (particularly the availability of nitrogen) and, to some extent, increases in atmospheric CO2 concentrations
(DERMODY et al., 2006; KIMBALL et al., 2002). Above a minimal level, at the same Q, the leaf photosynthetic rate of plants grown under shaded conditions is lower than that of plants grown under conditions of full light, whereas the stomatal resistance to CO2 diffusion is higher in relation to full light
(IRMAK et al., 2008; PATAKAS et al., 2003). The lower photosynthetic rates are the result of increasing the resistance of the mesophyll cells to the passage of CO2 (or intracellular resistance), reflecting changes in
the enzymatic apparatus, leaf anatomy and structure of chloroplasts (PATAKAS et al., 2003).
The structure of a canopy culture is important because it modulates the surrounding microenvironment, including the radiant flux density, temperature of the air and soil and also vapor pressure of the air, temperature of the leaves, accumulation of heat in the soil and wind speed (NOBEL et al., 1993). Therefore, the plants in communities are interdependent (IRMAK et al., 2008). Even with regard to biological invasions, the adaptability of a species depends on the environment, particularly the light and nutrient availability, and such plant physiological characteristics as C3 or C4 metabolism (FUNK; VITOUSEK, 2007).
The importance of studying the profile of light penetration in the maize canopy is justified by providing information about how the intercepted light favors the production of biomass and grain and relates to the characteristics of cereal plants in the sense that more light reaches the soil, favoring plants grown in intercropping systems, as in the case of beans in several Brazilian regions (TSUBO; WALKER, 2004).
The objective of this study is use mathematical models to relate the percentage of light intercepted according to LAI, to assess how the light intercepted is related to the dry mass of maize and to quantify the amount of light reaching the ground level in maize plots cultured as different densities.
Material and methods
The experiment was conducted in an area of a dystrophic red-yellow latosol in the experimental field of Embrapa Arroz e Feijão, Goiânia, located at 16° 36'' S and 49° 13'' W and altitude of approximately 800 m.
The experimental design was composed of randomized blocks, with four replications. The treatments consisted of corn sown at five spacings of 1.0, 1.5, 2.0, 2.5, and 3.0 m between rows in populations of 40,000; 26,600; 20,000; 16,000; and 13,300 plants per hectare, respectively. The size of the plots was 10 m in length, with different widths depending on the spacing. We used a hybrid of maize, Agroceres, which is of normal size, reaching an average height of 2.20 m for the canopy during grain filling.
Fertilization (4-30-15 formula) was performed in the furrows at 500 kg hectare-1. The seeds were
sown on December 30, during the full rainy season, and emergence occurred on January 6. The onset of flowering occurred on of February 28, or 52 days after emergence (DAE), and the harvest occurred on May 21 (135 DAE). The rains were regular and were considered normal throughout the crop cycle.
Measurement of flow of photons through the plant canopy: The photosynthetic photon flux density (mol m-2 s-1) was measured on four dates from the
26th day after emergence (DAE) (26, 39, 47, and
53 DAE) using a linear sensor (LI-191 Quantum Line Sensor) connected to a microvoltmeter (both Lambda Instruments Corporation LI).
The measurements were obtained between 12:00 am and 1:00 pm hour above the plant canopy, both at 0.50 m above the ground level and at ground level. Within the maize rows the sensor was positioned at 0.25 m parallel to the first row of corn, and, from second row onward, it was always placed at 0.50 m from the immediately preceding row (Figure 1). At the end was calculated the average for each level readings. The number of positions always depended on the spacing between the rows of corn. For each replicate (plot), the reading above the canopy at 0.50 m and at ground level were obtained immediately after each other, avoiding changes in the photon flux between one reading and another due to the passage of a cloud.
The percentage of radiation intercepted by the corn canopy was calculated by the following equations:
Q (tm)% = [1 - (Qm / Qt)] * 100
(tb)% = [1 - (Qb / Qt)] * 100 for the percentage of radiation intercepted from the top level of the canopy to the soil level. Qt is the radiation reaching the top of the canopy, Qm is the radiation reaching the 0.5 m level, and Qb is the radiation reaching the ground level.
Figure 1. Profile of photosynthetically active radiation (Q) in the corn culture profile. The readings were obtained at the top of the canopy (Qt), at 0.50 m above the ground (Qm) and at the ground level (Qb). The sensors were placed 0.25 m and 0.75 m from the left and parallel to the rows every 0.50 m, depending on the distance between the rows.
The plant dry matter was obtained by randomly harvesting two plants per plot, including the roots, excepting the plants at the edges of the plots and those use to determine the grain yield. The two plants were placed in plastic bags and transported to the laboratory where the roots were discarded and the leaves detached. The leaf areas were measured using an electronic leaf area meter (LI-COR LI 3000) and then placed in paper bags and dried in a forced-ventilation oven at 70°C for 24 hours. The other plant parts, including the stems and flowers, sheaths, and cobs, were also placed in paper bags and dried. The leaf area, in cm2, was transformed into
the leaf area index (LAI), which is presented in m2 of
leaves m-2 of area. The grain yield was obtained by
harvesting a plot formed by two rows of 6 m of length. The useful areas of the plots were 12, 18, 24, 30 and 36 m2 for densities of 1.0, 1.5, 2.0, 2.5, and
3.0 m, respectively.
An analysis of variance was performed using the program Assistat. The normality of errors and homogeneity of variances were analyzed, and the values of F and the treatment means were compared using the Tukey test. Mathematical models fitted to the data were tested using the programs Ajuste and LABFit. The correlation coefficients and the values of F, as shown in the tables, were tested for the model parameters (t test) and analyzed for residues; these results were not shown. We tested linear, quadratic, cubic, exponential, logistic and quadratic exponential models.
Results and discussion
Figure 1 shows the profile of the density of photosynthetically active radiation (Q) in the corn canopy: Qt is the flux density of photons arriving at the top of the culture, Qm is the flux reaching 0.50 m from the ground level, and Qb is the flux reaching the ground.
To vary the density of plants per m2, two
arrangements of the corn plants were used: 1) increasing the distance between the rows and maintaining the number or density of plants per meter within each row, a common situation when you want to use between the furrows for another crop, such as beans in intercropping systems, and 2) maintaining the distance between the rows or within rows and varying only the number or density of plants per meter in a row, a common situation in mass production for silage. The first option was chosen in the present experiment.
Table 1 shows the results of the leaf area index (LAI) and dry matter of aerial parts (TDM) at the five plant densities on the four evaluation dates, the respective quantities of photon flux arriving in the canopy and the percentages intercepted. In general, the LAIS and TDM values obtained at the density of
4 plants per m2 differed from those of the other
densities on all the dates, with LAIS ranging from
0.63 to 3.06 m2 m-2 between 26 and 53 DAE. The
TDM, in turn, ranged from 47.88 to 580.80 g m-2.
Among the densities of 2.00, 1.60 and 1.33 plants m-2, the only difference found was at 39 DAE on
which the TDM at the density of 2.00 pl m-2 was
higher than at the other densities.
The percentage of light intercepted increased gradually according to the time following emergence, increasing from 19.5 to 71.3% for top of the culture to the ground level at a density of 4 plants m-2 (Table 1). In general, at all plant
densities, there was an increase in the percentage of light intercepted over time.
Table 2 presents the mathematical models that best fit the observed light intercepted (Y) as a function of LAI (X) over the four measurement dates. At 26 DAE, the relationship between the percentage of light intercepted and LAI followed an exponential model (r = 0.94 and p ≤ 0.05) (Table 2).
quadratic (r = 0.99 and p ≤ 0.05). However, after the parameters of the models were tested, it was found that the third parameter of the quadratic model and the second parameter of the linear model were not significant. Only the exponential and logistic models met all the criteria, including the significance of the parameters and properly distributed residues. We found that the linear model did not meet all the criteria, whereas Capristo et al. (2007), studying hybrid maize, indicated an increase in biomass throughout the crop cycle using a linear model.
Table 1. The photosynthetic photon flux (Q) (μmol m-2 s-1)
reaching the top of the canopy (Qt), 0.50 m above the ground (Qm), and the soil level (Qb) in a maize crop between 12:00 and 13:00 hour on four dates, the respective values of the radiation transmitted by the canopy between Qt and Qm and between Qt and Qb, and their percentages (%) intercepted with the respective standard deviations. DAE, days after emergence; SPA, spacing; DPL, plant density; LAI, leaf area index and TDM, total dry mass of aerial parts.
Q (μmol m-2 s-1) % Interception
DAE SPA m
DPL Pl m-2
LAI m2 m-2
TDM
g m-2 Qt Qm Qb Qt-Qm Qt-Qb
26 1.0 4.00 0.63a 47.88a 2142 1817 1725 15.2±7.0 19.5±5.5 1.5 2.66 0.54ab 29.28b 2128 1972 1867 7.3±1.0 12.3±3.1 2.0 2.00 0.24b 17.33c 2133 1979 1963 7.2±4.1 8.0±3.9 2.5 1.60 0.17b 13.83c 2113 1970 1957 6.8±1.8 7.4±1.2 3.0 1.33 0.18b 13.00c 2142 2061 2033 3.8±1.9 5.1±1.7
p < 0.01 cv = 46.6
p < 0.01 cv = 14.1
39 1.0 4.00 2.11a 246.43a 2275 1417 1300 37.7±4.8 42.9±1.5 1.5 2.66 1.48b 152.60b 2236 1580 1411 29.3±13.3 36.9±15.0 2.0 2.00 1.02c 121.83c 2279 1908 1846 16.3±5.3 19.0±3.2 2.5 1.60 0.71d 81.98d 2190 1810 1677 6.8±1.8 23.4±7.9 3.0 1.33 0.63d 67.73d 2253 2025 1975 10.1±0.6 12.3±2.8
p < 0.01 cv = 6.2
p < 0.01 cv = 8.2
45 1.0 4.00 2.71a 316.35a 2300 1383 1083 39.9±7.1 52.9±5.4 1.5 2.66 2.02b 242.58b 2306 1594 1533 30.8±7.4 33.5±7.3 2.0 2.00 1.31c 147.95c 2392 1883 1821 21.3±8.2 23.9±7.0 2.5 1.60 1.09c 131.33c 2370 2007 1830 15.3±0.5 22.8±4.1 3.0 1.33 0.95c 112.53c 2344 2092 2006 10.8±1.8 14.5±0.7
p < 0.01 cv = 13.2
p < 0.01 cv = 12.2
53 1.0 4.00 3.06a 580.80a 2133 917 612 57.0±4.2 71.3±3.8 1.5 2.66 2.03b 365.43b 2106 1322 1259 37.2±6.9 37.2±6.5 2.0 2.00 1.37c 226.00c 2117 1355 1243 36.0±3.6 41.3±3.6 2.5 1.60 1.07c 201.20c 2117 1587 1492 25.0±3.1 29.5±5.3 3.0 1.33 0.91c 177.10c 2117 1617 1523 23.6±4.4 28.0±2.0
p < 0.01 cv = 13.2
p < 0.01 cv = 8.7
Table 2. Equations fitted to the data percentage of light interception (Y) as a function of the leaf area index (X) at four maize stages (26, 39, 45 and 53 days after emergence - DAE). n = 5 paired data. Each value is the average of four replications.
DAE Model Equation r p
26 Exponential Y = 4.2666 EXP (2.234 X) 0.94 < 0.05
39 Exponential Y = 10.337 EXP (0.722X) 0.88 < 0.10
39 Logistic Y = 43/ (1 + (45.545) EXP (- 4.367 X) -0.86 < 0.05
45 Exponential Y = 9.753 EXP (0.6271X) 0.96 < 0.01
45 Logistic Y = 53/ (1 + (125.0736 EXP (-3.651X) -0.91 < 0.05 45 Quadratic Y = 10.915 + 2.951X + 4.542X2 0.99 < 0.05
53 Exponential Y = 19.988 EXP (0.396X) 0.93 < 0.05
53 Logistic Y = 71.4/ (1 + 52.30) EXP(-3.08X) -0.90 < 0.05
Table 3. Equations fitted to the data of the total dry mass (TDM = Y g m-2) as a function of the percentage of light
intercepted (X) at four stages after maize emergence (DAE). n = 5 paired data. Each value is the average of four replications.
DAE Model Equation r p
26 Linear Y = - 2.61 + 2.57 X 0.99 < 0.01
26 Exponential Y = 7.813 Exp (9.581.10-2
X) 0.98 < 0.01
26 Logistic Y = 47.9/ (1+ 214.63)Exp(- 0.624 X) -0.95 < 0.05 26 Quadratic Y = 2.37 + 1.59X + 3.89 . 10-2
X2
0.99 < 0.05
39 Linear Y = -0.87 + 5.02 X 0.90 < 0.05
39 Exponential Y = 45.19. EXP(0.036 X) 0.90 < 0.10
39 Logistic Y = 247.0/ (1+ 54.22) EXP (- 0.18 X) -0.81 < 0.10
45 Linear Y = 20.92 + 5.73 X 0.97 < 0.01
45 Exponential Y = 75.783 EXP (2.85. 10-2
X) 0.96 < 0.01
45 Logistic Y = 316.5/ (1 + 167.998. EXP (-0.226X) -0.96 < 0.05 45 Quadratic Y = -7.75 + 7.7X – 2.834.10-2 X2) 0.98 < 0.05
53 Linear Y = - 58.08 + 8.88 X 0.93 < 0.05
53 Exponential Y = 99.279 . EXP (2.498. 10-2X) 0.89 < 0.05
53 Logistic Y = 581.0/ (1 + 1393.29). EXP (- 0.206) X -0.96 < 0.01
The possibility of a correlation between the percentage of light intercepted at 26 days after emergence and the corn yield was also determined (Table 4). Among the six models tested, it was found that the linear (r = 0.97 and p ≤ 0.01), logistic (r = 0.94 and p ≤ 0.01) and quadratic (r = 0.98 and p ≤ 0.01) equations were the best fit with regard to r and p. The exponential model also showed a good correlation (r = 0.95 and p ≤ 0.05), which was significant at 5%. However, when analyzing the parameters of the models, no significance was found for the third parameter of the models with three parameters. Therefore, only the exponential and linear models, with two parameters, met all the criteria.
Table 4. Equations fitted to the data of the corn grain yield (GY) in kg ha-1 (GY = Y) as a function of the percentage of light
intercepted (X) by plants at four stages (26, 39, 45 and 53 days after emergence - DAE). n = 5 paired data. Each value is the average of four replications.
Model Equation r p
26 Linear Y = 1104.93 + 194.0 X 0.97 p ≤ 0.01
26 Exponential Y = 1603.5Exp (5.92 . 10-2 X) 0.95 p ≤ 0.05
26 Logistic Y = 4848/ (1 + 15.10 Exp (-0.38X) 0.94 p≤ 0.01 26 Quadratic Y = 522.98 + 308.49X – 4.55 X2
0.98 p≤ 0.01
39 Linear Y = 970.56 + 80.43X 0.90 p ≤ 0.05
39 Exponential Y = 1512.83 Exp (2.52.10-2
X) 0.90 p≤ 0.10
45 Linear Y = 984.5 + 72.14X 0.97 p ≤ 0.01
45 Exponential Y = 1515.12 Exp (2.29.10-2X) 0.95 p ≤ 0.05
45 Logistic Y = 4818.0/ (1 + 164.1 Exp (- 0.24X) 0.94 p≤ 0.05 45 Quadratic Y = 499.24 + 104.0 X – 0.42X2 0.97 p≤ 0.10
45 Exp. Quad. Y = 1023.05 Exp (5.0.10-2
X – 3.91.10-4
X2
) 0.96 p≤ 0.10
53 Linear Y = 631.97 + 60.35 X 0.94 p≤ 0.05
53 Exponential Y = 1403.08 Exp (1.82.10-2X) 0.90 p ≤ 0.05
53 Logistic Y = 4818.0/ (1+ 775.3 Exp (0.207X) 0.97 p ≤ 0.01 53 Quadratic Y = -2223.85 + 190.11X – 1.28X2 0.96 p ≤ 0.10
At 39 DAE, the value of LAI at a density of 4 plants m-2 differed from the other densities
(Table 1), and the density of 2.66 plants per m2 differed
from those at 2.0, 1.6 and 1.33 plants per m2; there was
no difference between the LAIS at densities of 1.6 and
for the TDM. There was significant correlation between the light interception and LAI, and the equations that best fit the data for the percentage of light intercepted as a function of LAI (Table 2) were the logistic (r = 0.86 and p ≤ 0.05) and exponential (r = 0.88 and p ≤ 0.10) models. The best equations for the dry mass (Table 3) were the linear (r = 0.90 p ≤ 0.05), the exponential (r = 0.90 p ≤ 0.10) and logistic (r = -0, 81 and p ≤ 0.10) equations. At 39 DAE, the exponential model for light interception as a function of the leaf area index and the exponential and logistic models for total dry mass as a function of the percentage of light intercepted exhibited a high correlation coefficient and significance of the adjustment; the significance and adequate distribution of residues met all the criteria.
The linear model (r = 0.90 and p ≤ 0.05) fit well to the grain yield depending on the percentage of light intercepted at 39 DAE (Table 4). There was also a good correlation for the exponential model, but only at 10% probability (r = 0.90 and p ≤ 0.10). Only the exponential model met all the criteria, whereas the linear model was not significant for the second parameter.
At 45 and 53 DAE, a similar behavior between the LAI and TDM was noted regarding the plant density (Table 1). At the density of 4 plants per m2, LAI
S and
TDM were significantly higher than at the other densities; the densities of 2.00, 1.60 and 1.33 pl m-2 showed no differences. For the density of
2.66 pl m-2, the averages were lower than those
achieved at 4.0 pl m-2 but higher than those at 2.00,
1.60 and 1.33 pl m-2. According to r and p, the equation
that best fit the data of the percentage of light intercepted as a function of LAI at 45 DAE (Table 2) was exponential (r = 0.96 and p ≤ 0.01). The logistic (r = -0.91 and p ≤ 0.05) and quadratic (r = 0.99 and p ≤ 0.05) equations also fit well, but only the exponential model met all the criteria. For TDM, the linear (r = 0.97 and p ≤ 0.01) and exponential (r = 0.96 and p ≤ 0.01) equations were the best fit (Table 3): even though the logistics (r = -0.96 and p ≤ 0.05) and quadratic (r = 0.98 and p ≤ 0.05) models fit well, only the linear and exponential models met all the criteria. At 53 DAE, the exponential (r = 0.93 and p ≤ 0.05) and logistic (r = -0.90 and p ≤ 0.05) equations best represented the percentage of light intercepted as a function of LAI, but only the exponential model met all the criteria. Considering the values for r and p, on this date, the logistics equation (r = -0.96 and p ≤ 0.01) was the best fit for the TDM data as a function of the percentage of light intercepted, even though the linear (r = 0.93 and p ≤ 0.05) and exponential (r = 0.96 and p ≤ 0.05) models were a good fit. However, only the exponential model, with two parameters, met all the criteria.
At 45 DAE, the linear model (r = 0.97 and p ≤ 0.01) was the best fit for the grain yield depending on the percentage of light intercepted (Table 4). The exponential (r = 0.95 and p ≤ 0.05) and logistic (r = -0.94 and p ≤ 0.05) models also showed good correlation, but the parameters of quadratic model were not significant and did not fit all the criteria. The logistic equation (r = -0.97 and p ≤ 0.01) best fit to the data, considering r and F, at 53 DAE. Good correlations were obtained using the linear, exponential and quadratic equations, at 10% of probability, but only the exponential model fit all the criteria.
The adjusted models for the observed data are valid for the range of X (age of plants), between 26 and 53 DAE, the beginning of the flowering stage. Considering the duration of the culture cycle, other models could also possibly fit well. The focus on the stages evaluated is justified because the objective of this study was to assess the environment created within a maize crop in terms of the availability of light and whether this environment limits the development of other crops in coculture, such as beans, when taking into account their light requirements. As most varieties of common bean (Phaseolus vulgaris L.) have a relatively short cycle, between 70 and 90 days, our approach meets the objectives of the research. Table 1 shows that the lowest photon flux density (612 μmol of photons m-2 s-1) occurred at 53 DAE at the density of 4
plants per m2. In this environment, bean plants would
be under limited light. Conversely, the percentages of light interception were high at the other densities, with rates exceeding 1000 μmol photons m-2 s-1. At densities
of 2.00, 1.60 and 1.33 plants m-2, maize showed no
differences in LAI or TDM, but light attenuation occurred. In no case was there a decrease of the rate to below 1200 μmol photons m-2 s-1, a value above the
saturation point of light for isolated leaves of most C3 plants but probably limiting to whole plants, which require more light to reach the saturation point (SHARMA-NATU; GUILDIYAL, 2005; YE, 2007).
In this experiment, the incident light was measured between 12:00 and 13:00 hour; nevertheless, light attenuation occurred even at the lowest density of maize plants, apparently not affecting the intercrops. Throughout the day, the attenuation of light is higher due to the inclination of the sun, which is one of many factors affecting the reception of light (STEWART et al., 2003), explaining the reduced productivity of certain cultures intercropped with maize, such as beans, even with maize rows spacing of 3.0 m, which is very common in northeastern Brazil (MORGADO; WILLEY, 2008).
be perceived because we only evaluated three points within the culture profile. Indeed, it is important to focus on the distribution of leaves in space rather than on the distance above the ground (a significant amount of Q is also absorbed by the stems, and this must also should be taken into account). It is known a large proportion of the canopy leaf area occurs in the middle portion (GITELSON et al., 2003; LINDQUIST et al., 2005).
Over the age of the plant, between 26 and 54 DAE, when flowering begins, there was a consistent exponential relationship between the LAI according to the density of the plants (Figure 2). Although the logistic model fitted well at 26 DAE, according to r and F test, this model did not significantly fit the criteria of the parameters, whereas the exponential model did. For the other dates, the exponential model gave an excellent fit (r = 0.97 and p ≤ 0.01). In general, throughout plant development, the exponential may be selected to predict the LAI according to the plant density because, even at 26 days after emergence, r = 0.92 and p ≤ 0.05 were observed.
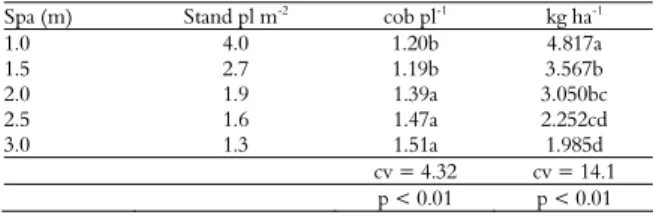
The grain yield with regard to the density of 4 plants per m2 (4817 kg ha-1) was higher than the other
densities (Table 5), though the number of cobs per plant (1.2) was lower. The following models were tested and met all the criteria for the grain yield as a function of density: quadratic (Y = 1706X – 126.6X2,
with r = 0.99 and p ≤ 0.01); exponential straight line (Y = 1753X* EXP (-9.463.10-2X), with r = 0.99 and p
≤ 0.01); and mod log (modified logarithm) (Y = 3142 Ln(X+0.559), with r = 0.99 and p ≤ 0.01). The number of cobs per plant depending on the plant density was adjusted to the following: a hyperbolic function (Y = 0.6991/X+0.9967, with r = 0.96 and p ≤ 0.01) and modified exponential model (Y = 1.036 * EXP(0.5152/X), with r = 0.95 and p ≤ 0.01). The adjusted equations are valid for the range of 1.3 to 4 plants per m2, yet extrapolations can result in
unrealistic values.
Figure 2. Leaf area index and the respective equations adjusted for the different densities of plants at four stages 26 DAE( ), 39 DAE ( ), 45 DAE ( ) and 53 DAE ( ). Each point along the curve is the average of four replications.
Table 5. Number of cobs per plant (cob pl-1) and grain yield
(kg ha-1) for maize at different spacing (spa) between planting
rows and within stands (pl m-2).
Spa (m) Stand pl m-2 cob pl-1 kg ha-1
1.0 4.0 1.20b 4.817a
1.5 2.7 1.19b 3.567b
2.0 1.9 1.39a 3.050bc
2.5 1.6 1.47a 2.252cd
3.0 1.3 1.51a 1.985d
cv = 4.32 cv = 14.1
p < 0.01 p < 0.01
The literature reports increased grain yields for a spacing smaller than 1 m, to 0.4 m, between rows (MARCHÃO et al., 2006; STRIEDER et al., 2008); although these results may be valid for certain small-sized hybrids, they do not appear valid for tall hybrids. Tall maize plants spaced at 1 m intercepted approximately 70-80% light at the flowering and grain-filling stages, with little light reaching the lower leaf strata (Table 1). Maize is a C4-metabolism plant, with a high demand for light, and stem weakening can occur and may result in lodging under circumstances of even weak winds.
The grain yield of the hybrid used in the present study was low compared to the yields above 6 t ha-1 reported obtained using other
hybrids (MARCHÃO et al., 2006; STRIDER at al., 2008), a result that can be explained by the different conditions of climate and hybrid material used.
Conclusion
The exponential is the best model to estimate % LIC as a function of LAI between 26 to 54 DAE and for dry matter production as a function of light intercepted.
The grain yield as a function of the light intercepted can be estimated using different models, such as exponential, logistic and linear models.
The best equations for predicting grain yield as a function of density are the quadratic, the exponential straight line and modified logarithm.
The best equations for predicting the number of cobs per plant depending on the plant density were a hyperbolic and modified exponential models.
References
DERMODY, O.; LONG, S. P.; DELUCIA, E. H. How does elevated CO2 or ozone affect the leaf-area index of soybean when applied independently?. New Phytologist, v. 169, n. 1, p. 145-155, 2006.
EWERT, F. Modelling plant responses to elevated co2: how important is leaf area index? Annals of Botany, v. 93, n. 6, p. 619-627, 2004.
FUNK, J. L.; VITOUSEK, P. M. Resource-use efficiency and plant invasion in low-resource systems. Nature, v.446, n. 9, p. 1079-1081, 2007.
GITELSON, A. A.; VINÃ, A.; ARKEBAUER, T. J.; RUNDQUIST, D. C.; KEYDAN, G.; LEAVITT, B. Remote estimation of leaf area index and green leaf biomass in maize canopies. Geophysical Research Letters, v. 30, n. 5, p. 52-56, 2003.
HIROSE, T. Development of the Monsi–Saeki theory on canopy structure and function. Annals of Botany, v. 95, n. 3, p. 483-494, 2005.
IRMAK, S.; MUTIIBWA, D.; IRMAK, A.; ARKEBAUER, T. J.; WEISS, A.; MARTIN, D. L.; EISENHAUER, D. E. On the scaling up leaf stomatal resistance to canopy resistance using photosynthetic photon flux density. Agricultural and Forest Meteorology,v. 148, n. 6, p. 1034-1044, 2008.
KIMBALL, B. A.; KOBAYASHI, K.; BINDI, M. Responses of agricultural crops to free-air CO2 enrichment. Advances
in Agronomy, v. 77, n. 4, p. 293-368, 2002.
LINDQUIST, J. L.; ARKEBAUER, T. J.; WALTERS. T.; CASSMAN, K. G.; DOBERMANN. A. Maize radiation use efficiency under optimal growth conditions.
Agronomy Journal, v. 97, n. 2, p. 72-78, 2005.
MARCHÃO, R. L.; BRASIL, E. M.; XIMENES, P. A. Interceptação da radiação fotossinteticamente ativa e rendimento de grãos do milho adensado. Revista Brasileira de Milho e Sorgo, v. 5, n. 2, p. 170-181, 2006. MONSI, M.; UCHIJIMA; Z.; OIKAWA, T. Structure of foliage canopies and photosynthesis. Annual Review of Ecology and Systematics, v. 4, n. 3, p. 301-327, 1973. MONTPIED, P.; GRANIER, A.; DREYER, E. Seasonal time-course of gradients of photosynthetic capacity and mesophyll conductance to CO2 across a beech (Fagus sylvatica L.) canopy. Journal of Experimental Botany, v. 60, n. 8, p. 2407-2418, 2009.
MORGADO, L. B.; WILLEY, R. W. Optimum plant population for maize-bean intercropping system in the Brazilian semi-arid region. Scientia Agricola, v. 65, n. 5, p. 474-480, 2008.
NOBEL, P. S.; FORSETH, I. N.; LONG, S. P. Canopy structure and light interception. In: HALL, D. O.; SCURLOCK, J. M. O.; BOLHÀR-NORDENKAMPF, H. R.; LEEGOOD, R. C.; LONG, S. P. (Ed.). Photosynthesis and production in a change environment. London: Chapman and Hall, 1993. p. 79-90.
PATAKAS, A.; KOFIDIS, G.; BOSABALIDIS A. M. The relationships between CO2 transfer mesophyll resistance
and photosynthetic efficiency in grapevine cultivars.
Scientia Horticulturae, v. 97, n. 3, p. 255-263, 2003. SHARMA-NATU, P.; GHILDIYAL, M. C. Potential targets for improving photosynthesis and crop yield.
Current Science, v. 88, n. 12, p. 1918-1929, 2005. STEWART , D. W.; COSTA, C.; DWYER, L. M.; SMITH, D. L.; HAMILTON, R. I.; MA, B. L. Canopy structure, light Interception, and photosynthesis in Maize.
Agronomy Journal, v. 95, n. 6, p. 1465-1474, 2003. STRIEDER, M. L.; SILVA, P. R. F.; RAMBO, L.; SANGOI, L.; SILVA, A. A.; ENDRIGO, P. C.; JANDREY, D. B. Crop management systems and maize grain yield under narrow row spacing. Scientia Agricola, v. 65, n. 4, p. 346-353, 2008.
TSUBO, M.; WALKER, S. Shade Effects on Phaseolus vulgaris L. Intercropped with Zea mays L. under well-watered conditions. Journal of Agronomy and Crop Science, v. 190, n. 3, p. 168-176, 2004.
YE, Z-P. A new model for relationship between irradiance and the rate of photosynthesis in Oryza sativa.
Photosynthetica, v. 45, n. 4, p. 637-640, 2007.
Received on July 11, 2012. Accepted on November 30, 2012.