SWARD STRUCTURAL CHARACTERISTICS AND
HERBAGE ACCUMULATION OF
Panicum maximum
cv.
MOMBAÇA SUBJECTED TO ROTATIONAL STOCKING
MANAGEMENTS
Sila Carneiro da Silva1*; Adriana Amaral de Oliveira Bueno1; Roberta Aparecida Carnevalli1; Marina Castro Uebele1; Fernando Oliveira Bueno2; John Hodgson3; Cory Matthew3; Greg C. Arnold3; Jozivaldo Prudêncio Gomes de Morais2
1
USP/ESALQ - Depto. de Zootecnia, C.P. 09 - 13418-900 - Piracicaba, SP - Brasil.
2
UFSCAR, C.P. 153 - 13600 - 970 - Araras, SP - Brasil.
3
Massey University, Private Bag 11222, Palmerston North, New Zealand. *Corresponding author <[email protected]>
ABSTRACT:Grazing strategies promote changes in sward structure that can affect patterns of herbage accumulation and sward flexibility to management. This experiment evaluated sward structural characteristics and herbage accumulation of Mombaça guinea grass (Panicum maximum Jacq. cv. Mombaça) subjected to rotational stocking managements. Treatments involved grazing when swards reached either 95 or 100% interception of the incident light (LI), to post-grazing heights of 30 and 50 cm, and were allocated to 2,000 m2
paddocks according to a randomised complete block design in a 2 × 2 factorial arrangement with four replications, from January 2001 to February 2002. Sward canopy changed from a vertical to a more horizontal orientation as the light interception area index and height increased from post to pre-grazing. Leaf canopy height pre-grazing was stable throughout the year and around 90 and 115 cm for the 95% and 100% LI treatments respectively, indicating a potential for development and use of target-based grazing management practices. Herbage mass pre and post-grazing was lower for the 95% than the 100% LI treatments, but with higher proportion of leaf and lower proportions of stem and dead material. Treatment effects on herbage accumulation were cumulative and became more evident as the experiment progressed, with up to 6 t ha–1
DM advantage to the 95/30 treatment. Although based on a single year experiment, grazing management should aim for low herbage mass during the transition period from winter to spring in order to allow fast recovery of swards and favour herbage accumulation during the following growing season.
Key words:grazing management, leaf canopy height, leaf area index, light interception
CARACTERÍSTICAS ESTRUTURAIS E ACÚMULO DE FORRAGEM
EM PASTOS DE
Panicum maximum
cv. MOMBAÇA SUBMETIDOS A
ESTRATÉGIAS DE PASTEJO ROTATIVO
RESUMO: Estratégias de pastejo promovem alterações na estrutura do dossel, afetando os padrões de acúmulo de forragem e flexibilidade ao manejo. O objetivo deste experimento foi avaliar as características estruturais do dossel e o acúmulo de forragem em pastos de capim-mombaça (Panicum
maxium Jacq. cv. Mombaça) submetidos a estratégias de pastejo rotativo. Os tratamentos
corresponderam a pastejos realizados quando os pastos atingiam 95 ou 100% de interceptação da luz incidente (IL) até alturas de resíduo de 30 e 50 cm, e foram alocados às unidades experimentais (piquetes de 2000 m2) segundo um delineamento de blocos completos casualizados e arranjo fatorial 2 × 2, com quatro repetições, de janeiro de 2001 a fevereiro de 2002. O dossel passou de vertical para uma orientação mais horizontal à medida que o índice de área da folhagem e altura dos pastos aumentou durante a rebrota. A altura pré-pastejo do dossel mostrou-se estável durante o experimento e em torno de 90 e 115 cm para os tratamentos de 95 e 100% de IL, respectivamente, indicando potencial para o desenvolvimento e uso de práticas de manejo baseadas em metas de condição de pasto. A massa de forragem pré e pós-pastejo foi menor para os tratamentos de 95% em relação àqueles de 100% de IL, mas com maior proporção de folhas e menor proporção de colmos e material morto. Os efeitos dos tratamentos sobre o acúmulo de forragem foram cumulativos e se tornaram mais evidentes ao longo do experimento, com um valor de até 6 t ha–1
em experimento de um ano de duração, o manejo do pastejo deve priorizar baixos valores de massa de forragem durante a transição entre o inverno e a primavera como forma de permitir rápida recuperação dos pastos e favorecer o acúmulo de forragem na estação de crescimento seguinte.
Palavras-chave: manejo do pastejo, altura do dossel, índice de área foliar, interceptação luminosa.
MATERIAL AND METHODS
Site, experimental treatments and design
The experiment was carried out in Araras, São Paulo State, Brazil (21°18’ S, 47°23’ W, 611 m a.s.l.), on a Panicum maximum cv. Mombaça pasture estab-lished in 1998 on a Haplic Acrisol (FAO, 2006) (Argissolo Vermelho distrófico latossólico, according to the Brazilian classification - EMBRAPA, 1999). Av-erage soil chemical characteristics (Raij et al., 1986) were: P = 9 mg dm–3 (ion-exchange resin extraction method); organic matter (O.M.) = 33 g dm–3; pH (0.01 mol L–1CaCl2) = 5.3; K = 1.9 mmolc dm–3; Ca = 32 mmolc dm–3; Mg = 15 mmolc dm–3; H+Al = 31 mmolc dm–3; sum of bases = 49.5 mmolc dm–3; cation ex-change capacity = 80.4 mmolc dm–3; base saturation = 61%. Measurements started in January 2001 and fin-ished in February 2002, totalling 395 days. Mean monthly rainfall, daily air temperature and daily solar radiation over the experimental period, recorded at a Meteorological Station located approximately 500 m from the experimental site, are shown in Figure 1. In relation to a 30-year normal, mean temperatures dur-ing the experimental period were 2 to 4ºC higher, and rainfall was lower during first summer (Jan–Mar/01) and higher during late spring (Nov–Dec/01) and sec-ond summer (Jan–Feb/02).
Experimental treatments corresponded to com-binations of two pre and two post-grazing conditions of a rotational stocking management with dairy cows. Pre-grazing conditions were defined by light intercep-tion levels of the sward canopy during regrowth (95 and 100% LI) and post-grazing conditions by residual sward heights (30 and 50 cm), and named 95/30, 95/ 50, 100/30 and 100/50. These were allocated to each of sixteen 2000 m2 paddocks according to a randomised complete block design, in a 2 × 2 facto-rial arrangement with four replications.
INTRODUCTION
During the last 35 years there have been sig-nificant changes in grassland farming in Brazil. Over-all, total grassland area has increased from around 150 to approximately 180 million hectares, with cultivated pastures increasing by over 300% at the expense of native pastures (Jank et al., 2005). Cultivated lands are mainly comprised of mono-specific, grass-dominant pastures, with species and cultivars of
Brachiaria and Panicum being the most used forage
plants. On the other hand, knowledge and understand-ing of plant responses to grazunderstand-ing management have not evolved as quickly, with poor management and low animal productivity being a common feature under those circumstances (Da Silva, 2004).
Over the years, tropical pastures have been recognised by their high potential for dry matter pro-duction but labelled as producing herbage of low nutri-tive and feeding value (Mannetje, 1982; Hardy et al.,
1997). This has generated the widespread view that tropical pastures are not capable of supporting medium to high levels of animal performance and productivity, which has resulted in serious distortions in the planning and management of tropical pastoral systems, includ-ing experimental agronomic and plant breedinclud-ing programmes. However, recent studies have demon-strated that principles of grazing management and ani-mal production from tropical pastures need to be reap-praised (Da Silva & Carvalho, 2005), and that under-standing of functional responses of plants and animals to variations in sward state is essential (Hodgson, 1985). This approach has been adopted in the past for tem-perate forage species and resulted in significant progress towards the understanding of plant and animal responses to manipulation of sward conditions. In this context, variables like stocking rate, herbage allowance and de-foliation interval are considered as means of achieving sward control and not as ends in themselves (Hodgson & Da Silva, 2002). This represents a major conceptual change in the traditional approach towards research and management that was not applied to tropical pastures in Brazil until the late 1990’s (e.g. Gomide, 1997).
The objective of this experiment was to evalu-ate sward structure, its pattern of change and herb-age accumulation on a Panicum maximum Jacq. cv. Mombaça pasture subjected to strategies of rotational stocking management characterised by strict control of sward conditions.
Figure 1 - Mean monthly rainfall, daily air temperature and daily solar radiation at the experimental site from December 2000 to February 2002.
0 5 10 15 20 25 30
Dec Jan Feb Mar Apr May Jun Jul Aug Sep Oct Nov Dec Jan Feb
Month of the year
M
e
an ai
r t
e
m
p
er
at
ur
e
(
oC)
S
o
la
r ra
d
ia
tio
n
(MJ
/m
2)
0 100 200 300 400 500 600
Ra
in
fa
ll (
m
m
)
Monitoring of experimental conditions and mea-surements
During a pre-experimental preparatory phase, paddocks were rotationally grazed to a post-grazing residue of 30 cm every 30 days from September 2000. The post-grazing residues of 30 and 50 cm were cre-ated in December 2000, after a 2-month period of com-mon rotational grazing, but still using a standard 30-day rotation period. In early January 2001, after graz-ing to the target post-grazgraz-ing heights and mowgraz-ing some areas within some paddocks to ensure that the target residues had been created precisely, pre-grazing con-ditions started to be controlled and measurements were initiated.
Grazing was carried out by groups of 35 lac-tating Holstein dairy cows, but no measurements of animal performance were made. Animals were simply used as grazers and maximum grazing time in any pad-dock was 2 days. When necessary, a group of dry cows and heifers was used to augment stocking rate and finish the grazing session.
A 20:5:20 compound fertiliser (N:P2O5:K2O) was applied to paddocks from the beginning of the pre-experimental preparatory phase in September 2000. The amount used during the experimental period corre-sponded to 195 kg ha–1 of nitrogen, applied to each paddock after grazing. Due to the variable length of the grazing cycles for individual paddocks, a conse-quence of the way treatments were defined, quanti-ties of fertiliser were adjusted in order to ensure a rela-tively constant amount of fertiliser being used per pad-dock every two months. Fertiliser was used from Oc-tober 2000 to April 2001 and OcOc-tober 2001 to Febru-ary 2002, the period of reliable rainfall and high tem-peratures (mid spring to early autumn 2000/01 and mid spring to mid summer 2001/02, respectively; Figure 1).
Leaf canopy height, and size and orientation of the sward light interception area
Leaf canopy height was measured through sys-tematic readings on a 2m ruler graduated in centimetres along pre-defined, zig-zag transect lines (16 points of measurement) covering the entire area of each pad-dock. Readings were taken from ground level consid-ering the upper surface of the leaf canopy around the ruler as reference, even at times of the year when plants were reproductive and produced taller flower-ing stems (Carnevalli et al., 2006). Leaf canopy height was monitored regularly and canopy light interception measured pre and post-grazing and at every 20cm in-crease in leaf canopy height from the post-grazing height of 30 or 50 cm. After height measurements, ar-eas with the average leaf canopy height were
identi-fied along the transect line for each paddock and mea-surements of light interception carried out on six ran-domly selected locations from those areas using a canopy analyser (LAI 2000, LI-COR, Lincoln, Ne-braska, USA) consistently in the afternoon period in the absence of direct solar radiation. In each location, one reading was taken above the canopy and five at ground level (optical sensor placed at the mid distance between tussocks), totalling six readings above the canopy and 30 at ground level per paddock. When light interception by the canopy reached 90%, measure-ments were performed every two days until target specified pre-grazing conditions were achieved (95 and 100% LI). Measurements with the equipment under very dark conditions in tall swards resulted in a maxi-mum light interception reading of 99% instead of 100% (Carnevalli et al., 2006), but the 100% LI label is used throughout the text for ease of presentation.
The canopy analyser used (LAI 2000) also pro-vided estimates of the light interception area and av-erage orientation of the plant canopy (LI-COR, 1992). Since readings took into account all plant material above ground intercepting the incident light, not only leaf, they will be referred to as light interception area index (LIAI) rather than leaf area index (LAI), and used as the measure of canopy increase during re-growth. Similarly, the average angle of the LIAI is used as a general indicator of canopy orientation (0º = hori-zontal and 90º = vertical position).
Herbage mass, botanical and morphological com-position
Herbage mass was determined pre and post-grazing from cuts within three 1.47 × 0.68 m (1 m2) frames per paddock randomly allocated in areas that were representative of the average sward condition at the time of sampling (as described above for measure-ments of canopy light interception). Cuts were made at 20 cm from ground level at different areas of pad-docks every sampling procedure in order not to dam-age the plant stand and impair future sampling proce-dures, given the tall-tufted growth habit of the grass species under study.
consid-ered as pure Mombaça guineagrass stands. Herbage accumulation was calculated as the difference between pre-grazing and the preceding post-grazing herbage mass.
Data processing and analysis
Because pre-grazing conditions were defined in terms of sward canopy light interception levels, grazing dates and rest periods for each paddock were highly dependent on the prevailing environmental growth conditions and, therefore, variable. In order to establish a common basis of comparison for identify-ing possible patterns of change in herbage accumula-tion and grouping of data for uniformity in the analy-sis of variance, herbage accumulation rates for each paddock in every grazing cycle throughout the experi-ment were pooled for individual treatexperi-ments (95/30, 95/ 50, 100/30 and 100/50) and Fourier series curves de-rived to describe patterns of herbage accumulation (Lambert et al., 1986). Curves were fitted as mixed effect models allowing variability within each paddock to be smaller than variability between paddocks. Po-tential correlation through time between residuals on the same paddock was allowed for by a continuous auto-correlation model. Models were fitted as linear in sin(x) and cos(x), then the equality sin (A + B) = (sin A cos B) + (cos A sin B) was used to transform them to the form y = a + b(x) + c sin(0.0172(x+d)). In this equation a, b, c and d are coefficients; x is the Julian day of the experiment (1 to 395); 0.0172 = 2 π /365, a factor used for converting days to radians; and y is the rate of herbage accumulation for day x (kg ha–1 day–1 of DM).
Visual assessment of the fitted curves (Figure 2) identified four periods within which general behaviour was similar but represented changes in pat-terns of herbage accumulation (summer 1 = January– March/01; autumn-winter = April–September/01; spring = October–December/01; and early-summer 2 = Janu-ary/02), so data were grouped accordingly and values for individual paddocks weighed for the number of records within seasons. Analysis of variance was car-ried out on the grouped data using the Mixed Proce-dure of SAS® (Statistical Analysis System). The choice of the covariance matrix was made using the Akaike Information Criterion (AIC) (Wolfinger, 1993), and analysis performed considering light interception pre-grazing, post-grazing height, season of the year and their interactions as fixed effects and blocks as a ran-dom effect. When appropriate, treatment means were calculated using the “LSMEANS” statement, and com-parisons made with “PDIFF” based on a Student test (p < 0.05). Data on total dry matter accumulation for the experiment were analysed using the GLM Proce-dure of SAS.
RESULTS
Monitoring and control of sward conditions
Sward conditions pre and post-grazing were controlled by monitoring canopy light interception (LI) and height throughout every regrowth period during the experiment. Since these were controlled variables, data are presented using only descriptive statistics (means and standard error of the difference - s.e.d.).
Figure 2 - Plot of fitted Fourier curves of herbage accumulation rate data of Panicum maximum cv. Mombaça subjected to rotational stocking managements from January 2001 to February 2002.
0 50 100 150 200 250
0 50 100 150 200 250 300 350 400
Days of the year from January 1, 2001.
y = 150.0 – 0.440x –66.2 sin(0.0172(x –72))
(B) Treatment 95/50:
A
c
c
u
m
u
la
ti
on ra
te
(k
g ha
–1 da
y
–1)
0 50 100 150 200 250
0 50 100 150 200 250 300 350 400
Days of the year from January 1, 2001.
y = 24.45 + 0.259x + 76.0 sin(0.0172(x + 49))
(A) Treatment 95/30:
A
ccu
m
u
la
ti
o
n
r
a
te
(
k
g
h
a
–1 da
y
–1)
0 50 100 150 200 250
0 50 100 150 200 250 300 350 400
Days of the year from January 1, 2001.
y = 44.8 + 0.134x + 50.2 sin(0.0172(x +51))
(C) Treatment 100/30:
A
c
c
u
m
u
la
ti
o
n
r
a
te
(
k
g
h
a
–1 day –1)
0 50 100 150 200 250
0 50 100 150 200 250 300 350 400
Days of the year from January 1, 2001.
y = 34.6 + 0.168x + 48.2 s in(0.0172(x + 30))
(D) Treatment 100/50:
Accu
m
u
la
ti
o
n
r
a
te
(
k
g
h
a
–1
day
Leaf canopy height pre-grazing was lower for the 95% than the 100% LI treatments (88.7 vs 115.4 cm, s.e.d. = 2.09) and values were relatively constant for the 95% but increased for the 100% LI treatments throughout the year (109.8 to 124.3 cm from sum-mer 1 to early sumsum-mer 2, respectively; Figure 3). The nominal 30 and 50 cm post-grazing residue targets cor-responded to actual average values of 33.7, 50.0, 42.0 and 54.3 cm, s.e.d. = 0.92, for the 95/30, 95/50, 100/ 30 and 100/50 treatments, respectively, indicating the difficulty of controlling post-grazing residue (particu-larly 30 cm) when grazing was associated with the 100% LI pre-grazing condition.
Grazing to 30 cm residue resulted in a lower and more vertical LIAI after grazing than to 50 cm residue (1.43 vs 1.90, s.e.d. = 0.078, and 69.1 vs
61.2º, s.e.d. = 2.05, for LIAI and LIAI angle, respec-tively; Figures 4 and 5). Canopy size increased and LIAI angle decreased steadily during regrowth until the next grazing, when LIAI was lower and LIAI angle higher for the 95% than the 100% LI treatments (4.20
vs 5.50, s.e.d. = 0.114, and 50.6 vs 46.5º, s.e.d. = 1.65, respectively), highlighting a consistent pattern of change in canopy characteristics during regrowth. As a result, canopy light interception was lower for the
30 cm than the 50 cm residue treatments soon after grazing (62.3 vs 73.2%, s.e.d. = 1.43) and increased steadily during regrowth until the next grazing, when average values for the 95/30, 95/50, 100/30 and 100/ 50 treatments were 95.3, 95.5, 98.1 and 98.9%, s.e.d. = 1.60, respectively (Figure 6).
Sward characteristics pre and post-grazing
Herbage mass
During the first three months of the experi-mental period, in summer 1, herbage mass pre (Table 1) and grazing (Table 2) varied only with post-grazing residue. Contrasts between treatments became more evident from autumn-winter onwards, particu-larly for the post-grazing herbage mass, when differ-ences between LI treatments started to be noticed and persisted until the end of the experiment. Herbage mass pre-grazing did not vary for the 95% LI treatments but increased for the 100% LI treatments as the experi-ment progressed (p < 0.0001). The 50 cm post-graz-ing residue treatments resulted in higher herbage mass pre-grazing than the 30 cm treatments during summer 1 and autumn-winter, these differences disappearing in spring and early-summer 2 (p = 0.0247).
Figure 3 - Leaf canopy height pre and post-grazing of Panicum maximum cv. Mombaça swards subjected to rotational stocking managements from January 2001 to February 2002.
0 20 40 60 80 100 120 140
Summ er 1
Autum n-Wint
er Sprin
g
Early Summ
er 2 Summ
er 1
Autum n-Wint
er Sprin
g
Early Summ
er 2
Treatments (LI/residue):
Sw
ar
d hei
ght
(
c
m
) Pre-grazing
Post-grazing
95/30 95/50 100/30 100/50
Figure 5 - Sward light interception area orientation (LIAI angle) during regrowth of Panicum maximum cv. Mombaça swards subjected to rotational stocking managements from January 2001 to February 2002.
0 10 20 30 40 50 60 70 80
post +20
cm +40
cm pre post +20
cm +40
cm pre post +20
cm +40
cm pre post +20
cm +40
cm pre
Summer 1 Autumn-Winter Spring Early Summer 2
Treatments (LI/residue):
95/30 95/50 100/30 100/50
Li
gh
t i
n
te
rc
ep
ti
o
n ar
e
a an
gl
e
(
d
e
g
re
e
s
)
Figure 4 - Sward light interception area index (LIAI) during regrowth of Panicum maximum cv. Mombaça swards subjected to rotational stocking managements from January 2001 to February 2002.
0 1 2 3 4 5 6 7
post
+20
cm
+40
cm pre post
+20
cm
+40
cm pre post
+20
cm
+40
cm pre post
+20
cm
+40
cm pre
Treatments (LI/residue):
Li
g
h
t i
n
te
rc
ep
ti
on
a
re
a
i
n
de
x
95/30 95/50 100/30 100/50
Summer 1 Autumn-Winter Spring Early Summer 2
Figure 6 - Sward light interception during regrowth of Panicum maximum cv. Mombaça swards subjected to rotational stocking managements from January 2001 to February 2002.
50 55 60 65 70 75 80 85 90 95 100
post +20
cm +40
cm pre post +20
cm +40
cm pre post +20
cm +40
cm pre post +20
cm +40
cm pre
C
a
no
py
ligh
t int
e
rc
ept
io
n (
%
)
95/30 95/50 100/30 100/50
Summer 1 Autumn-Winter Spring Early Summer 2
In general, herbage mass post-grazing was highest for treatment 100/50 and lowest for treatment 95/30, with intermediate values recorded for treatments 95/50 and 100/30. This pattern of contrast between treatments became more evident as the experiment pro-gressed, with treatment effects being first noticed in terms of post-grazing residue (summer 1) and later in terms of both post-grazing residue and LI (from au-tumn/winter onwards) (p = 0.0243).
Proportion of leaf
Swards grazed to 30 cm presented higher pro-portions of leaf pre-grazing than those grazed to 50 cm (64.5 vs 58.0%, s.e.d. = 2.05; p = 0.0112). Dur-ing the beginnDur-ing of the experiment, in summer 1, the proportion of leaf pre-grazing was high and larger val-ues were recorded for the 100% in relation to the 95% LI treatments (Table 3). In autumn/winter recorded values decreased for both LI treatments and there was no difference between 95 and 100% LI. From the be-ginning of the next growing season (spring onwards) LI treatments behaved differently, with leaf proportion pre-grazing increasing for the 95% and remaining stable for the 100% LI treatments (p = 0.0021).
The proportion of leaf post-grazing during the first three months of the experiment (summer 1) was higher for 95/50 and lower for the 100/30 treatments, with intermediate values recorded for treatments 95/ 30 and 100/50 (Table 4). During autumn/winter and spring a clear contrast between LI treatments became evident with higher proportions of leaf post-grazing recorded for the 95 than the 100% LI treatments. At the end of the experiment, in early-summer 2, the con-trast between LI treatments was still evident, but high-est values were recorded for treatment 95/30, result-ing in differences between post-grazresult-ing residue treat-ments (p = 0.0384).
Proportion of stem
The proportion of stem pre-grazing was con-sistently lower for the 30 cm than the 50 cm residue treatments throughout the experimental period, except
r a e y e h t f o n o s a e
S Swardlightinterception
1(%) Residue (cm)
. D . E . S 2 5
9 100 30 50
a h g k
-- –1DM-----------------------------------------
-1 r e m m u
S 5730Aa 5600 Ac 4940Bb 6390Ab 250
r e t n i W -n m u t u
A 5430 Ba 7150Ab 5150Bb 7420 Aa 509
g n i r p
S 5180 Ba 8830Aa 6690Aa 7330 Aa 348
2 r e m m u S -y l r a
E 5500 Ba 8410Aa 6800Aa 7110Aab 666
1Means followed by the same lower case letters in columns and upper case letters in rows for either sward light interception or residue
are not different (p > 0.05). 2Standard error of the difference.
Table 1 - Herbage mass pre-grazing of Mombaça grass swards subjected to rotational stocking managements from January 2001 to February 2002.
1Means followed by the same lower case letters in columns and
upper case letters in rows are not different (p > 0.05). 2Standard
error of the difference.
Table 3 - Proportion of leaf pre-grazing of Mombaça grass swards grazed at either 95 or 100% canopy light interception from January 2001 to February 2002.
r a e y e h t f o n o s a e
S Swardlightinterception 1(%)
5
9 100 S.E.D.2
-% -1 r e m m u
S 62.2Bb 69.4Aa 2.12
r e t n i W -n m u t u
A 58.4 Ab 53.3Ab 3.73
g n i r p
S 69.2 Aa 57.2Bb 3.58
2 r e m m u S -y l r a
E 62.7Aab 57.6Ab 2.97
1Treatment means followed by the same upper case letter with
(’) within seasons are not different (p > 0.05). 2Standard error of
the difference.
Table 2 - Herbage mass post-grazing of Mombaça grass swards subjected to rotational stocking managements from January 2001 to February 2002. ) m c ( e u d i s e
R Swardlightinterception(%) 5
9 100
a h g k ( 1 r e m m u
S –1DM)1
0
3 1340B' 1760B' 0
5 3550 A' 4000 A' d
. e .
s 2. interaction=332 a h g k ( r e t n i W -n m u t u
A –1DM)
0
3 2010 C' 3030BC' 0
5 3740B' 5340A' 5 1 5 = n o i t c a r e t n i . d . e . s a h g k ( g n i r p
S –1DM ) 0
3 1820D' 2910C' 0
5 4280 B' 4910 A' 5 8 1 = n o i t c a r e t n i . d . e . s a h g k ( 2 r e m m u S -y l r a
E –1DM )
0
3 1600C' 4320AB' 0
5 3900B' 4800A'
during early-summer 2 (Table 5). Treatment 95/30 showed the lowest proportions of stem pre-grazing during the experiment, except during early-summer 2. At the beginning of the experiment, in summer 1, treat-ment 95/50 had the highest values, but during autumn/ winter highest values were recorded for treatment 100/ 50. In spring, treatment 100/50 still showed the high-est values for stem pre-grazing, but a contrast between LI treatments was detected, with 95% LI showing lower values than 100% LI. During early-summer 2 all contrasts disappeared (p = 0.0258).
There was no difference in proportion of stem post-grazing between treatments during summer 1 (Table 6). On the other hand, from autumn/winter until early-summer 2, lowest values of stem post-grazing were consistently recorded for treatment 95/30, with lower values recorded for the 95% than the 100% LI treatments, particularly treatment 100/50 (p = 0.0039).
Proportion of dead material
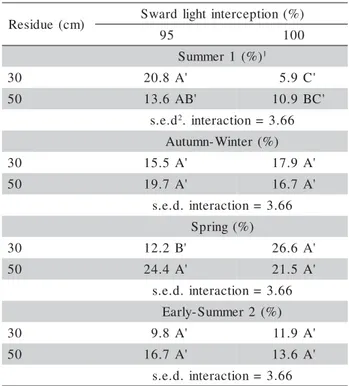
The proportion of dead material pre-grazing was higher for the 95% than the 100% LI treatments during summer 1, with highest values recorded for the 95/30 and lowest for the 100/30 treatments (Table 7). Differences disappeared during autumn/winter but were detected again at the beginning of the next spring grow-ing season, when lower values were recorded for the
) m c ( e u d i s e
R Sward lightinterception(%) 5
9 100
) % ( 1 r e m m u S 1 0
3 41.9AB' 34.0B'
0
5 43.2A' 41.7AB'
d . e .
s 2. interaction=4.07
) % ( r e t n i W -n m u t u A 0
3 39.7A' 29.9B'
0
5 41.3A' 29.2B'
7 5 . 2 = n o i t c a r e t n i . d . e . s ) % ( g n i r p S 0
3 48.5A' 39.5AB'
0
5 46.5A' 35.3B'
8 4 . 4 = n o i t c a r e t n i . d . e . s ) % ( 2 r e m m u S -y l r a E 0
3 57.3A' 30.3C'
0
5 39.9B' 30.9C'
3 6 . 3 = n o i t c a r e t n i . d . e . s
1Treatment means followed by the same upper case letter with
(’) within seasons are not different (p > 0.05). 2Standard error of
the difference.
Table 4 - Proportion of leaf post-grazing of Mombaça grass swards subjected to rotational stocking mana-gements from January 2001 to February 2002.
) m c ( e u d i s e
R Swardlightinterception(%) 5
9 100
) % ( 1 r e m m u S 1 0
3 12.1C' 18.3 B'
0
5 28.6A' 21.4 B'
d . e .
s 2. interaction=2.95
) % ( r e t n i W -n m u t u A 0
3 18.4C' 24.6 BC'
0
5 29.5AB' 34.2 A'
1 5 . 4 = n o i t c a r e t n i . d . e . s ) % ( g n i r p S 0
3 11.6C' 17.1 B'
0
5 13.3C' 20.3 A'
1 4 . 1 = n o i t c a r e t n i . d . e . s ) % ( 2 r e m m u S -y l r a E 0
3 24.7A' 29.5 A'
0
5 22.5A' 27.3 A'
7 1 . 4 = n o i t c a r e t n i . d . e . s
1Treatment means followed by the same upper case letter with
(’) within seasons are not different (p > 0.05). 2Standard error of
the difference.
Table 5 - Proportion of stem pre-grazing of Mombaça grass swards subjected to rotational stocking mana-gements from January 2001 to February 2002.
) m c ( e u d i s e
R Swardlightinterception(%) 5
9 100
) % ( 1 r e m m u S 1 0
3 33.8A' 39.3 A'
0
5 36.5A' 36.4 A'
d . e .
s 2. interaction=3.97
) % ( r e t n i W -n m u t u A 0
3 21.2C' 31.4 AB'
0
5 27.6BC' 38.7 A'
7 9 . 3 = n o i t c a r e t n i . d . e . s ) % ( g n i r p S 0
3 17.2B' 22.0 AB'
0
5 16.8B' 25.3 A'
7 9 . 3 = n o i t c a r e t n i . d . e . s ) % ( 2 r e m m u S -y l r a E 0
3 19.2C' 45.2 A'
0
5 35.8B' 42.6 AB'
6 6 . 3 = n o i t c a r e t n i . d . e . s
1Treatment means followed by the same upper case letter with
(’) within seasons are not different (p > 0.05). 2Standard error of
the difference.
) m c ( e u d i s e
R Swardlightinterception(%) 5
9 100
) % ( 1 r e m m u
S 1
0
3 20.8 A' 5.9C'
0
5 13.6 AB' 10.9BC'
d . e .
s 2. interaction=3.66
) % ( r e t n i W -n m u t u A
0
3 15.5 A' 17.9A'
0
5 19.7 A' 16.7A'
6 6 . 3 = n o i t c a r e t n i . d . e . s
) % ( g n i r p S
0
3 12.2 B' 26.6A'
0
5 24.4 A' 21.5A'
6 6 . 3 = n o i t c a r e t n i . d . e . s
) % ( 2 r e m m u S -y l r a E
0
3 9.8 A' 11.9A'
0
5 16.7 A' 13.6A'
6 6 . 3 = n o i t c a r e t n i . d . e . s
1Treatment means followed by the same upper case letter with
(’) within seasons are not different (p > 0.05). 2Standard error of
the difference.
Table 7 - Proportion of dead material pre-grazing of Mombaça grass swards subjected to rotational stocking managements from January 2001 to February 2002.
95/30 in relation to all other treatments. At the end of the experiment, in early-summer 2, differences between treatments disappeared and recorded values were lower in relation to those recorded during spring (p = 0.0073).
At post-grazing, the proportion of dead mate-rial varied only with season of the year (p < 0.0001), with lowest values recorded during both summers and highest during autumn-winter and spring (22.1, 34.6, 37.0 and 25.3%, s.e.d. = 2.33, for summer 1, autumn-winter, spring and early summer 2, respectively).
Herbage accumulation
The experimental period comprised half of the 2000/2001 (January–March/01) and half of the 2001/ 2002 (October/01–January/02) growth cycles (Figure 1). Fitting of Fourier series curves indicated clearly that treatment 95/50 behaved differently from the other three treatments, and treatments 100/30 and 100/50 were similar (Figure 2). The ratio of maximum to mini-mum herbage accumulation rate was larger for the 95/ 30 and 95/50 than for the 100/30 and 100/50 treat-ments in both 2000/2001 (21.4 and 30.7; 4.2 and 3.6) and 2001/2002 (38.1 and 9.9; 6.2 and 5.4, respec-tively), indicating pronounced but different patterns of seasonality of production. During the 2000/2001 and
2001/2002 seasons maximum herbage accumulation rate occurred at day 54, 0, 49 and 73 and 395, 323, 395 and 395, respectively, with minimum values re-corded at day 213, 186, 214 and 232 for treatments 95/30, 95/50, 100/30 and 100/50, respectively. Treat-ment 95/50 resulted in an overall decline in herbage accumulation throughout the year, while the other three treatments showed an overall increase (linear coeffi-cient of the fitted Fourier curves), especially 95/30, indicating the occurrence of different cumulative treat-ment effects as the experitreat-ment progressed. Predicted values of average herbage accumulation rate for the experiment (calculated using the linear component of the fitted curves for the mid point of the experimental period - day 198) were 75.8, 62.9, 71.3 and 67.9 kg ha–1 DM for treatments 95/30, 95/50, 100/30 and 100/ 50, respectively.
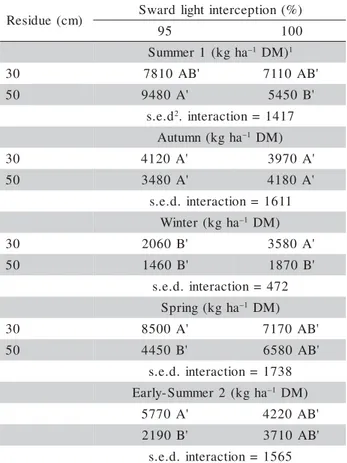
Total dry matter accumulation for the entire experiment was larger (p = 0.0558) for the 30 cm than the 50 cm residue treatments (27160 vs 21430 kg ha–1, s.e.d. = 2609) and there was a trend (p = 0.0828) for higher accumulation for the 95/30 than the 95/50 treat-ment (28260 and 21060 kg ha –1
, s.e.d. = 3690, re-spectively). The general pattern of variation in herb-age accumulation described by the Fourier curves could also be observed from the results of seasonal accu-mulation of herbage presented in Table 8. During sum-mer 1, there was a clear contrast between treatments 95/50 and 100/50, with intermediate values recorded for treatments 95/30 and 100/30. Differences disap-peared during autumn and winter, except for treatment 100/30 that resulted in highest herbage accumulation during winter. In spring and early-summer 2 treatment 95/30 accumulated more herbage than 95/50 (p = 0.0045), with intermediate values recorded for treat-ments 100/30 and 100/50, which did not differ from 95/30.
DISCUSSION
condi-1Treatment means followed by the same upper case letter with
(’) within seasons are not different (p > 0.05). 2standard error of
the difference.
Table 8 - Seasonal herbage accumulation of Mombaça grass swards subjected to rotational stocking mana-gements from January 2001 to February 2002.
) m c ( e u d i s e
R Swardlightinterception(%) 5
9 100
a h g k ( 1 r e m m u
S –1DM)1
0
3 7810AB' 7110AB'
0
5 9480A' 5450B'
d . e .
s 2.interaction=1417
a h g k ( n m u t u
A –1DM)
0
3 4120A' 3970A'
0
5 3480A' 4180A'
1 1 6 1 = n o i t c a r e t n i . d . e . s
a h g k ( r e t n i
W –1DM)
0
3 2060B' 3580A'
0
5 1460B' 1870B'
2 7 4 = n o i t c a r e t n i . d . e . s
a h g k ( g n i r p
S –1DM)
0
3 8500A' 7170AB'
0
5 4450B' 6580AB'
8 3 7 1 = n o i t c a r e t n i . d . e . s
a h g k ( 2 r e m m u S -y l r a
E –1DM)
' A 0 7 7
5 4220AB'
' B 0 9 1
2 3710AB'
5 6 5 1 = n o i t c a r e t n i . d . e . s
tion at the time of sampling, and further sampling for herbage mass pre and post-grazing carried out at ran-dom on those areas. Overall, the coefficient of varia-tion for herbage mass pre and post-grazing varied from 6 to 10% and for herbage accumulation was around 20%. These are low when compared to values of 30 to 80% reported by Penati et al. (2005) in an experi-ment studying the number (two to nine), size (0.25 to 3.0 m2) and format (square and rectangular, with vary-ing ratios between perimeter and area) of the frames used to sample herbage mass in Tanzânia guineagrass
(Panicum maximum Jacq. cv. Tanzânia). This is an
in-dication that the sampling procedure used here was effective in reducing variability in this experiment. De-spite that, monitoring of the grazing process was very careful and paddocks remained visually homogeneous yet with differences between treatments throughout the experimental period. Herbage cuts were made at 20 cm from ground level, so did not take into account the material positioned at the base of the sward and com-prised almost exclusively of stems and dead material. This impairs direct comparisons of the results from
this experiment with other information available in the literature and recorded from cuts taken to ground level. Grazing management modified leaf canopy height and sward herbage mass, the size and orienta-tion of the light interceporienta-tion area (LIAI) and the pro-portion of leaf relative to stem and dead material. In general, the more lenient and less frequent defoliations associated with the 50 cm residue and the 100% LI pre-grazing condition resulted in taller swards (Figure 3), larger herbage mass (Tables 1 and 2) with lower proportion of leaf (Tables 3 and 4) and higher propor-tion of stem (Tables 5 and 6) and dead material (Table 7) positioned in a relatively more horizontal arrange-ment (Figure 5) than the more severe and frequent de-foliations associated with the 30 cm residue and the 95% LI pre-grazing condition.
Targets of post-grazing residue were relatively easy to maintain when paddocks were grazed at 95% LI, but at 100% LI post-grazing residues increased over the course of the experiment, particularly when the target was 30 cm. This was a likely consequence of the difficulty of grazing due to the accumulation of dead material, particularly stems, in the lower strata of the swards (Table 6). Leaf canopy height pre-graz-ing was 86.7, 87.2, 91.7 and 89.2 cm for the 95% LI and 109.8, 110.4, 116,9 and 124.3 cm for the 100% LI treatments in summer 1, autumn-winter, spring and early summer 2, respectively. There was some varia-tion for the 100% LI treatments (14.5 cm ≅ 13%), but leaf canopy height pre-grazing was around 90 and 115 cm for the 95% and 100% LI treatments, respectively, throughout the year, regardless of swards being veg-etative or reproductive (Figure 3). This was probably a consequence of the way measurements of leaf canopy height were made, relating them to the upper surface of the leaf canopy, irrespective of the height of associated seed heads (Carnevalli et al., 2006). This definition was objective, with a high consistency of readings taken by different observers. Barbosa (2004), working with Tanzânia guinegrass, found that 95 and 100% LI corresponded with leaf canopy heights of 70 and 85 cm, respectively, and Mello & Pedreira (2004) for the same forage plant managed under irrigation and high input of nitrogen fertiliser (640 kg ha–1 N), found that 95% LI corresponded to a leaf canopy height of 70 cm. This indicates consistency and highlights the potential use of leaf canopy height as a field guide for monitoring and controlling grazing management in a similar manner to that for temperate forage species (Hodgson, 1990; Hodgson et al., 1994; Hodgson & Da Silva, 2002).
calculates LAI from the proportion of light measured at the base (ground level) in relation to that incident at the top of the sward. Estimates of LAI from this equip-ment are precise and reliable when dealing with an-nual crops and measurements are made during the veg-etative phase of development (Welles & Norman, 1991). In tropical swards, and probably for annual crops where sward canopy has senescing leaves and flowering stems, estimates are compromised because other plant components than leaves intercept the inci-dent light (stems and senescent/dead material), caus-ing the equipment to overestimate LAI (Sbrissia & Da Silva, 2008). The canopy analyser can be used under diffuse light conditions, allowing for more flexibility and higher frequency of monitoring of sward light in-terception in field conditions.
Herbage mass pre-grazing was stable for the 95% LI but increased for the 100% LI treatments as the experiment progressed, a result of the combined accumulation of stem and dead material on swards grazed at 100% LI (Tables 5 and 7). The proportion of leaf decreased and that of stem and dead material increased from summer 1 to autumn-winter follow-ing the reproductive development of swards and the beginning of the dry season early in the autumn (Fig-ure 1). This was particularly the case on the 100% LI treatments, the consequence of more intense flower-ing. Similar results were reported by Santos et al. (1999); Santos et al. (2004); Barbosa (2004); Cândido et al. (2005) and Lopes (2006) for rotationally stocked mombaça and tanzânia guineagrass and by Braga et al. (2006) for marandu palisadegrass (Brachiaria
brizantha (A. Rich.) Stapf cv. Marandu). Treatment
95/30 resulted in the most effective control of flow-ering in late summer/early autumn, followed by 95/50, 100/30 and 100/50 (Carnevalli et al., 2006), demon-strating that pre-grazing mass was more effective than post-grazing mass in controlling stem development, but could have its effectiveness augmented by more severe grazing (Carnevalli, 2003). This result is in keeping with those of Santos et al. (2006) on irrigated pasture of tanzânia guineagrass subjected to rotational stocking managements and high nitrogen fertiliser in-put (480 kg ha–1 N), and those of Santos et al. (2004) and Cândido et al. (2005) with mombaça guineagrass under rotational stocking.
Summer was the season of highest proportion of stem in herbage mass post-grazing (Table 6), a re-sult of active growth and high vegetative stem elon-gation rates common for most tropical grasses at that time of the year, particularly under the 100% LI treat-ments (Carnevalli, 2003; Santos et al., 2004; Cândido et al., 2005). Season of the year was a consistent fea-ture influencing sward characteristics, the effect
vary-ing with the post-grazvary-ing residue and/or pre-grazvary-ing canopy light interception levels used. This indicates the importance of multi-year studies when evaluating sward responses to grazing management and the po-tential carry-over effects on plant responses from one season to another.
intensity, defoliation strategies that result in low herb-age mass post-grazing with high proportions of leaf, favouring the tillering process by allowing more light to penetrate into the sward, would result in higher rates of herbage accumulation and recovery of swards af-ter grazing (Carnevalli, 2003).
Seasonality of herbage accumulation was a strong feature in this experiment and reflected the typi-cal seasonal production of tropitypi-cal grass species (Pedreira, 1973; Pedreira & Mattos, 1981), one of the most challenging constraints to animal production on tropical pastures (Santos et al., 2006). Grazing man-agement resulted in modifications in patterns (horizon-tal and vertical alignment of fitted Fourier curves) and magnitude (ratio between maximum and minimum ac-cumulation rates for the 2000/2001 and 2001/2002 growing seasons) of seasonality that could be used to lessen constraints to animal production. The range of these modifications was larger than what is usually achieved by simply changing forage plants used and/ or genetic modifications of available species and cul-tivars. This indicates potential limitations of adopting standard pre-defined rest periods to control rotational stocking strategies, and highlights the importance of strategic use of forage conservation and supplemen-tation practices when planning the use of forage plants.
Panicum maximum cv. Mombaça is quite
flex-ible to grazing management, but there is a minimum period of time until the effect of grazing treatments can be perceived. Usually the responses to post-graz-ing height were detected earlier than those to grazpost-graz-ing frequency (LI treatments), suggesting the importance of long term and multi-year experiments when deal-ing with aspects of grazdeal-ing management. Grazdeal-ing at 95% LI resulted in better control of stem and dead material accumulation than grazing at 100% LI, and, when associated with a 30 cm post-grazing height, favoured a quick return to fast regrowth conditions in spring. Conversely, a high herbage mass during the transition from winter to spring normally associated with the 50 cm post-grazing height (treatment 95/50) resulted in decrease in herbage accumulation during the new growing season, which was only partially com-pensated by an increase in grazing interval (grazing at 100% LI). Application of the principles in follow up work (e.g. Silva, 2004; Difante, 2005; Barbosa et al., 2007; Pedreira et al., 2007) supports the results ob-tained in the current experiment.
CONCLUSIONS
Grazing frequency is a powerful tool for man-aging and controlling sward structure and grazing sys-tems. However, a standard rest period is not effective
in defining grazing management in field conditions since herbage accumulation rates of Panicum maxi-mum cv. Mombaça vary significantly throughout the year. The use of a plant growth based criterion like sward light interception to define intervals between successive grazings dealt with this variability effec-tively, with grazing at 95% LI resulting in better con-trol of sward structure and composition than grazing at 100% LI. This was consistently achieved when leaf canopy height pre-grazing was around 90 cm, dem-onstrating the importance and the potential use of sward target-based grazing management practices. Current grazing management practices in Brazil are closer to the 100/50 than the 95/30 treatment of this study. Assuming the present results from a single year’s experimentation of approximately 27% yield ad-vantage for a 30 cm over a 50 cm post-grazing height, pastoral industries in Brazil will potentially make sig-nificant productivity gains from implementation of these findings.
ACKNOWLEDGEMENTS
To Professor Domício do Nascimento Júnior for valuable comments during the elaboration of this paper and to CNPq (Conselho Nacional de Desenvolvimento Científico e Tecnológico, Brazil) and FAPESP (Fundação de Amparo à Pesquisa do Estado de São Paulo, Brazil) for partial funding of this re-search.
REFERENCES
BARBOSA, R.A. Características morfofisiológicas e acúmulo de forragem em capim-tanzânia(Panicum maximum Jacq. cv. Tanzânia) submetido a freqüências e intensidades de pastejo. Viçosa: Universidade Federal de Viçosa, 2004. 122p. Tese (Doutorado).
BARBOSA, R.A.; NASCIMENTO JÚNIOR, D.; EUCLIDES, V.P.B.; DA SILVA, S.C.; ZIMMER, A.H.; TORRES JÚNIOR, R.A.A. Capim-tanzânia submetido a combinações entre intensidade e frequência de pastejo. Pesquisa Agropecuária Brasileira, v.42, p.329-340, 2007.
BRAGA, G.J.; PEDREIRA, C.G.S.; HERLING, V.R.; LUZ, P.H.C.; LIMA, C.G. Sward structure and herbage yield of rotationally stocked pastures of “Marandu” palisadegrass [Brachiaria
brizantha (A. Rich.) Stapf] as affected by herbage allowance.
Scientia Agricola, v.63, p.121-129, 2006.
CÂNDIDO, M.J.D.; GOMIDE, C.A.M.; ALEXANDRINO, E.; GOMIDE, J.A.; PEREIRA, W.E. Morfofisiologia do dossel de
Panicum maximum cv. Mombaça sob lotação intermitente com
três períodos de descanso. Revista Brasileira de Zootecnia, v.2, p.406-415, 2005.
CARNEVALLI, R.A. Dinâmica da rebrotação de pastos de capim-mombaça submetidos a regimes de desfolhação intermitente. Piracicaba: USP/ESALQ, 2003. 136p. Tese (Doutorado). CARNEVALLI, R.A.; DA SILVA, S.C.; BUENO, A.A.O.; UEBELE,
M.C.; BUENO, F.O.; HODGSON, J.; SILVA, G.N.; MORAIS, J.P. Herbage production and grazing losses in Panicum maximum
Received October 18, 2007 Accepted June 17, 2008 DA SILVA, S.C. Understanding the dynamics of herbage
accumulation in tropical grass species: the basis for planning efficient grazing management practices. In: INTERNATIONAL SYMPOSIUM ON GRASSLAND ECOPHYSIOLOGY AND GRAZING ECOLOGY, 2., Curitiba, 2004. Proceedings. Curitiba: Universidade Federal do Paraná, 2004. CD-ROM. DA SILVA, S.C.; CARVALHO, P.C.F. Foraging behaviour and herbage
intake in the favourable tropics/sub-tropics. In: McGILLOWAY, D.A. (Ed.) Grassland: a global resource. Wageningen: Wageningen Academic, 2005. p.81-95.
DIFANTE, G.S. Desempenho de novilhos, comportamento ingestivo e consumo voluntário em pastagem de Panicum maximum Jacq. cv. Tanzânia. Viçosa: Universidade Federal de Viçosa, 2005. 74p. Tese (Doutorado).
EMPRESA BRASILEIRA DE PESQUISA AGROPECUÁRIA.Serviço Nacional de Levantamento e Conservação de Solos. Sistema brasileiro de classificação de solos. Brasília: Embrapa Produção e Informação, 1999. 412 p.
FOOD AND AGRICULTURE ORGANIZATION - FAO. World reference base for soil resources 2006: a framework for international classification, correlation and communication. Rome: FAO, 2006. 145p. (World Soil Resources Report, 103). GOMIDE, J.A. Morphogenesis and growth analysis of tropical grasses. In: INTERNATIONAL SYMPOSIUM ON ANIMAL PRODUCTION UNDER GRAZING, Viçosa, 1997. Proceedings. Viçosa: Universidade Federal de Viçosa, 1997. p.97-116.
HARDY, M.B.; MEISSNER, H.H.; O’REAGAIN, P.J. Forage intake and free-ranging ruminants: a tropical perspective. In: INTERNATIONAL GRASSLAND CONGRESS, 18., Winnipeg, 1997. Proceedings. Winnipeg: Canadian Grassland Association, 1997. p.45-52.
HODGSON, J. The significance of sward characteristics in the management of temperate sown pastures. In: INTERNATIONAL GRASSLAND CONGRESS, 15., Kyoto, 1985. Proceedings. Kyoto: Japanese Society of Grassland Science, 1985. p.63-66.
HODGSON, J. Grazing management: science into practice. Essex: Longman Scientific and Technical, 1990. 203p.
HODGSON, J.; CLARK, D.A.; MITCHELL, R.J. Foraging behaviour in grazing animals and its impact on plant communities. In: FASHEY JR, G.C.; COLLINS, M.; MERTENS, D.R.; MOSER, L.E. (Ed.) Forage quality, evaluation, and utilization. Madison: American Society of Agronomy, 1994. p.796-827. HODGSON, J.; DA SILVA, S.C. Options in tropical pasture
management. In: REUNIÃO ANUAL DA SOCIEDADE BRASILEIRA DE ZOOTECNIA, 39., Recife, 2002. Proceedings. Brasília: Sociedade Brasileira de Zootecnia, 2002. p.180-202.
JANK, L.; VALLE, C.B.; RESENDE, R.M.S. Grass and forage improvement in the tropics and sub-tropics. In: McGILLOWAY, D.A. (Ed.) Grassland: a global resource, Wageningen: Wageningen Academic, 2005. p.69-80.
LAMBERT, M.G.; CLARK, D.A.; COSTALL, D.A. Influence of fertilizer and grazing management on North Island moist hill country. 2. Pasture botanical composition. New Zealand Journal of Agricultural Research, v.29, p.1-10, 1986. LI-COR BIOSCIENCES. Plant canopy analyzer: LAI 2000;
operating manual. Lincoln: LI-COR Biosciences, 1992. 179p. LOPES, B.A. Características morfofisiológicas e acúmulo de
forragem em capim-mombaça submetido a regimes de desfolhação. Viçosa: Universidade Federal de Viçosa, 2006. 188p. Tese (Doutorado).
MANNETJE, L. t’. Measuring biomass of grassland vegetation. In: MANNETJE, L.‘T; JONES, R.M. (Ed.) Field and laboratory methods for grassland and animal production research. Wallingford: CABI, 2000. p.151-177.
MANNETJE, L. t’. Problems of animal production from tropical pastures. In: HACKER, J.B. (Ed.) Nutrional limits to animal production from pastures. Slough: Commonwealth Agricultural Bureaux , 1982. p.67-85.
McINTYRE, G.A. Statistical aspects of vegetation sampling. In: MANNETJE, L.t’ (Ed.) Measurement of grassland vegetation and animal production. Farnham Royal: Commonwealth Agricultural Bureaux, 1978. p.8-21.
MELLO, A.C.L.; PEDREIRA, C.G.S. Respostas morfológicas do capim-Tanzânia (Panicum maximum Jacq. cv. Tanzânia-1) irrigado à intensidade de desfolha sob lotação rotacionada. Revista Brasileira de Zootecnia, v.33, p.282-289, 2004. PEDREIRA, B.C.; PEDREIRA, C.G.S.; DA SILVA, S.C. Estrutura
do dossel e acúmulo de forragem de Brachiaria brizantha cv. Xaraés em resposta a estratégias de pastejo. Pesquisa Agropecuária Brasileira, v.42, p.281-287, 2007.
PEDREIRA, J.V.S. Crescimento estacional dos capins Colonião
Panicum maximum Jacq., Gordura Melinis minutiflora Pal de
Beauv, Jaraguá Hyparrhenia rufa (Ness) Stapf e Pangola de Taiwan A-24 Digitaria pentzii Stent. Boletim de Indústria Animal, v.30, p.59-145, 1973.
PEDREIRA, J.V.S.; MATTOS, H.B. Crescimento estacional de vinte e cinco espécies ou variedades de capins. Boletim de Indústria Animal, v.38, p.117-143, 1981.
PENATI, M.A.; CORSI, M.; LIMA, C.G.; MARTHA JÚNIOR, G.B.; DIAS, C.T.S. Número de amostras e relação dimensão:formato da moldura de amostragem para determinação da massa de forragem de gramíneas cespitosas. Revista Brasileira de Zootecnia, v.34, p.36-43, 2005.
RAIJ, B. VAN; QUAGGIO, J.A.; SILVA, N.M. Extraction of phosphorus, potassium, calcium, and magnesium from soils by ion-exchange resin procedure. Communications in Soil Science and Plant Analysis, v.17, p.547-566, 1986. SANTOS, P.M.; CORSI, M.; BALSALOBRE, M.A.A. Efeito da
freqüência de pastejo e da época do ano sobre a produção e a qualidade em Panicum maximum cvs. Tanzânia e Mombaça. Revista Brasileira de Zootecnia, v.28, p.244-249, 1999. SANTOS, P.M.; CORSI, M; BALSALOBRE, M.A.A. Características
morfogenéticas e taxa de acúmulo de forragem do capim-Mombaça submetido a três intervalos de pastejo. Revista Brasileira de Zootecnia, v.33, p.843-851, 2004.
SANTOS, P.M.; CORSI, M.; PEDREIRA, C.G.S.; LIMA, C.G. Tiller cohort development and digestibility in Tanzania guinea grass
(Panicum maximum cv. Tanzania) under three levels of grazing
intensity. Tropical Grasslands, v.40, p.84-93, 2006. SBRISSIA, A.F.; DA SILVA, S.C. Comparação de três métodos para
estimativa do índice de área foliar em pastos de capim-marandu sob lotação contínua. Revista Brasileira de Zootecnia, v. 37, p.212-220, 2008.
SILVA, A.L.P. Estrutura do dossel e o comportamento ingestivo de novilhas leiteiras em pastos de capim Mombaça. Curitiba: Universidade Federal do Paraná, 2004. 104p. Tese (Doutorado). WELLES, J.M.; NORMAN, J.M. Instrument for indirect measurement of canopy architecture. Agronomy Journal, v.83, p.818-825, 1991.