http://periodicos.uem.br/ojs/acta ISSN on-line: 1807-8621
Doi: 10.4025/actasciagron.v40i1.39378 GENETICS AND PLANT BREEDING
Mechanisms for water-use efficiency between bean cultivars
tolerant to drought are different
Víctor Montero Tavera1, César Leobardo Aguirre Mancilla2, Jorge Alberto Acosta Gallegos1, Juan Gabriel Ramírez Pimentel2, Ana Isabel Mireles Arriaga3 and Jorge Eric Ruiz Nieto3*
1
Campo Experimental Bajío, Instituto Nacional de Investigaciones Forestales, Agrícolas y Pecuarias, Celaya 38110, Guanajuato, México. 2
Division de Estudios de Posgrado e Investigación, Instituto Tecnológico de Roque, Tecnológico Nacional de México, Celaya 38110, Guanajuato, México. 3
Departamento de Agronomía, División de Ciencias de la Vida, Universidad de Guanajuato, Campus Irapuato-Salamanca, Irapuato 36500, Guanajuato, México. *Author for correspondence. E-mail: [email protected]
ABSTRACT. The water-use efficiency (WUE) has been proposed as an alternative to mitigate the effects of climate change in agriculture and to reduce pressure on water resources, mainly in species with high water requirements which are grown under rainfed conditions. The aim of this study was to characterize the instantaneous, integral and molecular WUE of four bean cultivars contrasting in their response under limiting water conditions to compare the component mechanisms of this trait between drought tolerant and susceptible cultivars. Results indicated that tolerant cultivars increased their instantaneous WUE in comparison to susceptible ones; however, there was a difference between cultivars since Pinto Villa had a higher stomatal conductance and transpiration rate, leading to a higher water cost to produce seed than Pinto Saltillo. Furthermore, ycf2, rrn16, rpoC2, hardy, ndhK, erecta and ycf1 WUE genes were only overexpressed in Pinto Saltillo under limited water conditions, which turned out to be the most WUE efficient cultivar. Therefore, the component mechanisms of WUE are different even between drought tolerant cultivars and the mechanisms by which the tolerant cultivars increased their instantaneous and integral WUE were different.
Keywords:Phaseolus vulgaris; physiological characterization; expression profiles; water regimens; production water cost.
Mecanismos de eficiência do uso da água entre cultivares feijão tolerante à seca são
diferentes
RESUMO. A eficiência do uso da água (UEA) foi proposta como uma alternativa para mitigar os efeitos das mudanças climáticas na agricultura e reduzir a pressão sobre os recursos hídricos, principalmente em espécies com altos requerimentos de água que são cultivadas sob condições de sequeiro. O objetivo deste estudo foi caracterizar o UEA instantâneo, integral e molecular de quatro cultivares de feijão, contrastando sua resposta em condições de água limitadas para comparar os mecanismos componentes desta característica entre cultivares tolerantes à seca. Os resultados indicaram que os cultivares tolerantes aumentaram seu UEA instantâneo em comparação aos suscetíveis; entretanto, houve diferença entre as cultivares, uma vez que Pinto Villa apresentou maior condutância estomática e taxa de transpiração, levando a um custo maior de água para produção de sementes do que Pinto Saltillo. Além disso, os genes EUA de ycf2, rrn16, rpoC2, hardy, ndhK, erecta e ycf1 foram apenas sobreexpressos em Pinto Saltillo sob condições de água limitadas, o que se revelou ser a cultivar mais eficiente do UEA. Portanto, os mecanismos componentes da UEA são diferentes mesmo entre as cultivares tolerantes à seca e os mecanismos pelos quais as cultivares tolerantes aumentaram sua UEA instantânea e integral foram diferentes.
Palavras-chaves: Phaseolus vulgaris; caracterização fisiológica; perfis de expressão; regimes hídricos; custo da água de produção.
Introduction
World population will increase around 9 billion by
2050 and its water requirements will be of 12,400 km3
instead of the 6,800 km3 (Godfray et al., 2010). Even
after improving irrigation efficiency in agriculture, water resources management and modernized rainfed
production, 3,300 km3 of water will still be required
(Molden et al., 2010), whereby the water demand will increase to satisfy the needs of urban and industrial use,
Page 2 of 8 Tavera et al.
20% of the agricultural area is irrigated and in this area 40% of food world production is harvested, therefore 60% of global agricultural production takes place under rainfall conditions (Sauer et al., 2010). One way to mitigate the effects of climate change and reduce agricultural water consumption is by generating cultivars with higher water-use efficiency (WUE) (Ruiz-Nieto et al., 2015), mainly in species with high water requirements grown under rainfed conditions. According to Jensen et al. (2012), legumes can reduce the emissions of greenhouse gases and have high rates of soil carbon incorporation, for these reasons they represent an option within the actual agricultural production systems to decrease the effects of climate change. Common bean is one of the main worldwide legume crops with 26.5 million tons produced in 2014 (FAOSTAT, 2017). However, 60% of the bean production is obtained in rainfed areas prone to experience water deficits, where typical drought periods might reduce up to 80% its production (Rosales et al., 2012). The characterization of plant mechanisms and their genetic interactions with the environment will provide the opportunity to establish water-efficient crop systems to cope climate change (Hatfield et al., 2011). WUE describes the relation between carbon fixation and water loss in plants, because this last evaporates from interstitial tissues of
the leaves each time stomata open to assimilate CO2
(Bramley, Turner, & Siddique, 2013). The identification of intraspecific genetic variation for WUE has allowed breeders to begin selection programs for this trait to improve drought tolerance (Devi et al., 2011). As for dry bean, Rosales et al. (2012) indicated that in the cultivar Pinto Saltillo, WUE is one of its mechanisms in response to limited water availability, which was confirmed by our researching group (Ruiz-Nieto et al., 2015). To complement previous research, the aim of this study was to characterize instantaneous, integral and molecular WUE in four common bean cultivars contrasting in their response to limited water conditions, to compare the component mechanisms of this trait focusing on the drought tolerant cultivars Pinto Villa and Pinto Saltillo.
Material and method
Plant material
Four cultivars of contrasting response to drought stress were included in this study, Pinto Villa (PV) considered as tolerant (Cuellar-Ortiz,
Arrieta‐Montiel, Acosta‐Gallegos, & Covarrubias,
2008), Canario 60 (C60) as susceptible, while Rosales et al. (2012) consider Pinto Saltillo (PS) and Bayo Madero (BM) as tolerant and susceptible, respectively. Three cultivars are of indeterminate
prostrate Type III growth habit, of short photoperiod response and belong to the Durango race, whereas C60 is of determinate type I growth habit from the Nueva Granada race.
Experimental conditions
Seeds were germinated in a humid chamber and five days later the seedlings were transplanted into pots of 16 cm height and 18 cm greater diameter with type
peat substrate (Sunshine® mix No. 3). Based on the
Field Capacity (FC) of 1.89 g of water g of substrate-1
two water regimes were established at 20 and 60% of the FC as limiting and optimal respectively (Ruiz-Nieto et al., 2015). Treatments were kept gravimetrically through the daily weighting of each pot and maintenance irrigation. To avoid evaporation and percolation losses, the pots were covered with foil and the drain holes were sealed, thus ensuring that the plants were always kept in the corresponding water regimens. The experiment was conducted during 75 days in greenhouse conditions at the installations of Campo Experimental Bajío (20°31’ north latitude, 100°45’ west longitude and 1,765 masl). The average maximum and minimum temperatures were 31.1°C and 11.9°C, with averages maximum and minimum relative humidities of 88.3% and 55.9%, the natural photoperiod was around 12h during the growing cycle.
Variables measured
For plant development and using five replications,
leaf area (LA, cm2) was determined following Jesus,
Vale, Coelho, and Costa (2001), plant height (PH, cm) was also measured; total biomass (TB, g) was recorded after drying the plants at 80°C overnight, at the same time plants were separated into above ground biomass (AB, g) and roots (RB, g). The foliage relative water content (RWC, %) (Ruiz-Nieto et al., 2015). Negative impressions were obtained on the underside of representative leaves with clear acrylic lacquer, thus stomata density (SD) was determined from those impressions by counting the number of stomata per
1.323 mm2 corresponding to the optical field used.
Using the same images, stomata aperture area (SA,
μm2) was evaluated with the software Image
Measurements KLONK 13.1.3.8; stomata conductance
(gs, mmol H2O m-2 s-1), photosynthesis (A, μmol CO2
m-2 s-1) and transpiration (E, mol H
2O m-2 s-1) rates
were measured with the aid of an infrared gas analyzer CI-340 (CID Bio-Science, Inc.) with a
chamber of 6.25 cm2 and a constant air flow of 0.3 L
min.-1. Measurements were performed between 12:00
physiological maturity (R8) stages, which were considered when plants presented three fully developed leaves, the onset of flowering and physiological maturity, respectively. Other variables related to reproductive habits and production were evaluated including days to flowering (DF), pods per plant (PP) and seeds per pod (SP), seed yield per plant (SYP), and the weight of 100 seeds (W100S). Water consumed per plant (WCP, mL) during the whole cycle was measured throughout its daily record. Instantaneous and intrinsic WUE were characterized by the relationship between photosynthesis and
transpiration rates (A/E, μmol CO2 mol H2O-1), as well
as photosynthesis and stomata conductance (A/gs, μmol
CO2 mmol H2O-1). Integral WUE was evaluated by
the relationship between total biomass and water
consumed (TB/WCP, g L-1), also by seed production
and water consumed (SYP/WCP, g L-1). Using this last
ratio water footprint (WF, L kg-1) was estimated as the
number of liters of water needed to produce one kg of seeds. Data were analyzed using a completely randomized design with five replications; Tukey (p < 0.05) tests were carried out using the SAS System for Windows 9.1.
Amplification of genes by PCR
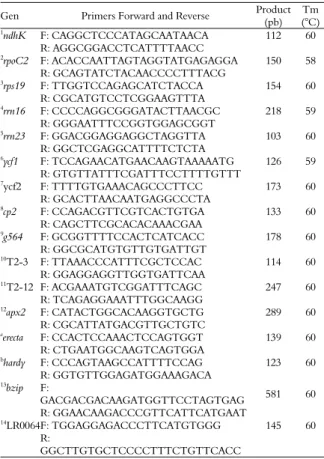
The presence-absence of 16 fragments previously identified as related to WUE by Ruiz-Nieto et al. (2015) was determined in the genome of the four bean cultivars by PCR (Table 1).
Genomic DNA was extracted from leaf tissue and five replications per treatment using the procedure described by Devi, Punyarani, Singh, and Devi (2013). DNA purity was estimated by spectrophotometry and its integrity evaluated by submitting it to electrophoresis in 1 % agarose with 1X TBE buffer (1 mM pH 8 EDTA, 40 mM boric acid, 40 mM Tris). Gels were stained with
ethidium bromide (0.5 μg mL-1) and results were
exposed with UV light in a photodocumenter BIO-RAD Universal Model Universal Hood II. Fragment genes were amplified in a total volume
of 20 μL containing 12 μL of sterile distilled
water, 2 μL of 10 mM dNTP’s, 2 μL of 10X PCR
buffer, 0.8 μL of 50 mM MgCl2, 2 μL of 10 mM
corresponding primers pair, 0.2 μL of 5 U μL-1
Taq and 1 μL of 30 ng μL-1 genomic DNA. The
amplification program was: 1 cycle at 95°C for 5 min., 25 cycles at 95°C for 1 min., corresponding Tm to each primer pair for 2 min. and 72°C for 2 min., 1 final cycle at 72°C during 2 min. Reaction products were separated by electrophoresis in 1% agarose with 1X TBE buffer.
Table 1. Genetic elements considered to characterize WUE.
Gen Primers Forward and Reverse Product
(pb) Tm (°C)
1ndhK F: CAGGCTCCCATAGCAATAACA 112 60
R: AGGCGGACCTCATTTTAACC
2
rpoC2 F: ACACCAATTAGTAGGTATGAGAGGA 150 58
R: GCAGTATCTACAACCCCTTTACG
3
rps19 F: TTGGTCCAGAGCATCTACCA 154 60
R: CGCATGTCCTCGGAAGTTTA
4rrn16 F: CCCCAGGCGGGATACTTAACGC 218 59
R: GGGAATTTCCGGTGGAGCGGT
5rrn23 F: GGACGGAGGAGGCTAGGTTA 103 60
R: GGCTCGAGGCATTTTCTCTA
6ycf1 F: TCCAGAACATGAACAAGTAAAAATG 126 59
R: GTGTTATTTCGATTTCCTTTTGTTT 7
ycf2 F: TTTTGTGAAACAGCCCTTCC 173 60
R: GCACTTAACAATGAGGCCCTA
8
cp2 F: CCAGACGTTCGTCACTGTGA 133 60
R: CAGCTTCGCACACAAACGAA
9g564 F: GCGGTTTTCCACTCATCACC 178 60
R: GGCGCATGTGTTGTGATTGT
10T2-3 F: TTAAACCCATTTCGCTCCAC 114 60
R: GGAGGAGGTTGGTGATTCAA
11T2-12 F: ACGAAATGTCGGATTTCAGC 247 60
R: TCAGAGGAAATTTGGCAAGG
12
apx2 F: CATACTGGCACAAGGTGCTG 289 60
R: CGCATTATGACGTTGCTGTC a
erecta F: CCACTCCAAACTCCAGTGGT 139 60
R: CTGAATGGCAAGTCAGTGGA
bhardy F: CCCAGTAAGCCATTTTCCAG 123 60
R: GGTGTTGGAGATGGAAAGACA
13bzip F:
GACGACGACAAGATGGTTCCTAGTGAG 581 60
R: GGAACAAGACCCGTTCATTCATGAAT
14LR0064F: TGGAGGAGACCCTTCATGTGGG 145 60
R:
GGCTTGTGCTCCCCTTTCTGTTCACC
GenBank accessions: 1JZ715498, 2JZ715502, 3EU196765.1 (80705-80486), 4EU196765.1
(97773-98003), 5EU196765.1 (102505-102636), 6JZ715503, 7JZ715504, 8JZ715505, 9JZ715507, 10JZ715508, 11JZ715510, 12NM_001354113, 13AF350505, 14CK901535.
References: a (Wilson et al., 2009), b(Karaba et al., 2007).
Evaluation of expression levels by RT-PCR
Expression profiles were generated with the 16 genetic elements for the four cultivars from leaf tissue and using five replications under the two water regimens (20 and 60%) and at two growth stages (V3 and R6). Sampling at physiological maturity was not considered since there was a general decline in physiological activity related to plant age instead of treatments. Total RNA was extracted from leaf tissue representative of growth stage using the procedure of Logemann, Schell, and Willmitzer (1987) and RNA purity was determined by spectrophotometry, subsequently RNA integrity was tested by denaturing electrophoresis in 1.5% agarose with 12.3 M formaldehyde and 10X MOPS. Results were documented in the way above described. Later, single strand cDNA was synthesized by retrotranscription
with the aid of the kit Super SmartTM kit. Basal
expression was normalized based on the expression level of the 26S reference gene (Montero-Tavera, Escobedo-Landín, Acosta-Gallegos, Anaya-Lopez, & Ruiz-Nieto, 2017). WUE related genes were amplified
in PCR reactions with 300 ng μL-1 of cDNA as
Page 4 of 8 Tavera et al.
according with the normalization of the 26S gene. Products were analyzed by electrophoresis in 1% agarose with 1X TBE buffer. Densitometric analyzes using the software TotalLabQuant TL120 1D v2009 were performed over the images visualized.
Validation of expression profiles by qPCR
To confirm the observed differences in the
expression profiles, the expression levels of rpoC2,
ndhK, ycf1, apx2 and erecta genes were determined in the
experimental conditions at which these genes
expressed differentially (RT-PCR). The rpoC2 gene
was evaluated in PV and C60 at the V3 stage and in PS
at the R6 stage; the differential expression of gene apx2
in PV and BM at the V3 stage; the erecta gene in PV in
the V3 stage; genes ndhK and ycf1 were evaluated in PS
at the R6 stage. The fluorophore used was SYBR®, by
using 25 μL reactions containing 12.5 μL of 2X
Maxima SYBR Green/ROX qPCR Master Mix, 1.5 μL
of 300 mM (previously evaluated) corresponding
oligonucleotide pair, 1 μL of 50 ng μL-1 cDNA and 10
μL of nuclease free water, with three replicates. The
reaction conditions were: 1 cycle at 95°C for 10 min., 30 cycles at 95°C for 15 s, 60°C for 30 s and 72°C during 30 s. In the same reaction, the absence of nonspecific products was verified by generating melt curves with the following conditions: 95°C for 15 s, 50°C during 1 min. and 95°C for 15 s. The reaction efficiencies for the genes were determined by calibration curves using five cDNA (1:10) serial dilutions and three replicates. CT (threshold cycle) values were obtained with the software StepOne V2.3 and results were analyzed with the software REST 2009 V2.0.13 with 2,000 bootstrap iterations.
Result and discussion
During the conduction of the greenhouse experiment none plant showed the typical drought symptoms as wilting and/or bending in the 20% water regimen. Under the 20%, drought tolerant cultivars increased their root biomass with respect to the susceptible ones, although this response that was more evident at the V3 stage. Results were like those described by Shao, Chu, Jaleel, and Zhao (2008), who mention that the radicle of tolerant cultivars developed faster under stress conditions. On average PV and PS had 1.2 and 0.8 g more root biomass respectively than susceptible cultivars. Same trends were observed for foliage dry weight and LA. PV and PS had 0.75 and 1.05 g more of foliage dry weight respectively, than susceptible cultivars, while for LA, PV and PS had on
average 33.5 and 39.5 cm2 more than susceptible
cultivars, respectively. This suggests that the root biomass increased in the tolerant cultivars in response
to limited water availability, which enabled them to satisfy the water requirements of a larger leaf area. Both LA and foliage biomass were similar in PV and PS, but root biomass was higher in PV suggesting that foliage maintenance in this drought tolerant cultivar had higher water requirements; consequently, its water consumption was higher. The four cultivars decreased
their gs and E under 20% water regimen, comparable
results were observed by Rosales et al. (2012) with PS
and BM. Regarding gs, the reduction of its magnitude
in the four cultivars was higher mainly at the V3 stage where high physiological activity was displayed. In this
growth stage PV and PS decreased their gs 50 and 61
mmol H2O m-2 s-1, respectively. Remarkably, cultivar
C60 in the same stage had a greater reduction in its gs
(34 mmol H2O m-2 s-1) with respect to BM. As
expected, there was a highly significant positive
correlation (R2 = 0.98) between g
s and SA, which
indicates that the effect of limited water regimen in the stomata response can be evaluated by any of these two
variables. Tolerant cultivars had a lower E rate due to
greater ability to modulate their stomata and between
tolerant cultivars; PV had a higher E rate than PS due
to greater gs, therefore PV will have higher water
consumption at the end of its biological cycle. Under
limited conditions, A increased in the four cultivars
however the response of tolerant cultivars was higher and reciprocal to instant and intrinsic WUE. In PV and
PS at the V3 stage, A was 12.1 and 11.8 μmol CO2 m-2
s-1, respectively, while in BM and C60 at the same stage
was 7.5 and 6.5 μmol CO2 m-2 s-1, respectively. A
highly significant positive correlation (R2 = 0.89) was
observed between RWC and A. The value of both
variables increased in the four cultivars under 20%
water regimen and mainly at the V3 stage; although A
and RWC were higher in the tolerant cultivars than in the susceptible ones. The four cultivars tended to reduce their stomata density under the 20% water regime, although tolerant cultivars had higher stomata density, according to Reynolds-Henne et al. (2010) a reduction in stomata density is related to adaptation under stress conditions. The four cultivars increased their instantaneous and intrinsic WUE under 20% water regimen, however the tolerant cultivars were more efficient mainly due to their ability to assimilate
CO2 under limited water conditions throughout a high
photosynthetic rate. Ruiz-Nieto et al. (2015) mentioned that this trait is important for the identification of drought tolerant bean genotypes (Zlatev & Lidon, 2012). Meanwhile, in the instantaneous assessments between tolerant cultivars, PS was more efficient despite that both cultivars had
high A. Differences between them were since PV had
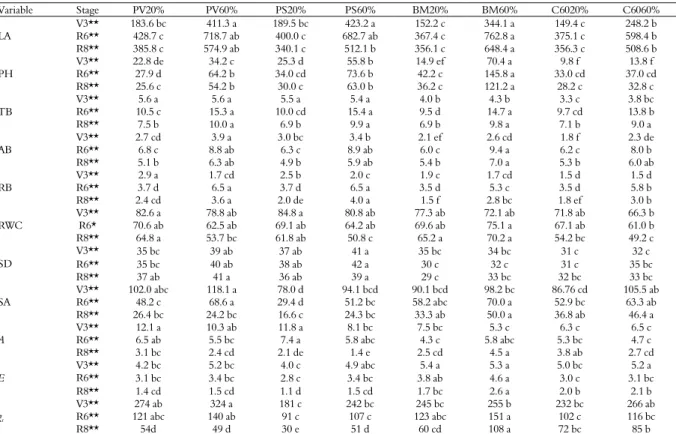
Table 2. Variables evaluated during the plant development.
Variable Stage PV20% PV60% PS20% PS60% BM20% BM60% C6020% C6060%
LA
V3** 183.6 bc 411.3 a 189.5 bc 423.2 a 152.2 c 344.1 a 149.4 c 248.2 b
R6** 428.7 c 718.7 ab 400.0 c 682.7 ab 367.4 c 762.8 a 375.1 c 598.4 b
R8** 385.8 c 574.9 ab 340.1 c 512.1 b 356.1 c 648.4 a 356.3 c 508.6 b
PH
V3** 22.8 de 34.2 c 25.3 d 55.8 b 14.9 ef 70.4 a 9.8 f 13.8 f
R6** 27.9 d 64.2 b 34.0 cd 73.6 b 42.2 c 145.8 a 33.0 cd 37.0 cd
R8** 25.6 c 54.2 b 30.0 c 63.0 b 36.2 c 121.2 a 28.2 c 32.8 c
TB
V3** 5.6 a 5.6 a 5.5 a 5.4 a 4.0 b 4.3 b 3.3 c 3.8 bc
R6** 10.5 c 15.3 a 10.0 cd 15.4 a 9.5 d 14.7 a 9.7 cd 13.8 b
R8** 7.5 b 10.0 a 6.9 b 9.9 a 6.9 b 9.8 a 7.1 b 9.0 a
AB
V3** 2.7 cd 3.9 a 3.0 bc 3.4 b 2.1 ef 2.6 cd 1.8 f 2.3 de
R6** 6.8 c 8.8 ab 6.3 c 8.9 ab 6.0 c 9.4 a 6.2 c 8.0 b
R8** 5.1 b 6.3 ab 4.9 b 5.9 ab 5.4 b 7.0 a 5.3 b 6.0 ab
RB
V3** 2.9 a 1.7 cd 2.5 b 2.0 c 1.9 c 1.7 cd 1.5 d 1.5 d
R6** 3.7 d 6.5 a 3.7 d 6.5 a 3.5 d 5.3 c 3.5 d 5.8 b
R8** 2.4 cd 3.6 a 2.0 de 4.0 a 1.5 f 2.8 bc 1.8 ef 3.0 b
RWC
V3** 82.6 a 78.8 ab 84.8 a 80.8 ab 77.3 ab 72.1 ab 71.8 ab 66.3 b
R6* 70.6 ab 62.5 ab 69.1 ab 64.2 ab 69.6 ab 75.1 a 67.1 ab 61.0 b
R8** 64.8 a 53.7 bc 61.8 ab 50.8 c 65.2 a 70.2 a 54.2 bc 49.2 c
SD
V3** 35 bc 39 ab 37 ab 41 a 35 bc 34 bc 31 c 32 c
R6** 35 bc 40 ab 38 ab 42 a 30 c 32 c 31 c 35 bc
R8** 37 ab 41 a 36 ab 39 a 29 c 33 bc 32 bc 33 bc
SA
V3** 102.0 abc 118.1 a 78.0 d 94.1 bcd 90.1 bcd 98.2 bc 86.76 cd 105.5 ab
R6** 48.2 c 68.6 a 29.4 d 51.2 bc 58.2 abc 70.0 a 52.9 bc 63.3 ab
R8** 26.4 bc 24.2 bc 16.6 c 24.3 bc 33.3 ab 50.0 a 36.8 ab 46.4 a
A
V3** 12.1 a 10.3 ab 11.8 a 8.1 bc 7.5 bc 5.3 c 6.3 c 6.5 c
R6** 6.5 ab 5.5 bc 7.4 a 5.8 abc 4.3 c 5.8 abc 5.3 bc 4.7 c
R8** 3.1 bc 2.4 cd 2.1 de 1.4 e 2.5 cd 4.5 a 3.8 ab 2.7 cd
E
V3** 4.2 bc 5.2 bc 4.0 c 4.9 abc 5.4 a 5.3 a 5.0 bc 5.2 a
R6** 3.1 bc 3.4 bc 2.8 c 3.4 bc 3.8 ab 4.6 a 3.0 c 3.1 bc
R8** 1.4 cd 1.5 cd 1.1 d 1.5 cd 1.7 bc 2.6 a 2.0 b 2.1 b
gs
V3** 274 ab 324 a 181 c 242 bc 245 bc 255 b 232 bc 266 ab
R6** 121 abc 140 ab 91 c 107 c 123 abc 151 a 102 c 116 bc
R8** 54d 49 d 30 e 51 d 60 cd 108 a 72 bc 85 b
Pinto Villa (PV), Pinto Saltillo (PS), Bayo Madero (BM), Canario 60 (C60), limited water regimen (20%) and optimal (60%), vegetative stage (V3), reproductive stage (R6), maturity (R8), leaf area (LA, cm2), plant height (PH, cm), total biomass (TB, g), foliage biomass (AB, g), root biomass (RB, g), relative water content (RWC, %), stomatal density (SD, stomata
per 1.323 mm2), stomatal aperture area (SA, μm2), photosynthesis (A, μmol CO
2 m-2 s-1), transpiration (E, mol H2O m-2 s-1),stomatal conductance (gs, mmol H2O m-2 s-1). Values with
the same letter within averages rows are statically equal Tukey (p < 0.05), (*) significant differences p < 0.05, (**) highly significant differences p < 0.01.
The SYP of the four cultivars was reduced under the 20% regimen, although tolerant cultivars had a higher number of pods and seeds. Cultivar PV showed higher SYP than PS under both water regimens; despite that the number of pods was similar, PV had more SP. Also, under the water limited regimen the seed weight of all cultivars was reduced; although PV produced more seeds, its size was reduced by 26.5%, while in PS, BM and C60 the reduction was of 4.8, 10.6 and 11.2%, respectively; this suggest the action of the yield component compensation (Kahlon, Board, & Kang, 2011). In the integral measurement of WCP the four cultivars limited their consumption under the 20% water regimen, particularly PS whose SYP/WCP relationship indicated an efficient water use under limited conditions, with an increase in its WUE of 28%, while there were no differences between PV and BM. Although PV was the highest yielder cultivar, when its WUE was measured in integral terms, it was like the one
under the optimal water regimen. Cultivar C60, despite of being considered as susceptible, it increased its integral WUE (SYP/WCP) under the restrictive water regimen 20%, however with
respect to PS the difference was 0.34 g L-1. Results
Page 6 of 8 Tavera et al.
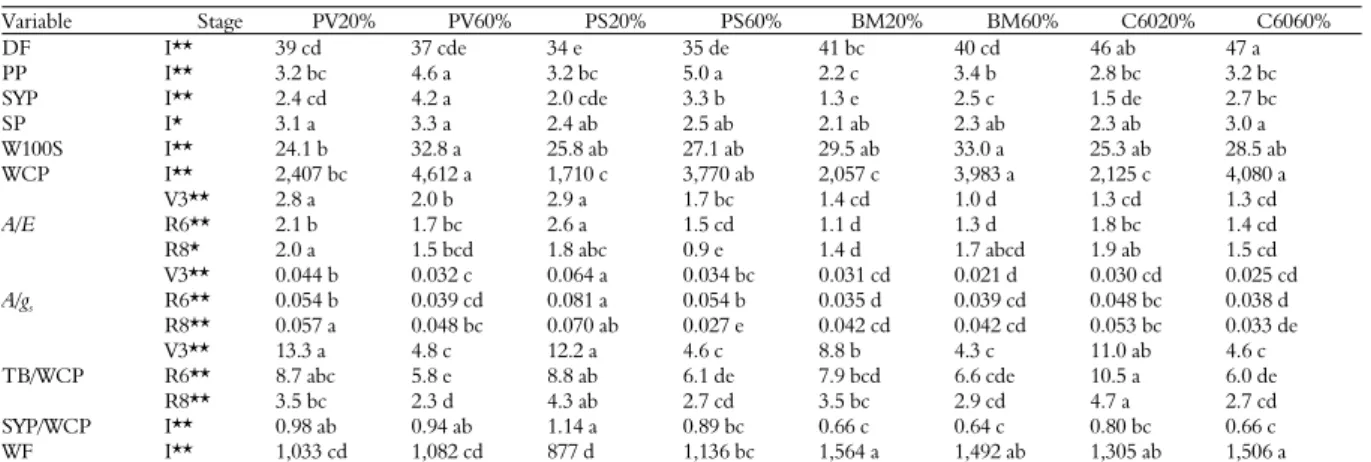
Table 3. Variables evaluated for reproduction, production and WUE.
Variable Stage PV20% PV60% PS20% PS60% BM20% BM60% C6020% C6060%
DF I** 39 cd 37 cde 34 e 35 de 41 bc 40 cd 46 ab 47 a
PP I** 3.2 bc 4.6 a 3.2 bc 5.0 a 2.2 c 3.4 b 2.8 bc 3.2 bc
SYP I** 2.4 cd 4.2 a 2.0 cde 3.3 b 1.3 e 2.5 c 1.5 de 2.7 bc
SP I* 3.1 a 3.3 a 2.4 ab 2.5 ab 2.1 ab 2.3 ab 2.3 ab 3.0 a
W100S I** 24.1 b 32.8 a 25.8 ab 27.1 ab 29.5 ab 33.0 a 25.3 ab 28.5 ab
WCP I** 2,407 bc 4,612 a 1,710 c 3,770 ab 2,057 c 3,983 a 2,125 c 4,080 a
A/E
V3** 2.8 a 2.0 b 2.9 a 1.7 bc 1.4 cd 1.0 d 1.3 cd 1.3 cd
R6** 2.1 b 1.7 bc 2.6 a 1.5 cd 1.1 d 1.3 d 1.8 bc 1.4 cd
R8* 2.0 a 1.5 bcd 1.8 abc 0.9 e 1.4 d 1.7 abcd 1.9 ab 1.5 cd
A/gs
V3** 0.044 b 0.032 c 0.064 a 0.034 bc 0.031 cd 0.021 d 0.030 cd 0.025 cd
R6** 0.054 b 0.039 cd 0.081 a 0.054 b 0.035 d 0.039 cd 0.048 bc 0.038 d
R8** 0.057 a 0.048 bc 0.070 ab 0.027 e 0.042 cd 0.042 cd 0.053 bc 0.033 de
TB/WCP
V3** 13.3 a 4.8 c 12.2 a 4.6 c 8.8 b 4.3 c 11.0 ab 4.6 c
R6** 8.7 abc 5.8 e 8.8 ab 6.1 de 7.9 bcd 6.6 cde 10.5 a 6.0 de
R8** 3.5 bc 2.3 d 4.3 ab 2.7 cd 3.5 bc 2.9 cd 4.7 a 2.7 cd
SYP/WCP I** 0.98 ab 0.94 ab 1.14 a 0.89 bc 0.66 c 0.64 c 0.80 bc 0.66 c
WF I** 1,033 cd 1,082 cd 877 d 1,136 bc 1,564 a 1,492 ab 1,305 ab 1,506 a
Pinto Villa (PV), Pinto Saltillo (PS), Bayo Madero (BM), Canario 60 (C60), limited water regimen (20 %) and optimal (60 %), integral evaluation (I), vegetative stage (V3), reproductive stage (R6), maturity (R8), days to flowering (DF, days), number of pods per plant (PP, No.), seed yield per plant (SYP, g), seeds per pod (SP, No.), weight of one hundred seeds (W100S, g), water consumed per plant (WCP, ml), instant UEA (A/E, μmol CO2 mol H2O-1), intrinsic UEA (A/gs, μmol CO2 mmol H2O-1), integral UEA (TB/WCP, g L-1) and
(SYP/WCP, g L-1), water footprint (WF, L kg). Values with the same letter within averages rows are statically equal Tukey (p < 0.05), (*) significant differences p < 0.05, (**) highly
significant differences p < 0.01.
Among tested cultivars PS was the most efficient to use water under limited conditions. None difference in the genome of the four cultivars was observed, this indicates that those differences in water-use under limited conditions are not due to presence and/or absence of genomic factors, but rather to their transcription and respective regulation as suggested by Ruiz-Nieto et al. (2015). With the expression profiles generated by RT-PCR and densitometry, the differences in transcription
related to WUE were evaluated and such differential character was confirmed by qPCR (Figure 1).
In the V3 stage the apx2 gene increased its
expression level in the four cultivars, which indicates that it has an important biological role in response to induced oxidative stress in all genotypes, including the response to drought stress (Wilson et
al., 2009). erecta, cp2, and rpoC2 genes were expressed
in response to limited water conditions in PV, the last gene was also differentially expressed in C60.
The cp2 gene was expressed under conditions
related to WUE in PS as well as ycf2 and rrn16 genes.
At the R6 stage none of the studied elements were
expressed in all four cultivars; g564 differentially
expressed in C60 and BM, while LR0064 only did in BM. rpoC2, hardy, erecta, ycf1, ndhK, and bzip
transcription factor had a higher expression level in PS. The last element was also differentially expressed in PV. According to Recchia, Caldas,
Beraldo, Silva, and Tsai (2013) the bzip transcription
factor is related to flowering and response to abiotic
stress, therefore it was expected that bzip was
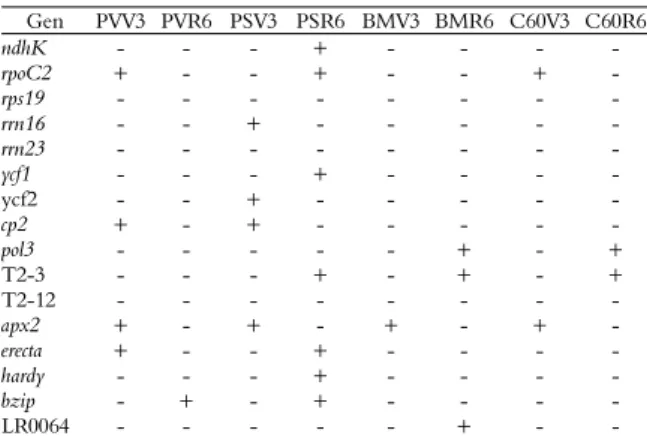
expressed differentially in both cultivars at the R6 stage. The T2-3 fragment of unknown function was expressed in response to limited water in C60, BM and PS at the R6 stage; this suggests that its expression is important in the onset of flowering in these conditions (Table 4).
Table 4. Differential gene expressions in the 20% water regimen.
Gen PVV3 PVR6 PSV3 PSR6 BMV3 BMR6 C60V3 C60R6
ndhK - - - + - - - -
rpoC2 + - - + - - + -
rps19 - - -
rrn16 - - + - - -
rrn23 - - -
ycf1 - - - + - - - -
ycf2 - - + - - -
cp2 + - + - - - - -
pol3 - - - - - + - +
T2-3 - - - + - + - +
T2-12 - - - - - -
apx2 + - + - + - + -
erecta + - - + - - - -
hardy - - - + - - - -
bzip - + - + - - - -
LR0064 - - - + - -
Pinto Villa (PV), Pinto Saltillo (PS), Bayo Madero (BM), Canario 60 (C60), vegetative stage (V3), reproductive stage (R6), differential expression related to WUE (+), expression not related to WUE (-).
Although most of the genes that differentially expressed did in the drought tolerant cultivars, the
differential expression of apx2 and rpoC2 in the V3
stage, of T2-3, LR0064, and g564 fragments in the
R6 stage in susceptible cultivars, indicates that these cultivars also have responsive elements to limited water regimen, such as observed in the instantaneous and integral WUE characterization. However, the susceptible cultivars were not as efficient as the tolerant under that stressful condition. In the characterization of WUE both drought tolerant cultivars were more efficient to use water under limited conditions with respect to susceptible; nevertheless, tolerant cultivars increased their WUE throughout instant and integral mechanisms that were essentially different. Therefore, it was expected that the genetic elements herein characterized had different expression patterns. Results suggests that it is possible to improve the WUE trait by means of assisted
selection with ycf2, rrn16, rpoC2, hardy, erecta, ndhK,
and ycf1 genes, using them as expression markers.
Although some elements did not differentially express as it was reported (Ruiz-Nieto et al., 2015), likely since we used a different seed lot with respect to the seed used originally to identify WUE related genes, therefore it would be expected that as the selection of inbreed line proceeds, the number of differential expression elements would increase.
Conclusion
Drought tolerant cultivars displayed different WUE, since under limited water conditions PS was able to modulate its stomatal and keep a high photosynthetic rate with a low transpiration, while
PV despite of also having a high CO2 assimilation, it
had a higher conductance and transpiration rate than PS. Consequently, the seed production had a lower
water cost in PS. The genes ycf2, rrn16, rpoC2, hardy,
ndhK, erecta, and ycf1 were differentially expressed under limited conditions relative to physiological WUE only in cultivar PS, confirming that the mechanisms for the efficient use of water are essentially different between drought tolerant cultivars.
Acknowledgements
This research was supported by INIFAP-SAGARPA 1225619346 project.
References
Ahuja, I., de Vos, R. C., Bones, A. M., & Hall, R. R. (2010). Plant molecular stress responses face climate change. Trends in Plant Science, 15(12), 664-674. doi: 10.1016/j.tplants.2010.08.002
Bramley, H., Turner, N. C., & Siddique, K. H. (2013). Water use efficiency. In C. Kole (Ed.), Genomics and breeding for climate-resilient crops (p. 225-268). Berlin, Heidelberg, GE: Springer. doi: 10.1007/978-3-642-37048-9_6
Crimmins, S. M., Dobrowski, S. Z., Greenberg, J. A., Abatzoglou, J. T., & Mynsberge, A. R. (2011). Changes in climatic water balance drive downhill shifts in plant species’ optimum elevations. Science, 331(6015), 324-327. doi: 10.1126/science.1199040
Cuellar‐Ortiz, S. M., Arrieta‐Montiel, M. P.,
Acosta‐Gallegos, J., & Covarrubias, A. A. (2008). Relationship between carbohydrate partitioning and drought resistance in common bean. Plant Cell & Environment, 31(10), 1399-1409. doi: 10.1111/j.1365-3040.2008.01853.x
Page 8 of 8 Tavera et al.
diverse PCR based downstream applications. SpringerPlus, 2(1), 669. doi: 10.1186/2193-1801-2-669 Devi, M. J., Bhatnagar‐Mathur, P., Sharma, K. K., Serraj,
R., Anwar, S. Y., & Vadez, V. (2011). Relationships between transpiration efficiency and its surrogate traits in the rd29A: DREB1A transgenic lines of groundnut. Journal of Agronomy and Crop Science, 197(4), 272-283. doi: 10.1111/j.1439-037X.2011.00464.x
FAOSTAT. (2017). Retrieved on June 9, 2017 from http://fao.org/faostat.
Godfray, H. C. J., Beddington, J. R., Crute, I. R., Haddad, L., Lawrence, D., Muir, J. F., Pretty, J., Thomas, S. M., & Toulmin, C. (2010) Food security: the challenge of feeding 9 billion people. Science, 327(5967), 812-818. doi: 10.1126/science.1185383 Hanjra, M. A., & Qureshi, M. E. (2010). Global water
crisis and future food security in an era of climate
change. Food Policy, 35(5), 365-377. doi:
10.1016/j.foodpol.2010.05.006
Hatfield, J. L., Boote, K. J., Kimball, B. A., Ziska, L. H., Izaurralde, R. C., Ort, D., Thomson, A. M., & Wolfe, D. (2011). Climate impacts on agriculture: implications for crop production. Agronomy Journal, 103(2), 351-370. doi: 10.2134/agronj2010.0303 Jensen, E. S., Peoples, M. B., Boddey, R. M., Gresshoff, P.
M., Hauggaard-Nielsen, H., Alves, B. J., & Morrison, M. J. (2012) Legumes for mitigation of climate change and the provision of feedstock for biofuels and biorefineries. A review. Agronomy for Sustainable Development, 32(2), 329-364. doi: 10.1007/s13593-011-0056-7
Jesus, W. C., Vale, F. X. R., Coelho, R. R., & Costa, L. C. (2001) Comparison of two methods for estimating leaf area index on common bean. Agronomy Journal,93(5), 989-991. doi: 10.2134/agronj2001.935989x
Kahlon, C. S., Board, J. E., & Kang, M. S. (2011). An analysis of yield component changes for new vs old soybean cultivars. Agronomy Journal, 103(1), 13-22. doi: 10.2134/agronj2010.0300
Karaba, A., Dixit, S., Greco, R., Aharoni, A., Trijatmiko, K., Marsch, N., Krishnan, A., Nataraja, K., Udayakumar, M., & Pereira, A. (2007). Improvement of water use efficiency in rice by expression of HARDY, an Arabidopsis drought and salt tolerance gene. Proceeding of the National Academy of Science, 104(39), 15270-15275. doi: 10.1073/pnas.0707294104 Logemann, J., Schell, J., & Willmitzer, L. (1987).
Improved method for the isolation of RNA from plant tissues. Analytical Biochemistry, 163(1), 16-20. doi: 10.1016/0003-2697(87)90086-8
Molden, D., Oweis, T., Steduto, P., Bindraban, P., Hanjra, M. A., & Kijne, J. (2010). Improving agricultural water productivity: between optimism and caution. Agricultural Water Management, Comprehensive Assessment of Water Management in Agriculture, 97(4), 528–535. doi: 10.1016/j.agwat.2009.03.023
Montero-Tavera, V., Escobedo-Landín, M. A., Acosta-Gallegos, J. A., Anaya-Lopez, J. L., & Ruiz-Nieto, J. E.
(2017). 26S: Novel reference gene from leaves and roots of common bean for biotic stress expression expression studies based on PCR. Legume Research: An International Journal, 40(3), 439-433. doi: 10.18805/lr.v0iOF.7859
Recchia, G. H., Caldas, D. G. G., Beraldo, A. L. A., Silva, M. J., & Tsai, S. M. (2013). Transcriptional analysis of drought-induced genes in the roots of a tolerant genotype of the common bean (Phaseolus vulgaris L.). International Journal of Molecular Science, 14(4), 7155-7179. doi: 10.3390/ijms14047155
Reynolds-Henne, C. E.; Langenegger, A., Mani, J., Schenk, N., Zumsteg, A., & Feller, U. (2010). Interactions between temperature, drought and stomatal opening in legumes. Environmental and
Experimental Botany, 68(1), 37-43. doi:
10.1016/j.envexpbot.2009.11.002
Rosales, M. A., Ocampo, E., Rodríguez-Valentín, R., Olvera-Carrillo, Y., Acosta-Gallegos, J., & Covarrubias, A. A. (2012). Physiological analysis of common bean (Phaseolus vulgaris L.) cultivars uncovers characteristics related to terminal drought resistance. Plant Physiology and Biochemistry, 56(1), 24-34. doi: 10.1016/j.plaphy.2012.04.007
Ruiz-Nieto, J. E., Aguirre-Mancilla, C. L., Acosta-Gallegos, J. A., Raya-Pérez, J. C., Piedra-Ibarra, E., Vázquez-Medrano, J., & Montero-Tavera, V. (2015). Photosynthesis and chloroplast genes are involved in water-use efficiency in common bean. Plant Physiology
and Biochemistry, 86(1), 166-173. doi:
10.1016/j.plaphy.2014.11.020
Sauer, T., Havlík, P., Schneider, U. A., Schmid, E., Kindermann, G., & Obersteiner, M. (2010). Agriculture and resource availability in a changing world: The role of irrigation. Water Resources Research, 46(6), 1-12. doi: 10.1029/2009WR007729
Shao, H. B., Chu, L. Y., Jaleel, C. A., & Zhao, C. X. (2008). Water-deficit stress-induced anatomical changes in higher plants. Comptes Rendus Biologies, 331(3), 215-225. doi: 10.1016/j.crvi.2008.01.002 Wilson, P. B., Estavillo, G. M., Field, K. J., Pornsiriwong,
W., Carroll, A. J., Howell, K. A., …, Pogson, B. J. (2009). The nucleotidase/phosphatase SAL1 is a negative regulator of drought tolerance in Arabidopsis. The Plant Journal, 58(2), 299-317. doi: 10.1111/j.1365-313X.2008.03780.x
Zlatev, Z., & Lidon, F. C. (2012). An overview on drought induced changes in plant growth, water relations and photosynthesis. Emirates Journal of Food and Agriculture, 24(1), 57. doi: 10.9755/ejfa.v24il.10599
Received on September 8, 2017. Accepted on December 15, 2017.