Crop Breeding and Applied Biotechnology 11: 270-275, 2011
Brazilian Society of Plant Breeding. Printed in Brazil
Received 17 December 2010
Accepted 9 June 2011
The difference between breeding for nutrient use
The difference between breeding for nutrient use
The difference between breeding for nutrient use
The difference between breeding for nutrient use
The difference between breeding for nutrient use
efficiency and for nutrient stress tolerance
efficiency and for nutrient stress tolerance
efficiency and for nutrient stress tolerance
efficiency and for nutrient stress tolerance
efficiency and for nutrient stress tolerance
Ciro Maia1*, Júlio César DoVale2, Roberto Fritsche-Neto2, Paulo Cezar Cavatte3 and Glauco Vieira Miranda2
ABSTRACT – This study aimed to verify the relationship between breeding for tolerance to low levels of soil nutrients and for nutrient use efficiency in tropical maize. Fifteen inbred lines were evaluated in two greenhouse experiments under contrasting levels of N and P. The relationship between nutritional efficiency and tolerance to nutritional stress was estimated by the Spearman ranking correlation between the genotypes for the traits related to N and P use efficiency and phenotypic plasticity indices. The lack of relationship between the traits, in magnitude as well as significance, indicates that these characters are controlled by different gene groups. Consequently, simultaneous selection for both nutrient use efficiency and tolerance to nutritional stress is possible, if the mechanisms that confer efficiency and tolerance are not competitive.
Key words: plant breeding; abiotic stress; Zea mays L.
INTRODUCTION
Some alternatives to meet the increasing global food demand consist in the possibility of planting between the main growing seasons, as done with some agricultural species, although yields are often not very satisfactory; the increase of yields, which in some crops seems to have reached maximum levels; and cropland expansion, an alternative that ensures greater production of food and agro-industrial raw materials, especially in emerging and developing countries. This can open the possibility of growing a significant portion of agricultural crops in marginal, mostly little fertile areas (Giaveno et al 2007).
When the restricted availability of water and soil nutrients is limiting for plant growth and development, the metabolism, mass and surface of several plant organs is affected, thus reducing crop yields (Sultenfuss and Doyle
1999). Different breeding programs and lines of research have therefore been established, focused on the improvement of plants grown under abiotic stress. Two breeding strategies focus on this objective: breeding for tolerance to low water and nutrient availability or for efficiency in their use.
Shafi-ur-Rehman et al (2005) understand stress as a significant deviation from the ideal conditions for plant growth, preventing the expression of the full genetic potential for growth, development and reproduction. According to Larcher (2006), induced changes and responses at all functional levels of the organism may be reversible at first, but if extended over the whole plant cycle they become irreversible and consequently reduce the plant yield.
The concept of tolerance to a particular stress is quite broad, but is related to the plant’s ability to resist
1 Universidade Federal de Viçosa (UFV), Departamento de Biologia Geral, 36.570-000, Viçosa, MG, Brazil. *E-mail: [email protected] 2 Departamento de Fitotecnia, UFV
adverse conditions, survive and reproduce. The metabolic energy expenditure to ensure plant survival depends on the stress characteristics, which involves different mechanisms. In an agronomic sense, Miti et al. (2010) defined tolerance as the reduction in grain yield under stress, compared with the yield under ideal growth. However, Cruz et al. (2004) reported that genotypes with tolerance to adverse environments (stress conditions) are generally the least productive.
The efficient use of resources (UsE), of water or nutrients, is defined as the ratio between grain yield per unit of resource available to plants. In studies conducted in the early stages of plant development, the UsE is usually estimated based on shoot dry matter instead of grain yield. A given genotype is considered efficient if it produces satisfactorily under low resource availability (Good et al. 2004).
The UsE is composed of the uptake efficiency (UpE) and utilization efficiency (UtE). UpE is defined as the ability of a given genotype to absorb certain soil nutrients or water, while UtE corresponds to the ability of this genotype to produce biomass or grain using the absorbed resource. According to Hirel et al. (2007), genotypes with increased efficiency in the use of these resources can be obtained by increasing the UpE and/or the UtE.
The ability of the genotypes to develop, grow and reproduce under stress conditions, is understood by some authors as tolerance to low nutrients (Oliveira et al. 1999), by others as efficiency of nutrient use (Fritsche-Neto et al. 2010).
In both cases, tolerance or efficiency, the plant uses physiological and sometimes anatomical mechanisms to avoid stress or recover quickly from its effects (Zheng et al. 2000). In this sense, three main strategies plants use to cope with irregular resource availability were defined: i) specialization: a genotype becomes adapted to a specific environment; ii) generalization: a genotype with moderate suitability for most environments and iii) phenotypic plasticity: environmental signals can interact with the genotype and stimulate the production of alternative phenotypes.
The farmer desires cultivars that produce satisfactory yield under stress conditions, but which respond to ideal conditions with yield increases. Considering the above concepts, the simultaneous improvement for tolerance and efficient use of resources would seem contradictory in physiological terms. In addition, there is, to some extent, a blurring of the difference between terms in many papers, and consequently, in their goals and lines of research.
According to Bradshaw (2006), phenotypic plasticity is highly correlated with yield stability. Thus, low plasticity (or high stability) is not always a desirable characteristic. The reason is that yields of tolerant genotypes are usually moderate, even under ideal growing conditions, which is interesting for cropping in marginal regions under permanent stress. Thus, the productivity of these “generalized” genotypes is higher in environments with low resource availability. However, under non- limiting environmental conditions, there is no significant yield increase.
Given this fact, much of the improvement studies aim at an increase of plant UsE, in other words, the breeding of genotypes with high phenotypic plasticity. Thus, when plants are grown under limiting cultivation conditions, they would use the scarce resources to produce satisfactory yields. However, under ideal conditions, yields would be high.
The genetic control of tolerance as well as use efficiency is quantitative and involves multiple loci distributed in different regions of the genome of crop species. The quantification and understanding of the genetic relationship between the plants selected by these two breeding strategies are essential as guidelines to increase the effectiveness of breeding programs. Given the above, the purpose of this study was to verify the relationship between improvement for the nutrient use efficiency and for stress tolerance to low levels of soil nutrients in tropical maize plants.
MATERIAL AND METHODS
Plant material and experimental design
germination cells. After emergence, the seedlings (one per line) were planted in cylindrical 4 dm3 plastic pots (diameter
10 cm, height 50 cm). The substrate for Experiment 1 consisted of a mixture of sand-vermiculite (1:1) mixture, according to the methodology used by Walker et al (2006). For Experiment 2, a mixture of sand-vermiculite-soil of 50 %, 37.5 %, 12.5 %, respectively, was used. The soil was used to adsorb phosphorus and not leave it readily available to plants.
The nutrient solution was supplied every two days, as of the seventh day after germination. In Experiment 1 a solution as described by Chun et al. (2005) was used, containing (in mmol L-1): 2.0 Ca(NO
3)2, 0.75 K2SO4, 0.65
MgSO4, 0,1 KCl, 0.25 KH2PO4, 1 x 10⁻³ H3BO3, 1 x 10⁻³
MnSO4, 1 x 10⁻⁴ CuSO4, 1 x 10⁻³ ZnSO4, 5 x 10⁻⁶
(NH4)6Mo7O24, 0.1 Fe-EDTA, at two nitrogen levels, low
N (LN) and high N (HN). For LN, the solution contained 0.2 mmol L-1 Ca(NO
3)2, i.e., 10 times less, and Ca was
compensated by CaCl2. In Experiment 2, P was added in
the form of triple superphosphate. In the low phosphorus (LP) treatment, 20 mg dm-3 P was added and in the high
phosphorus (HP) treatment 104 mg dm-3 P. The other
nutrients were supplied in the nutrient solution without phosphorus addition, containing: 1.0M Ca(NO3)2.4H2O,
1.0M MgSO4.7H2O, 0.5M K2SO4, 0.32 mM CuSO4.5H2O,
46.0 mM H3BO3, 0.073 mM (NH4)6Mo7O24, 9.1 mM
MnCl2.4H2O, 0.76 mM ZnSO4.7H2O, and 38.0 mM
Fe-EDTA.
Seedlings were harvested in the vegetative stage V4 (four fully expanded leaves), approximately 25 days after sowing. The shoot was separated from the root system, wrapped in paper bags and dried in a forced-air oven at 60 °C for 72 hours.
Determination of nutritional efficiency and indices of phenotypic plasticity
The root system was evaluated by image analysis, using software WinRHIZO Pro 2009a (Basic, Reg, Pro & Arabidopsis for Root Measurement) coupled to an EPSON Perfection V700/V750 scanner equipped with additional light (transparency unit), at a resolution of 400 dpi, as described by Bouma et al. (2000). The length of the axial and lateral roots was extracted from the total diameter classes (Φ), obtained by WinRHIZO; the length of the lateral roots LLAT (Φ < 0.5 mm) and axial - LAXI (Φ > 0.5 mm), according to Trachsel et al. (2009). The genotypes were also evaluated for shoot dry matter (SDM), root dry matter (RDM), root shoot ratio (RSR), and for the two components
of use efficiency of nitrogen and phosphorus, as proposed by Hirel et al (2007): i) uptake efficiency (UE = N or P in plant /N or P applied) ii) utilization efficiency (UtE = shoot dry matter/N or P in plant).
To calculate the tolerance of genotypes to low N and P availability, the phenotypic plasticity index was used as proposed by Valladares et al. (2000),
in which Cmax is the trait performance under ideal, and Cmin under stress conditions. The index was calculated for each genotype for the traits SDM, RSR, and length of axial and lateral roots. Thus, a given genotype is considered tolerant when they have less yield variation at contrasting N and P levels.
Statistical analyses
Data of the variables UpEN UsEN, UpEP, UsEP, and RSR were transformed by , while for the variables length of the axial and of the lateral roots, log(x + 1) was used. Subsequently, statistical analyses were performed using mixed model equations, as described by Bernardo (2002):
where y is the vector of phenotypic data of the line means; r is the vector of effect of replication within the N or P levels (fixed); g is the vector of genotype effects of the lines (random), where g ~ N(O, G), and ; i is the vector of effects of the interaction lines x N or P levels (random); and e is the vector of errors, where e ~ N(O, R) and . X, Z and W are incidence matrices that relate, respectively, the effects of r,gandi with vector y.
In the mixed model analysis, G refers to the genetic covariance matrix between the lines, and is denoted by Aσ . In this study the coefficient of relationship (A) was disregarded and, consequently, the matrix G was assumed to be Iσ , i.e., A=I. Consequently, σ is equivalent to genetic variance between lines and the vector g corresponds to the predictions of genotypic values of the lines. To obtain the above solutions, the components of genetic and nongenetic variance were assumed as unknown and estimated by restricted maximum likelihood method (DF-REML).
The mixed model equations for the prediction of r, g andi correspond to:
I = (Cmax - Cmin) Cmax
,
y = Xr + Zg + Wi + e
G = Aσg2
R = Iσg2
2 g
2 g
2 g
where, and
is the broad-sense heritability of the lines and is the coefficient of determination of the interaction line x N or P level.
To understand the relationship between nutritional efficiency and stress tolerance to low nutrient availability the correlations between the ranking of the lines for the traits related to N and P use efficiency and the indices of phenotypic plasticity were estimated. These were calculated by the correlation coefficient of Spearman’s (ρ), by
where is the difference between the position of each corresponding value of x and y and n the number of pairs of values. The broad-sense heritability was estimated by
(Karsey and Pooni 1996). All tests were performed using the statistical package SAS, version 9.1 (SAS Institute 2003).
RESULTS AND DISCUSSION
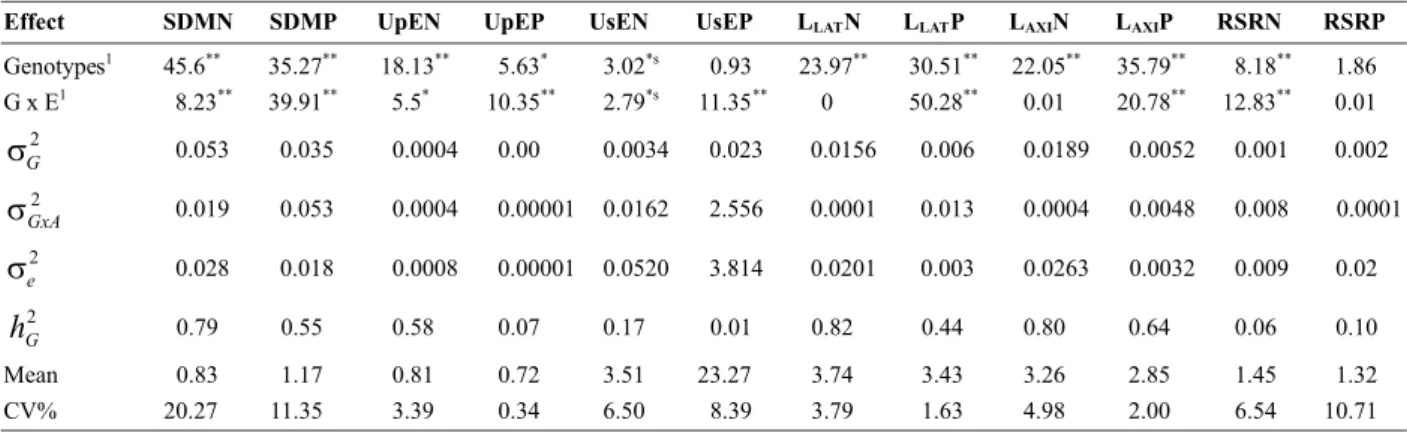
Genotypes differed significantly in the analysis of deviance for most traits, with the exception of UtE and the root-shoot ratio (RSR) in the P environments (low and high) (Table 1). The significant differences observed indicated the existence of genetic variability among lines, which allows selection and possible genetic gains. A differential response of these lines to contrasting N and P levels was also observed, as evidenced by the significant effect of genotype - environment interaction. The root-related traits in both N and RSR in both P environments were exceptions. This differential behavior indicates the possibility of hybrid combinations in an improvement program, and/or the formation of specific populations for each environment.
The heritability of the traits shoot dry matter (SDM) and root morphology of N and P environments was medium to high. This indicates that direct or indirect selection can achieve satisfactory gains. For almost all traits the highest overall mean values were observed in the experiment with N for P, except for UsEP and SDM in HP. This result shows that more N than P is required for biomass production in maize seedlings. The coefficients of variation showed values within the acceptable levels for this type of study
for all traits, indicating good experimental accuracy and high reliability of the estimates.
Considering the relationship between the characters, no significant correlation between the efficiency components and indexes of phenotypic plasticity was observed (Table 2). This lack of relationship between the traits, both in magnitude and significance, indicate that these groups are controlled by different gene. Thus there is a possibility of simultaneous selection for efficient nutrients use together with stress tolerance, if the mechanisms that confer efficiency and tolerance are not competitive. Although the results of this study are consistent, it is worth remembering that many of the observed correlations have a negative sign. With a greater effective size the magnitude may increase and become significant. Therefore, the relationship between use efficiency and tolerance is negative. Under heterogeneous conditions of time and space, genotypes develop strategic mechanisms to adapt to the adverse stressful conditions by changing structural and functional characteristics of their tissues, mainly leaves and roots, resulting in changes in the growth and yield pattern (Sultan 1995). However, the amount of time and metabolic energy available is limited. Each strategy adopted by the plant could represent an allocation or partition of the time and energy, reducing resources that could be used by the plant for the development of other structures (Trewavas 2005). Thus, the resource demand to develop strategic mechanisms in a same plant to face different environmental challenges could make these plants inefficient.
From the physiological point of view, it is hoped that the most efficient plants in terms of nutrient use are not the most tolerant to nutrient insufficiency. The phenotypic plasticity index of tolerant plants is lower, in other words, the yield difference between stressed and unstressed environments is smaller (Valladares et al. 2000). On the other hand, plants with highest levels of plasticity can be considered the most efficient in the use of natural resources. This is due to the fact that small increases in the availability of resources result in substantial productivity increases.
In the case of breeding for nutritional stress, responsive plants are sought, i.e., plants with significant yield increases under increased availability of resources. For some stresses, e.g, of nutrients and water, selection should be performed for use efficiency (Souza et al. 2008). However, for other growth-limiting factors (temperature, high soil aluminum concentration, salinity), plants should be selected for tolerance.
hg2 hi2
Finally, the results of this study demonstrate the absence of relation between genotypes efficient at using and tolerant to low availability of nutrients. However, there is need for more studies in this direction, seeking a deeper understanding of the relationship between the nature and relationship between resource use efficiency and tolerance to resource scarcity, with a view to increase the efficiency of breeding programs to abiotic stress conditions.
ACKNOWLEDGEMENTS
The authors would like to thank the Conselho Nacional de Desenvolvimento Científico e Tecnológico (CNPq), Coordenação de Pessoal de Nível Superior (CAPES) for financial support, and Departamento de Fitotecnia, Universidade Federal de Viçosa, Brazil.
Table 1. Statistical values of the likelihood-ratio test (LRT) of the deviance analysis and estimates of genetic parameters
1 LRT values; Significant at **P = 0.01, *P = 0.05, and *s P = 0.10 by the χ2 test. Genotypic variance ( ), variance of the interaction
genotypes x N or P levels ( ), residual variance ( ), broad-sense heritability ( ), general mean and coefficient of variation (CV%) of shoot dry matter in environments of nitrogen (SDMN) and phosphorus (SDMP) uptake efficiency of nitrogen (UpEN) and phosphorus (UpEP), use efficiency of nitrogen (UsEN) and phosphorus (UsEP), lateral root length in the environments of nitrogen (LLATN) and phosphorus (LLATP), axial root length in environments of nitrogen (LAXIN) and phosphorus (LAXIP), and of the root:shoot ratio in environments of contrasting nitrogen (RSRN) and phosphorus (RSRP) levels of 15 tropical maize lines.
σ2 G σ2
GxA σe2 σ
2 G
Table 2. Coefficients of correlation of ranks of Spearman between plasticity indices
1Spearman’s ranking correlation, non-significant at 5% probability by the t test. Shoot dry matter (iSDM), lateral root length (iL
Diferença entre melhoramento para eficiência no uso
Diferença entre melhoramento para eficiência no uso
Diferença entre melhoramento para eficiência no uso
Diferença entre melhoramento para eficiência no uso
Diferença entre melhoramento para eficiência no uso
de nutrientes e para tolerância a estresse nutricional
de nutrientes e para tolerância a estresse nutricional
de nutrientes e para tolerância a estresse nutricional
de nutrientes e para tolerância a estresse nutricional
de nutrientes e para tolerância a estresse nutricional
RESUMO- Este trabalho teve como objetivo verificar em milho tropical a relação entre melhoramento para tolerância a estresse por baixos níveis de nutrientes no solo e para eficiência nutricional. Foram avaliadas 15 linhagens endogâmicas em dois experimentos conduzidos em casa de vegetação, sob condições contrastantes de N e P. A relação entre eficiência nutricional e tolerância a escassez de nutrientes foi estimada por meio da correlação de postos de Spearman entre o rank das linhagens para os caracteres relacionados à eficiência do uso de N e P e os índices de plasticidade fenotípica. A falta de relação entre os caracteres avaliados, tanto pela significância como pela magnitude, indicam que esses são controlados por grupos gênicos diferentes. Desse modo, haveria a possibilidade da seleção simultânea tanto para eficiência do uso de nutrientes como para tolerância a estresse, se mecanismos que conferem eficiência e tolerância não forem competitivos.
Palavras-chave: melhoramento vegetal; estresse abiótico; Zea mays L.
REFERENCES
Bernardo R (2002) Breeding for quantitative traits in plants. Stemma Press, Woodbury, 369p.
Bouma TJ, Nielsen KL and Koutstaal B (2000) Sample preparation and scanning protocol for computerised analysis of root length and diameter. Plant Soil218: 185-196.
Bradshaw AD (2006) Unravelling phenotypic plasticity – why should we bother? New Phytologist 170: 644-648.
Chun L, Mi GH, Li JS, Chen FJ and Zhang FS (2005) Genetic analysis of maize root characteristics in response to low nitrogen stress. Plant Soil276: 369-382.
Cruz CD, Regazzi AJ and Carneiro PCS (2004) Modelos biométricos aplicados ao melhoramento genético. 3rd ed.,
vol. 1, Editora UFV, Viçosa, 480p.
Fritsche-Neto R, Miranda GV, DeLima RO, Souza LV and SilvaJ (2010) Herança de caracteres associados à eficiência de utilização do fósforo em milho. Pesquisa Agropecuária Brasileira 45: 465-471.
Giaveno CD, Ribeiro RV, Souza GM and Oliveira RF (2007) Screening of tropical maize for salt stress tolerance. Crop Breeding and Applied Biotechnology 7: 304-313.
Good AG, Shrawat AK and Muench DG (2004) Can less yield more? Is reducing nutrient input into the environment compatible with maintaining crop production? Trends Plant Science 9: 597-605.
Hirel B, Le Gouis J, Ney B and Gallais A (2007) The challenge of improving nitrogen use efficiency in crop plants: towards a more central role for genetic variability and quantitative genetics within integrated approaches. Journal Experimental Botany 58: 2369-2387.
Kearsey MJ and Pooni HS (1996) The genetical analysis of quantitative traits. Champman and Hall, London, 381p.
Larcher W (2006) Ecofisiologia vegetal. Rima, São Carlos, 550p.
Miti F, Tongoona P and Derera J (2010) S1 selection of local maize landraces for low soil nitrogen tolerance in Zambia.
African Journal of Plant Science 4: 67-81.
Oliveira WR, Casali VWD, Pereira PRG, Cruz CD, Pires NM (1999) Tolerância de genótipos de pimentão ao baixo teor de fósforo no solo. Bragantia58: 125-139.
SAS Institute (2003) SAS/STAT software version 9.1. SAS, Cary.
Shafi-ur-Rehman, Harris PJC and Ashraf M (2005) Stress environments and their impact on crop production. In: Ashraf M and Harris PJC (eds) Abiotic stress – plant resistance through breeding and molecular approaches. Food Products Press, New York, 725p.
Souza LV, Miranda GV, Galvão JCC, Eckert FR, Mantovani EE, Lima RO and Guimarães LJM (2008) Genetic control of grain yield and nitrogen use efficiency in tropical maize. Pesquisa Agropecuária Brasileira 43: 1517-1523.
Sultan SE (1995)Phenotypic plasticity and plant adaptation. Acta Botanica Neerlandica 44: 363-383.
Sultenfuss JH and Doyle WJ (1999) Phosphorus for agriculture.
Better Crops with Plant Food 83: 1-40.
Trachsel S, Messmer R, Stamp P and Hund A (2009) Mapping of QTLs for lateral and axile root growth of tropical maize.
Theoretical Applied Genetics 119: 1413-1424.
Trewavas A (2005)Green plants as intelligent organisms. Trends in Plant Science10: 413-419.
Valladares F, Wright JS, Lasso E, Kitajima K and Pearcy RW (2000) Plastic phenotypic response to light of 16 congeneric shrubs from a Panamanian rainforest. Ecology 8: 1925-1936.
Walker TC, Jaramillo R and Lynch JP (2006) Architectural tradeoffs between adventitious and basal roots for phosphorus acquisition.
Plant Soil 279: 347-366.