(Annals of the Brazilian Academy of Sciences) ISSN 0001-3765
www.scielo.br/aabc
Biaxial testing of canine annulus fibrosus tissue
under changing salt concentrations
JACQUES M. HUYGHE
Department of Biomedical Engineering, Engineering Mechanics Institute, Eindhoven University of Technology, P.O. Box 513, 5600MB Eindhoven, The Netherlands
Manuscript received on July 3, 2008; accepted for publication on February 2, 2009
ABSTRACT
Thein vivomechanics of the annulus fibrosus of the intervertebral disc is one of biaxial rather than uniaxial loading. The material properties of the annulus are intimately linked to the osmolarity in the tissue. This paper presents biaxial relaxation experiments of canine annulus fibrosus tissue under stepwise changes of external salt concentration. The force tracings show that stresses are strongly dependent on time, salt concentration and orientation. The force tracing signature of a response to a change in strain, is one of a jump in stress that relaxes partly as the new strain is maintained. The force tracing signature of a stepwise change in salt concentration is a progressive monotonous change in stress towards a new equilibrium value. Although the number of samples does not allow any definitive quantitative conclusions, the trends may shed light on the complex interaction among the directionality of forces, strains and fiber orientation on one hand, and on the other hand, the osmolarity of the tissue. The dual response to a change in strain is understood as an immediate response before fluid flows in or out of the tissue, followed by a progressive readjustment of the fluid content in time because of the gradient in fluid chemical potential between the tissue and the surrounding solution.
Key words:swelling, collagen, osmosis, Donnan, cartilaginous.
INTRODUCTION
Intervertebral disc tissue is a very deformable molecular mixture of an ionized solid and an ionised fluid. It is composed of a gelly-like core, the nucleus pulposus, en-closed within a fibrous ring, the annulus fibrosus. Both are composed of a crosslinked collagen network embed-ded into a gel of hydrated proteoglycans, in different ratios. The swelling of the tissue is primarily generated by the ionized proteoglycans. Though, it is estimated that 20% of the water is absorbed by the collagen net-work. Different modelling strategies have been proposed to grasp its coupled electro-chemo-mechanical proper-ties (Huyghe 1999, Iatridis et al. 2003, van Loon et al. 2003, Huyghe et al. 2003, Schroeder et al. 2006,
Selected paper presented at the IUTAM Symposium on Swelling and Shrinking of Porous Materials: From Colloid Science to Poro-mechanics – August 06-10 2007, LNCC/MCT.
E-mail: [email protected]
METHODS
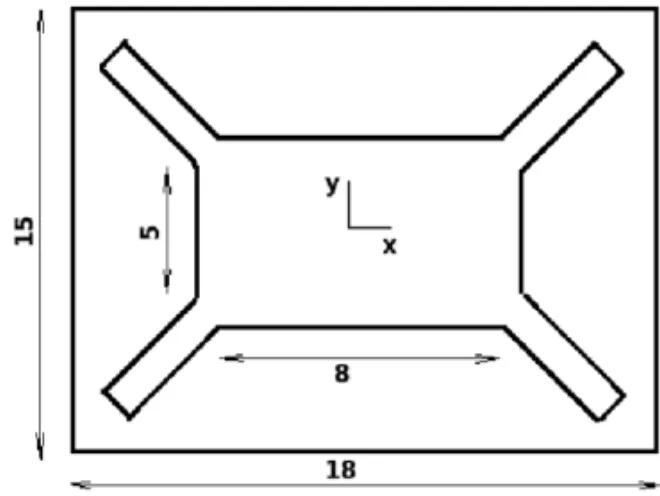
Lower lumbar motion segments were cut from spines of 2 mongrel dogs and stored at −65 degrees centigrade. One of the vertebral bodies of a motion segment was sawed away almost completely, so that at most a thin layer of bone remained on the top of the intervertebral discs. The posterior half of the segment (arch) was sawed away. The anterior part of the motion segment was al-lowed to thaw. The surrounding muscle and fat tissues were removed with a scalpel. The nucleus pulposus was carefully removed. During this process, the disc was kept moist by dripping with a physiological salt solution. Lamellae at the anterior part of the annulus fibrosus of at least 10 mm length and a minimal number of branches were selected under the stereo microscope. Lamellae were separated by blunt dissection. Finally, a sample of 10 mm (circumferentially) by 2 to 8 mm (axially) is cut. The thickness of the lamellae was inhomogenous and variable, about 1 mm. The anterior side of each sample was glued upon a flexible polystyrene frame of 15 to 18 mm (Fig. 1) using cyanoacrylate glue (Hyloglue M-100). The frame was cut diagonally to create 4 lips at the 4 sides of the sample, 2 of 15 mm width and 2 other of 18 mm. Traction exerted on 2 opposite 15 mm lips resulted in an extension of the samples along their long axis, i.e. the circumferential direction in the disc. Traction exerted on 2 opposite 18 mm lips resulted in extension of the samples along their short axis, i.e. in the axial direction in the disc. The long axis of the sample had an angle of approximately 30 degrees with the col-lagen fiber direction. The thickness of the polystyrene lips was 0.5 mm. 3 samples (Table I) were stored at
−65 degrees centigrade until use.
A sample was taken out of the freezer, allowed to thaw and, after about 15 minutes, mounted into a horizontal mechanical drawing bench by clamping the polystyrene lips. The 15 mm lips were gripped in 2 op-posite clamps moving in the x-direction, and the 18 mm lips were gripped in 2 opposite clamps moving in the y-direction. The procedure is based upon the work of (Myers et al. 1984), (Akizuki et al. 1986) and (Huyghe and Drost 2004). The displacement of 2 x-clamps of the drawing bench was computer controlled. The tensile forces in x- and y-directions were measured by means of 2 force transducers. Above the samples, 2 dripping
Fig. 1 – Geometry of the polystyrene frame that is used to fix the samples into the biaxial drawing bench. The x-direction coincides with the circumferental direction of the annulus fibrosus sample.
devices were mounted, one filled with distilled water, and the other filled with a physiological salt solution. The external salt concentration and the clamp position were changed in a stepwise fashion.
RESULTS
TABLE I
Samples tested in the biaxial testing device.
sample number thickness (mm) origin force tracings 1 1≥1z center annulus Figs. 2 and 3
2 1z≈1 outer annulus Fig. 4
3 1.1≥1z≥1 outer annulus Fig. 5
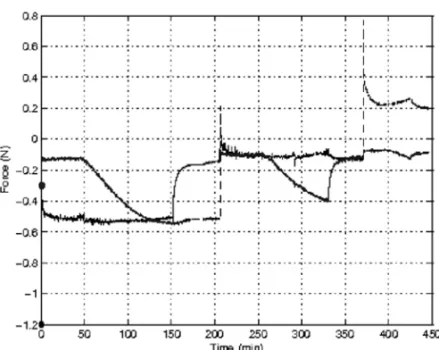
have been untouched. Att = 60 min, a stepwise in-crease in x-strain of 6% starts the experiment B (Fig. 3). The y-clamps are immobile during the experiment B. Att = 120 min, the x-strain is increased by 6%. The external salt concentration is physiological, except dur-ing the periods betweent =80 min and t = 100 min and between 140 min and 160 min in which the concen-tration is zero. The contact with distilled water results in an increase of the forces in absolute values (Fig. 3). The experimental measurement of forces on sample 2 are shown in Figure 4, while those associated with sam-ple 3 are shown in Figure 5. The applied boundary con-ditions are found in the respective captions of the fig-ures. In Figure 4, the x-force has a minor response on changes in salt concentration and a mayor response on the imposed steps of x-strain, while the y-force does the opposite. The y-force responds to a decrease in salt con-centration from physiological to zero by a forceful move towards compressive scales. All of the samples exhibit relaxation behavior which continues long after changes in external bath concentrations and strain.
DISCUSSION
The force tracings show strong time, salt concentration and orientation-dependent stresses. The force tracing signature of a response to a change in strain, is one of a jump in stress that relaxes partly as the new strain is maintained. The force tracing signature of a stepwise change in salt concentration is a progressive monotonous change in stress towards a new equilibrium value. When the external concentrationcext of NaCl is reduced from
0.15 M to 0 M, the result is an immediate decrease in external osmotic pressureπ =2RT cext. Hence, a steep
gradient of the water chemical potential and electrochem-ical potentials of the ions develops between the tissue and the solution. These gradients induce an influx of water into the tissue and an outflux of ions from the
tis-sue. Volume-wise the outflux of ions is negligible com-pared to the influx of water. The latter influx of water results in a change in clamp force with time. The time constant associated with the change in salt concentra-tion is typically longer than the time constant associ-ated with the step changes in strain. The response to the changes in strain represent a minimal adjustment of the ionic concentrations, and a major redistribution of the fluid between the sample and the external salt solution. However, the response to a change in salt concentration represents a major redistribution of both the salt and the fluid. The time constant1t associated with this fluid movement is typically
1t =(1z) 2
K H (1)
while the time constant for the redistribution of the salt is
1t =(1z) 2
D (2)
if we assume a negligible convection. In Eqs. (1-2), K
is the hydraulic permeability,Hthe transverse aggregate modulus of the sample,Dthe diffusion coefficient of the salt, and1zis the thickness of the sample. The results seem to indicate that the redistribution of the salt takes more time than the fluid redistribution:
K H ≥ D (3)
0 5 10 15 20 25 30 −4
−3 −2 −1 0 1 2
Time (min)
F
o
rce
(N
)
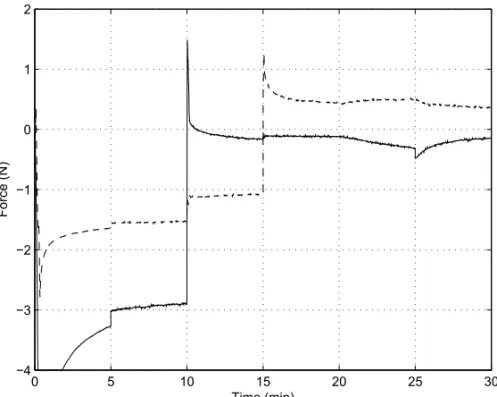
Fig. 2 – x-force recording (discontinuous line) and y-force recording (continuous line) as a function of time in experiment A of sample 1. The thickness of the sample is less than 1 mm. The width is about 8 mm. A−12% step in the y-strain is applied att=0 and a+6% step att=10 min. A+3% step in the x-strain is applied att=15 min. The external salt concentration is physiological, except between t=20 min andt=25 min where the concentration is zero. The sample is taken halfway the outer edge of the annulus fibrosus and the nucleus-annulus interface.
60 80 100 120 140 160 180
−1 0 1 2 3 4 5 6 7 8 9
Time (min)
F
o
rce
(N
)
Fig. 4 – Clamp force recordings in x-direction (black) and clamp force recordings in y-direction (blue) as a function of time in experiment 2. A solid black dot along the force scale indicates the force level att =0 for the x-tracing. A solid blue dot along the force scale indicates the force level att=0 for the y-trace. A 3% step in the strain is applied att=205 min, and an additional 6% step in the strain att=375 min in the x-direction. The strain in the y-direction is constant throughout the experiment.The external salt concentration is physiological, except in the periods betweent=50 min andt=150 min, betweent=255 min andt=330 min, and in the periodt=400 min and 430 min in which the external salt concentration is zero. The thickness of the sample is about 1 mm. The sample is taken from the outer annulus region. The clamp speed at which the step in the x-strains is applied is 0.05 mm/s.
a readjustment of stress in both directions, being it in dif-ferent measures. Although the small number of samples does not allow any definitive quantitative conclusions, the trends shown in the tracings may shed light on the complex interaction between the directionality of forces, strains and fiber orientation on the one hand and on the osmolarity of the tissue on the other hand. The dual re-sponse to a stepwise change in strain is understood as an immediate response before fluid flows in or out of the tis-sue, followed by a progressive readjustment of the fluid content in time because of the gradient in fluid chemical potential between the tissue and the surrounding solu-tion. The sensitivity to changes in salt concentration can be qualitatively understood in the context of chemoelec-tromechanical theory (Huyghe and Janssen 1997).
In Figure 4, the x-force has a minor response to changes in salt concentration, and a major response to the imposed steps of x-strain, while the y-force does the opposite. The behavior can be understood as the response of a sample in which the fibers are primarily oriented parallel to the x-axis. Indeed, the y-response is dominated by the proteoglycan gel swelling and shrinking under changing salt concentration, while the
x-response is sensitive to strains because of the stiffness of the fibers.
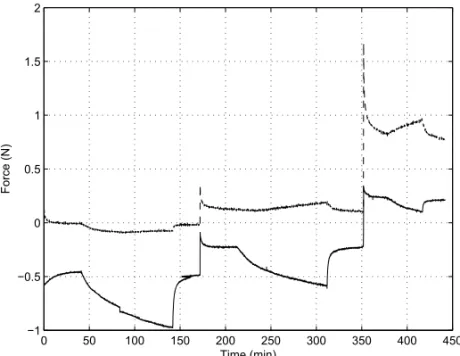
Unlike in Figure 4, the responses in Figure 5 of both force tracings to changes in x-strain and salt concentra-tions are similar.
0 50 100 150 200 250 300 350 400 450 −1
−0.5 0 0.5 1 1.5 2
Time (min)
F
o
rce
(N
)
Fig. 5 – Recording of x-force (upper tracing) and y-force (lower tracing) as a function of time in experiment 3. Att=170 min, a step in the x-strain of 3% is imposed, and att =350 min an additional step of 6% is imposed. The y-strain is constant. The external salt concentration is physiological except in the periods betweent=40 min andt=145 min, betweent=210 min andt=320 min, and in the periodt=380 min and 410 min in which the external salt concentration is zero. The thickness of the sample is between 1 mm and 1.1 mm. The sample is taken from the outer annulus fibrosus of the same disc as the sample of experiment 2 of Huyghe and Drost (2004). The clamp speed at which the step in the x-strain is applied is 0.05 mm/s.
ACKNOWLEDGMENTS
The author gratefully acknowledge the support of W. Meertens and M. van Hout for preparing the samples and performing the experiments, and M. Drost for his advise. This research is part of the project GENODISC (Call identifier: FP7-HEALTH-2007-A, Project number 201626), funded by the European Union.
RESUMO
A mecânica in vivo do anel fibroso do disco intervertebral é
baseada em carregamento biaxial ao invés de uniaxial. As
propriedades materiais do anel estão intimamente ligadas à
osmolaridade no tecido. O artigo apresenta experimentos de
relaxação biaxiais do anel fibroso de um tecido canino sob
mudanças abruptas na concentração externa de sal. A
assi-natura da força devido à mudança brusca de salinidade
re-sulta em uma progressiva e monótona mudança na tensão em direção a um novo valor de equilíbrio. Embora o número
de amostras não permita nenhuma conclusão quantitativa, as
tendências podem abrir uma luz no entendimento das
intera-ções complexas na direção das forças, deformaintera-ções e
orien-tação das fibras por um lado e a osmolaridade do tecido por
outro lado. A resposta dual devido à uma mudança na
de-formação é compreendida como uma resposta imediata antes do fluido escoar para dentro ou para fora do tecido, seguido
de uma progressiva readaptação da quantidade de fluido no
tempo devido ao gradiente do potencial químico entre o tecido
e a solução externa.
Palavras-chave: inchamento, colágeno, osmose, Donnan,
tecido cartilaginoso.
REFERENCES
AKIZUKIS, MOWVC, MUELLERF, PITAJC, HOWELLDS
ANDMANICOURTDH. 1986. Tensile properties of
hu-man knee joint cartilage: I. Influense of ionic conditions, weight bearing, and fibrillation on the tensile modulus. JOR 4: 379–392.
GALANTAJO. 1967. Tensile properties of the human lumbar annulus fibrosus. Acta Orthop Scan Suppl 100(1): 5–91.
HOUBENGB, DROSTMR, HUYGHEJM, JANSSENJDAND HUSON A. 1997. Non-homogeneous permeability of canine annulus fibrosus. Spine 22: 7–16.
HUYGHEJMANDDROSTMR. 2004. Uniaxial tensile test-ing of canine annulus fibrosus tissue under changtest-ing salt concentrations. Biorheology 41: 255–261.
HUYGHE JM ANDJANSSEN JD. 1997. Quadriphasic me-chanics of swelling incompressible porous media. Int J Eng Sci 35: 793–802.
HUYGHEJM, HOUBENGB, DROSTMRAND VAN
DONKE-LAAR CC. 2003. An ionised/non-ionised dual porosity
model of intervertebral disc tissue: experimental quantifi-cation of parameters. Biomech Model Mechan 2: 3–19.
IATRIDIS JC, LAIBLE JP AND KRAG MH. 2003. Influ-ence of fixed charge density magnitude and distribution on the intervertebral disc: applications of a poroelastic and chemical electric (peace) model. ASME J Biomech Eng 125: 12–24.
MYERSER, LAIWMANDMOWVC. 1984. A continuum theory and an experiment for the ion-induced swelling behavior of articular cartilage. ASME J Biomech Eng 106(2): 151–158.
SCHROEDER Y, ELLIOT SJ, WILSON W, BAAIJENS FPT
ANDHUYGHEJM. 2008. Experimental and model
deter-mination of human intervertebral disc osmoviscoelasticity. J Orthoped Res 26: 1141–1146.
SCHROEDERY, WILSONW, HUYGHEJM, MAROUDASA
ANDBAAIJENSFPT. 2006. Osmoviscoelastic finite
el-ement model of the intervertebral disc. Eur Spine J 15: 361–371.
STOLTZMAANDATESHIANGA. 2000. A conwise linear elasticity model for the analysis of tension-compression non-linearly in articular cartilage. ASME J Biomech Eng 122: 576–586.
VANLOONR, HUYGHE JM, WIJLAARSMW AND
BAAI-JENS FPT. 2003. 3d fe implementation of an