Yandre Liceth Lozano Caicedo
Methodology for Analyzing Crack
Initiation in a Vessel under LBE
Environment
Master's thesis
Master in Engineering and Quality Management
Work done under supervision of
Professor Isabel da Silva Lopes
Professor Eusébio Manuel Pinto Nunes
DECLARATION Name
________________________________________________________________________ Email: _________________________ Phone number: ______________/___________ Identity Card Number: ______________________
Title of dissertation: ________________________________________________________________________ ________________________________________________________________________ Advisor(s): ________________________________________________________________________ Conclusion year ___________
Name of the Master:
________________________________________________________________________
THE COMPREHENSIVE REPRODUCTION OF THIS DISSERTATION IS AUTHORIZED ONLY FOR RESEARCH EFFECTS, THROUGH A WRITTEN STATEMENT BY THE INTERESTED PARTY THAT IT IS COMMITTED TO;
Universidade do Minho, ___/___/______ Assinatura:
i
A
BSTRACTThe Belgian Nuclear Research Centre, SCK•CEN, was founded in 1952. This gave the academic world and Belgian industry access to the worldwide development of nuclear energy. Ever since SCK•CEN has been developing a pioneering role with unique achievements and groundbreaking work. The Centre has been developing activities related to MYRRHA, a Multi-purpose Hybrid Research Reactor for High-tech Applications able to work both in subcritical (ADS) as in critical modes. This reactor can contribute in areas as health care when producing radioisotopes for nuclear medicine.
One of the main problems identified by researchers about the reactor is the crack initiation in the vessel in a Lead-bismuth Eutectic (LBE) environment, fact that in long-term affects directly the proper function of the reactor. Because of its relevance, the crack initiation needs reactor MYRRHA to be studied. Keeping that as a principal objective, this dissertation reviews the concept of cracks initiation in terms of lifecycle and analyzes the different project on the topic to classify the possible factors influencing this crack initiation.
The concept of experimental design appears as an alternative to adequately guide future studies on crack initiation and with which reliable results can be provided, in addition to it, the accelerated testing is also proposed as the technique to use for reducing the experiment development time.
An experimental design was developed and a sample size was defined, estimated through the factors selected as relevant and considering one repetition, but the possibility of increasing or reducing the number of factors besides the levels of the same is left open.
K
EYWORDSii
R
ESUMOO Centro Belga de Pesquisa Nuclear, SCK • CEN foi fundado em 1952. Isto deu ao mundo académico e industrial Belga acesso ao desenvolvimento mundial da energia nuclear. Desde então o SCK • CEN tem desempenhado um papel pioneiro com realizações únicas e trabalho innovador. O centro tem desenvolvido atividade relativamente ao MYRRHA, Reator de Pesquisa Híbrido Multiusos para Aplicações de Alta Tecnologia, capaz de trabalhar tanto em subcritico (ADS) como em modos críticos. Este reator pode contribuir em áreas como cuidados de saúde para a produção de radioisótopos.
Um dos principais problemas identificados pela investigação realizada acerca do reator é a iniciação de fissuras no ambiente LBE, facto que, a longo prazo, afeta diretamente a função adequada do reator. Por sua relevância, o reator MYRRHA precisa ser estudado. Mantendo isso como um dos principais objetivos, esta dissertação analisa o aparecimento de fissuras na cuba do reator nuclear. O conceito de projeto experimental aparece como uma alternativa para orientar adequadamente estudos futuros sobre iniciação de crack e com o qual resultados confiáveis podem ser obtidos, além disso, os testes acelerados também são propostos como a técnica a ser usada para reduzir o tempo de desenvolvimento da experiência.
Foi definido um plano experimental e proposto um tamanho de amostra que considera uma repetição de cada teste, estimado através dos fatores selecionados como relevantes, mas fica em aberto a possibilidade de aumentar ou reduzir o número de fatores além dos níveis do mesmo.
P
ALAVRAS-C
HAVE:
iii
I
NDEXAbstract ... i
Resumo ... ii
Index of Figure ... vii
Index of Tables ... viii
List of Abbreviations and Acronyms ... ix
1. Introduction ... 1 1.1 Scope ... 1 1.2 Objectives ... 2 1.3 Methodology ... 3 1.4 Dissertation structure ... 3 2. Literature review ... 5 2.1 Nuclear reactor ... 5 2.2 Coolant... 6 2.3 Fatigue ... 7 2.3.1 ε-N curve ... 8
2.3.2 Fatigue ε-N Data with different environments ... 10
2.3.3 Critical parameter that influence the fatigue life ... 11
2.3.4 Mechanism of fatigue crack initiation ... 12
2.4 Reliability ... 12
2.4.1 Reliability concept ... 13
2.4.2 Mathematical definition for reliability ... 13
2.5 Reliability test method ... 14
2.6 Accelerated life test ... 15
2.6.1 Quantitative versus Qualitative Accelerated test ... 15
2.6.2 Method of Acceleration ... 16
2.6.3 Acceleration models ... 18
2.7 Experimental design ... 18
2.7.1 Guidlines for designing experiments ... 20
iv
2.8 Accelerating testing using experimental design ... 24
2.8.1 Test planning ... 24
2.8.2 Design phase ... 24
2.9 Research’s Background ... 25
2.9.1 Environmental Effects on Fatigue Crack Initiation in Piping and Pressure Vessel Steels (O. Chopra, 2001) ... 25
3. SCK•CEN experiments in fatigue crack initiation... 27
3.1 SCK•CEN: the Belgian Nuclear Research center ... 27
3.1.1 MYRRHA ... 27
3.2 Research’s projects in SCK•CEN ... 28
3.2.1 The Fatigue Behavior of T91 and 316L Steels ... 29
3.2.2 Influence of LBE coolant on the fatigue properties of 316L steel ... 29
3.2.3 Critical analysis of the performed works ... 30
4. Statistical analysis of data from SCK•CEN ... 31
4.1 Practical experimental method of realization ... 31
4.2 Statistical data analysis for the fatigue in LBE environment at 300 and 400°C ... 32
4.2.1 Test conditions ... 32
4.2.2 Statistical analysis ... 35
4.3 Statistical data analysis for fatigue experiment under corrosion in SCK•CEN ... 37
4.3.1 Data description ... 37
4.3.2 Statistical analysis ... 39
4.4 Synthesis ... 42
5. Methodology proposal for the analysis and data collection ... 43
5.1 Recognition and statement of the problem ... 43
5.1.1 Selection of the dependent and the independent factors ... 43
5.2 Choice of factors, levels, and ranges ... 46
5.2.1 Held-constant factors ... 46
v
5.2.3 Uncontrollable factors ... 47
5.3 Experimental design (Taguchi Method) ... 48
5.4 Sample size ... 52
6. Conclusion ... 53
6.1 Discussion ... 53
Bibliography ... 55
vii
I
NDEX OFF
IGUREFigure 1: Evolution of nuclear Power ... 5
Figure 2: Stress description (Roylance, 2001). ... 8
Figure 3: Fatigue for constant strain rate (Castillo & Fernández-Canteli, 2009) ... 9
Figure 4: ε-N mean Curve (Castillo & Fernández-Canteli, 2009) ... 10
Figure 5: Parameter diagram of a Product/Process/System ... 22
Figure 6: Parts of MYRRHA ... 28
Figure 7: Testing machine by Marmy Pierre (2017) ... 31
Figure 8: Cause and effect diagram for possible influencing factors in cracking initiation .... 44
viii
I
NDEX OFT
ABLESTable 1: Reliability test (Meeker & Escobar, 1998) ... 15
Table 2: Array selector ... 23
Table 3: Chemical composition of 316L ... 32
Table 4: Data from Marmy & Gong (2015) ... 34
Table 5: Descriptive analysis ... 35
Table 6: Correlation table ... 35
Table 7: Regression model Parameters ... 37
Table 8: Chemical composition ... 37
Table 9: Data base for fatigue experiment ... 38
Table 10: Descriptive analysis ... 39
Table 11: Correlation ... 39
Table 12: Coefficients for the regression model ... 40
Table 13: Factors for the experimental design ... 48
Table 14: Interaction of the experimental design ... 50
ix
L
IST OFA
BBREVIATIONS ANDA
CRONYMSABTs Accelerated Binary Tests ABWR Advanced boiling water reactor AD Accelerator Driven
ADDTs Accelerated Destructive Degradation Tests ADS Flexible experimental accelerator Driven System AGREE Reliability of Electronic Equipment
ARMDTs Accelerated Repeated Measures Degradation Tests ASME American Society of Mechanical Engineers
AT Accelerated test BWR Boiling water reactor
CANDU Canadian Deuterium Uranium
DO Dissolved oxygen
DOE Design of Experiments DSA Dynamic strain ageing EPR European power reactor EST Environmental stress testing HALT Highly accelerated life tests LBE Lead-alloy coolants
LME Liquid metal embrittlement LMFRs Liquid metal cooled fast reactors LWR Light water reactor
PVC Polyvinyl chloride
PHWR Pressurized heavy water reactor PWR Pressurized water reactor
S Stress
SCK•CEN Belgian Nuclear Research Centre STRIFE Stress life
QualAT Qualitative accelerated tests QuanAT Quantitative accelerated tests
1
1. I
NTRODUCTION1.1 Scope
Multi-purpose hYbrid Research Reactor for High-tech Applications (MYRRHA) is the flexible experimental Accelerator Driven System (ADS) in development at Belgian Nuclear Research Centre, SCK•CEN. There are many ways to classify a reactor and one of them is through the type of coolant. For MYRRHA, Lead Bismuth Eutectic (LBE) that has been used as primary coolant in Soviet sub-marine reactors, LBE or related lead-alloy coolants could provide significant advantages in terms of safety and economy of Generation IV reactors and accelerator driven systems, thanks to high boiling temperature, chemical inertness with respect to water and potential for natural convection (Baeten, Schyns, Fernandez, De Bruyn, & Van den Eynde, 2014).
A literature review on MYRRHA with LBE environment and crack initiations, in or outside SCK•CEN, shows a huge number of papers that address this topic, through basic statistical analysis. One of the most relevant papers was developed by the Argonne National Laboratory which addresses the fatigue crack initiation in light water reactor (LWR) environment. In this article specific factors are evaluated and statistics are used to process the information. In SCK•CEN, researches have also been developed, one of them was performed by Pierre Marmy and Xing Gong(2012), that addressed the influence of LBE on the fatigue properties of 316L steel. In the case of this paper, descriptive statistic are used to analyze and process the data.
The literature about this area presents different researches that lack the use of inferential statistics (such as hypothesis tests, regression, Bayes) and of a proper sample collection planning. However, it is not possible to have credible results in a regression model if the internal validity is nonexistent in the study, which means it has unknown errors and high uncertainty. So, sample planning is required to extract more information from the data collected, and so it is possible to reduce the repetition of the same experiment. To obtain credible results that consequently could be used to analyze a population (Slack & Draugalis, 2001).
2 A proposal to increase the inter validity can be the use of experimental design with accelerate testing. Experimental design is a complete investigation tool in which combinations of the levels of factors are investigated.
On the other hand, the use of accelerated life testing reduces the test time significantly while the use of factorial design, by testing the effect of several factors simultaneously, provides the maximum possible information from a minimum number of tests.
1.2 Objectives
The objective of the dissertation is to propose a methodology as an alternative to the common techniques used for the analysis of the most important factors that influence the crack initiation under LBE environment. The specific objectives to achieve are:
Perform a theoretical review about SCK•CEN researches and the main experiments for this project.
Propose statistical analysis techniques for the data obtained in SCK•CEN.
Determine the most important factors to be analyzed for the study of the crack initiation in LBE environment.
Propose a technique that allows to plan and later to analyze experiment for the study of cracks initiation in LBE.
3
1.3 Methodology
For the proper fulfillment of the objectives the next steps were developed:
Phase 1. Literature review - In the development of a research, the literature review is important because it allows the introduction of the reader to the general concepts that are going to be used in the investigation. Additionally for this project It played an important role since it allowed to know according to other projects the most relevant factors and thus to take decisions in the future. For that reason, in this investigation the literature review was performed minutely through searching in journals, books, thesis, proceedings, technical reports and websites.
Phase 2. Review SCK•CEN researches - Data analysis and identification of statistical methodology. In this phase are evaluated some projects through statistical analysis identified the problems of using the techniques after not applying a proper sample size analysis and the Identification of the relevant factors in crack initiation. There is a huge quantity of factors that could have influence in the crack initiation, but those are not standardly clear. A statistical analysis can give the tools for reducing the number of factors in a future experiment for the crack initiation.
Phase 3. In this phase a methodology to analyze and process the data is approached. Correct technique allows to control the deficiency of statistical techniques. Therefore, a series of analysis was made to data obtained and analyzed in previous projects. And with it leave a research base that can be used as a tool in the future. Finalizing with the conclusions.
1.4 Dissertation structure
For the collection and subsequent analysis of data that allows the analysis of the number of cycles until failure occurrence, in this case crack initiation, this dissertation has 6 chapters. Chapter I presents first an introduction of the project, with a theoretical framework. After, the description of the objectives, the methodology used in this project and the dissertation structure are presented.
Chapter II addresses the nuclear environment concepts, in addition to the introduction of concept and tools such as: reliability, experimental design and accelerating testing.
4 Chapter III presents SCK•CEN which is the organization where the research was performed. Then an introduction to MYRRHA is given. And later, two projects from SCK•CEN are discussed.
Chapter IV is about statistical analysis of two databases that were previously processed in SCK•CEN.in order to see application examples in data rates to this project, make conclusions. Chapter V begins with the statement of the problem to be analyzed. Then, the independent and dependent factors are identified, as well as the levels and ranges of the factors. At least, the experimental design is approached.
5
2. L
ITERATURE REVIEWThis chapter allows to give a critical vision about the important topics for this project and the theoretical concepts about Nuclear (comprehension of Nuclear, type of reactor, fatigue) and Reliability.
2.1 Nuclear reactor
A nuclear reactor is a device, designed to produce and sustain a long term controlled fission chain reaction, made with carefully selected and strategically placed collection of various materials. The classification of reactors varies and are generally based on the following: type of fission reaction (thermal, epithermal, and fast reactors), purpose of the reactor (power reactors, research reactors, and test reactors), type of the coolant present (such as light/heavy water reactors, gas-cooled reactors, and liquid metal-cooled reactors), type of core construction (cubical, cylindrical, octagonal, and spherical reactors), and so forth. Nuclear reactors have been built for the primary purpose of electricity production, although they are used for desalination and radioisotope production (Charit & Murty, 2013).
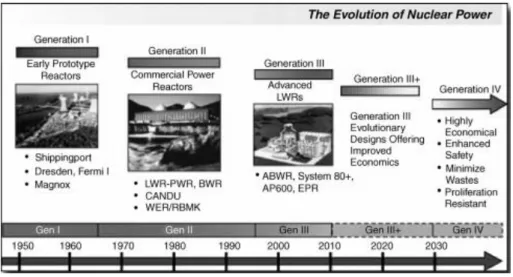
Examples of nuclear reactor are presented in Figure 1.
Figure 1: Evolution of nuclear Power
Generation-I reactors were built in the initial period of nuclear power expansion and generally had primitive design features. Most of these reactors have either been shut down or will be soon done so. Examples of such reactors are Magnox reactor (Calder Hall reactor in the United Kingdom) and first commercial power reactor at Shippingport in
6 1957 (in the state of Pennsylvania in the United States). As an example, the Magnox Reactor is a notable Generation-I gas-cooled reactor. Early breed of this reactor was used for plutonium production (for atomic weapons) as well as electricity generation.
Generation-II reactors are in most of the commercial nuclear power plants operating today. There are also the reactors employed in naval vessels (such as aircraft carriers and submarines) and many research/test reactors are of this type. The Generation-II reactors incorporated improved design and safety features and productivity over Generation-I reactors. In the Western Hemisphere, a majority of commercial nuclear power plants has Light water reactor (LWR), both pressurized water reactor (PWR) and boiling water reactor (BWR). It is important to remember that LWRs were also built as Generation-I reactors (such as Shippingport facility with 60 MWe power capacity), however most of them are no longer in operation. Another variety is the CANDU (Canadian Deuterium Uranium) reactor, which is basically a pressurized heavy water reactor (PHWR). There are a few different versions of pressurized water reactors (e.g., RBMK type) in Russia and former Soviet-bloc countries.
Generation-III and III+ Reactors are being built or will be built within a few years. These are mainly advanced LWRs. Examples include advanced boiling water reactor (ABWR) and evolutionary or European power reactor (EPR). In the same line, Generation III+ category aims to provide reactor systems that have much improved designs and safety features, and much greater capacities.
Generation-IV reactors are the futuristic reactors for which research and development efforts are currently in progress. These reactors will be more efficient, safer, longer lasting (60 years and beyond), proliferation-resistant, and economically viable compared to the present nuclear reactors (Charit & Murty, 2013).
2.2 Coolant
The choice of the coolant is one of the main technical issues concerning fast reactors design, since it determines design approach as well as technical and economic characteristics of the system. Moreover, several aspects concerning coolants are related to the reliability and safe operation of liquid metal cooled fast reactors (LMFRs). These aspects are in the field of coolant quality control, materials compatibility, thermal-hydraulics behavior in different
7 operation regimes, and innovative and robust instrumentation and measurement techniques development.
The coolant quality control is of primary importance since it has a direct impact on the structural materials compatibility performance, on the thermal-hydraulics performance of the core, the primary system and the heat exchanger and, to some extent, on maintenance and decommissioning procedures. The study of the physical and chemical properties of the liquid metal and the evaluation of contamination sources which can occur in the reactor system are essential data for the development of technologies to control the coolant quality (IAEA, n.d.).
2.3 Fatigue
Fatigue, as understood by materials technologists, is a process in which damage accumulates due to the repetitive application of loads that may be well below the yield point. The process is dangerous because a single application of the load would not produce any ill effects, and a conventional stress analysis might lead to an assumption of safety that does not exist.
In one popular view of fatigue in metals, the fatigue process is thought to begin at an internal or surface flaw where the stresses are concentrated, and consists initially of shear flow along slip planes. Over several cycles, this slip generates intrusions and extrusions that begin to resemble a crack. A true crack running inward from an intrusion region may propagate initially along one of the original slip planes, but eventually turns to propagate transversely to the principal normal stress.
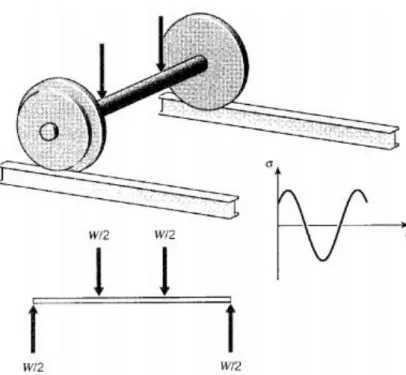
The modern study of fatigue is generally dated from the work of A. Wöhler, a technologist in the German railroad system in the mid-nineteenth century. Wohler was concerned by the failure of axles after various times in service, at loads considerably less than expected. A railcar axle is essentially a round beam in four-point bending, which produces a compressive stress along the top surface and a tensile stress along the bottom (see Figure 2). After the axle has rotated a half turn, the bottom becomes the top and vice versa, so the stress on a particular region of material at the surface varies sinusoidally from tension to compression and back again. This is now known as fully reversed fatigue loading (Roylance, 2001).
8
Figure 2: Stress description (Roylance, 2001).
2.3.1 ε-N curve
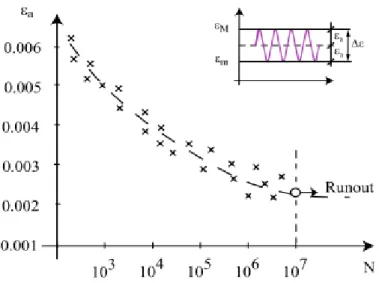
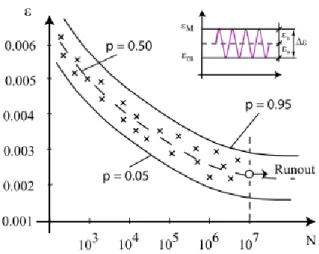
When local plastic deformations are present during the fatigue process, for example at stress raisers (edges, discontinuities, etc.) the so called strain-based must be applied as an alternative of the stress based approach because the first one does a better characterization of the fatigue, particularly in the low cycle fatigue. The strain-based approach demands more material related information, including the ε-N curves, which represent the mean lifetime as a function of the strain range for a constant stress or strain level, N represents the number of cycles (see Figure 3).
9
Figure 3: Fatigue for constant strain rate (Castillo & Fernández-Canteli, 2009)
A typical example of fatigue data for constant strain range is provided in Figure 3, and estimates of the ε-N mean and some percentile curves have been added in Figure 4. A detailed analysis of these figures shows the following facts:
1. Fatigue lifetime increases with decreasing strain range;
2. The data exhibit all over the lifetime range a positive curvature (concave from above); 3. Data also suggest that the scatter of fatigue lifetime increases with decreasing strain
range;
4. Below a certain strain range, no fatigue failure is expected;
5. The fatigue lifetime has a random character. Thus, instead of a single ε-N curve (the mean) it seems better to use a family of ε-N curves, associated with the corresponding percentiles. So, for simplicity’s sake we will refer to the associated ε-N curves (Castillo & Fernández-Canteli, 2009).
10
Figure 4: ε-N mean Curve (Castillo & Fernández-Canteli, 2009)
2.3.2 Fatigue ε-N Data with different environments
The environment, in this case the type of coolant used for the reactor, has changed over time. Air and light water are important coolants that have been studied and these studies can be a base for the study of LBE. The characteristic of the fatigue for those environments are presented below.
Air environment
A comparison between statistical models performed by the American Society of Mechanical Engineers ASME, showed that the fatigue ε-N data indicate that fatigue life of austenitic strainless steels in air is independent of temperature in the range from room temperature to 427°C. Although the effect of strain rate on fatigue life seems to be significant at temperature above 400 °C variation, in strain rate in the range of 0.4 - 0.008𝑠−1 has no effect on the fatigue lives of strainless steels at temperature up to 400 °C.
During cycling loading of the testing, austenitic strainless steels exhibit hardening during the first 50-100 cycles, the extent of hardening increases with increasing strain amplitude. A decreasing temperature and strain rate showed that for the two types of strainless steels cyclic hardening at 288°C is greater at low strain rates (Chopra & Muscara, 2002).
LWR environments
The fatigue life of austenitic strainless steels decreases in LWR environments with primarily strain rate and temperature. Dissolved oxygen (DO) content in the water and material heat treatment may also influence fatigue life.
11 2.3.3 Critical parameter that influence the fatigue life
The critical parameters that influence fatigue life and the threshold values of these parameters for environmental effects are:
Strain amplitude - a slow strain rate applied during the tensile-loading cycle is primarily responsible for environmentally assisted reduction in fatigue life.
Hold-Time Effects - Environmental effects on fatigue life occur primarily during the tensile-loading cycle and at strain levels greater that the threshold value. Consequently, loading and environmental conditions during the tensile-loading cycle, e.g., strain rate, temperature, and DO level are important for environment assisted reduction of the fatigue lives of these steels.
Strain rate - in LWR environment fatigue life decreases logarithmically with decreasing strain rate.
Dissolved Oxygen - the fatigue lives of austenitic strainless steels decrease significantly in low-DO water; the effect is greater at low strain and high temperature, on the other hand, high water environmental effects on the fatigue lives are not well known.
Temperature - the change in fatigue lives of austenitic strainless steels suggest a threshold temperature of 150°C, above which the environment decreases fatigue life in low-DO water if the strain rates is below the threshold of 0.4%/s. In the range of 150-325°C, the logarithm of fatigue life decreases linearly with temperature. Only moderate decrease in life is observed in water at temperature below the threshold value of 150°C.
Flow rate, it is generally recognized that flow rate most likely has a significant effect on the fatigue life of materials because it causes differences in local environmental conditions, however the effect of flow rate on the fatigue life of austenitic strainless steels has not been evaluated. Cast Stainless Steels indicates that in air, the fatigue lives of cast CF-8 and CF8M stainless steels are like that of wrought austenitic stainless steels (Chopra & Muscara, 2002).
12 2.3.4 Mechanism of fatigue crack initiation
The fatigue life of a material is defined as the number of cycles necessary to form an engineering crack. Fatigue crack has been divided into two stages:
An initiation stage that involves the growth of microstructurally small cracks. Propagation stage that involves the growth of mechanically small cracks.
Researches indicated that decreased in the fatigue life of 316L steels are caused primarily by the effects of environment on the growth of microstructurally small cracks and, to a less extent on enhanced growth rates of mechanically small cracks. In low-DO water, fatigue cracks are always straight and normal to the stress axis, whereas in airs or high-DO water they follow certain crystallographic features. However, the morphology of crack growth into the material is similar in both air and water (Chopra & Muscara, 2002).
2.4 Reliability
Reliability, as a human attribute, has been praised for a very long time. For technical systems, however, the reliability concept has not been applied for more than some 60 years. It emerged with a technological meaning just after World War I and was then used in connection with comparing operational safety of one-, two-, and four-engine airplanes. Reliability was measured as the number of accidents per hour of flight time. At the beginning of the 1930s, Walter Shewhart, Harold F. Dodge, and Harry G. Romig laid down the theoretical basis for utilizing statistical methods in quality control of industrial products. Such methods were, however, not brought into use to any great extent until the beginning of World War II. Products that were composed of many parts often did not function, even though they were made up of individual high-quality components.
During World War II a group in Germany was working under Wernher von Braun developing the V- 1 missile. After the war, it was reported that the first 10 V- 1 missiles were all fiascos. Despite attempts to provide high-quality parts and careful attention to details, all the first missiles either exploded on the launching pad or landed “too soon”. Robert Lusser, a mathematician, was called in as a consultant. His task was to analyze the missile system, and he quickly derived the product probability law of series components. This theorem concerns systems functioning only if all the components are functioning and is valid under special assumptions. It says that the reliability of such a system is equal to the product of the
13 reliabilities of the individual components which make up the system (Høyland & Rausand, 1994).
2.4.1 Reliability concept
The reliability was defined until the 1960s as “the probability that an item will perform a required function under stated conditions for a stated period. Some authors still prefer this definition, for example, Smith (1997) and Lakner and Anderson (1985). But, there is a general definition of reliability given in standards like IS0 8402 and British Standard BS 4778: Reliability is the ability of an item to perform a required function, under given environmental and operational conditions and for a stated period (ISO 8402).
The term “item” is used here to denote any component, subsystem, or system that can be considered as an entity. A required function may be a single function or a combination of functions that is necessary to provide a specified service;
All technical items (components, subsystems, systems) are designed to perform one or more (required) functions. Some of these functions are active and some functions are passive. Containment of fluid in a pipeline is an example of a passive function. Complex systems (e.g., an automobile) usually have a wide range of required functions. To assess the reliability (e.g., of an automobile), we must first specify the required function(s) we are considering.
For a hardware item to be reliable, it must do more than meet an initial factory performance or quality specification, it must operate satisfactorily for a specified period of time in the actual application for which it is intended (Høyland & Rausand, 1994).
2.4.2 Mathematical definition for reliability
The state of an item at time may be described by the state variable. 𝑥(𝑡) = {1 𝑖𝑓 𝑡ℎ𝑒 𝑖𝑡𝑒𝑚 𝑖𝑠 𝑓𝑢𝑛𝑐𝑡𝑖𝑜𝑛𝑖𝑛𝑔 𝑎𝑡 𝑡𝑖𝑚𝑒 𝑡
0 𝑖𝑓 𝑡ℎ𝑒 𝑖𝑡𝑒𝑚 𝑖𝑠 𝑖𝑛 𝑎 𝑓𝑎𝑖𝑙𝑒𝑑 𝑠𝑡𝑎𝑡𝑒 𝑎𝑡 𝑡𝑖𝑚𝑒 𝑡
(2.1)
By the time to failure of an item mean the time elapsing from when the item is put into operation until it fails for the first time. It is therefore natural to interpret the time to failure as a random variable. If the time to failure is continuously distributed with probability density function 𝑓(𝑡) and distribution function 𝐹(𝑡), the eq. (2.2) denotes the probability that the item fails within the time interval.
14 𝐹(𝑡) = 𝑃𝑟(𝑇 ≤ 𝑡) = ∫ 𝑓(𝑢)𝑑𝑢 𝑓𝑜𝑟 𝑡 > 0
𝑡 0
(2.2)
The probability density function 𝑓(𝑡) is defined as: 𝑓(𝑡) = 𝑑
𝑑𝑡𝐹(𝑡) = lim∆𝑡→∞
𝐹(𝑡+∆𝑡)−𝐹(𝑡)
∆𝑡 (2.3)
Reliability function
The reliability function of an item is defined by:
𝑅(𝑡) = 1 − 𝐹(𝑡) = 𝑃𝑟(𝑇 > 𝑡) 𝑓𝑜𝑟 𝑡 > 0 (2.4) Failure rate function
The probability that an item will fail in the time interval when we know that the item is functioning at time is:
𝑃𝑟(𝑡 < 𝑇 ≤ 𝑡 + ∆𝑡| 𝑇 > 𝑡) = Pr (𝑡 < 𝑇 ≤ 𝑡 + ∆𝑡) 𝑃𝑟(𝑇 > 𝑡) =
𝐹(𝑡 + ∆𝑡) − 𝐹(𝑡) 𝑅(𝑡)
(2.5)
2.5 Reliability test method
Reliability testing has become a useful way to meet and exceed customer demand for high quality and reliable products. It usually involves simulation of conditions under which the item will be used during its lifespan. Reliability does not compare the product to some predefined specifications, such as the case with quality assurance, but rather investigates the performance over a predefined period of time (Antonitsin, 2009).
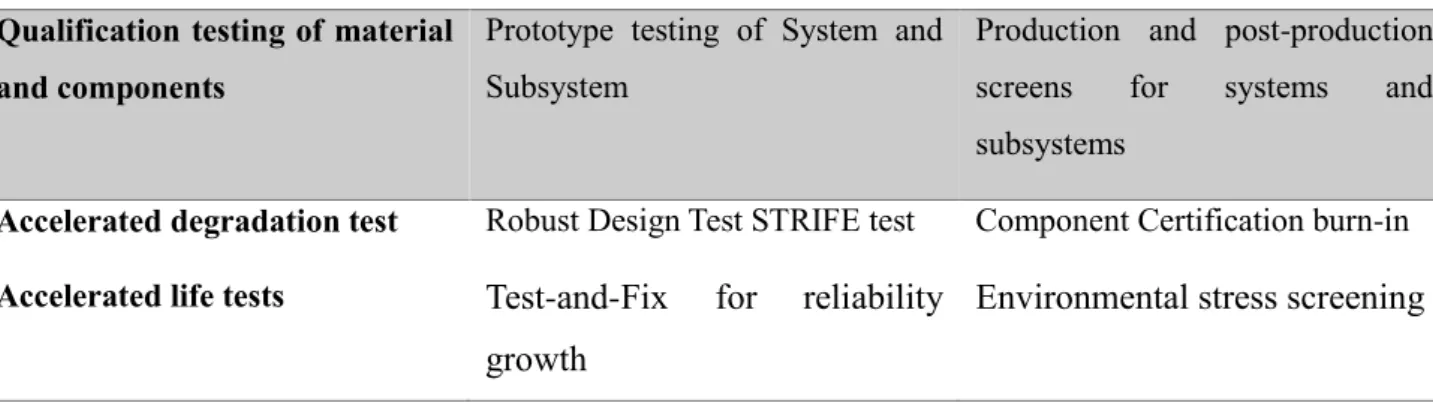
Different types of reliability test and screens are used in different phases of the product development/production processes. Table 1 outlines the kinds of reliability test done at different stage of product design and production.
15
Table 1: Reliability test (Meeker & Escobar, 1998)
Product Design Product production
Qualification testing of material and components
Prototype testing of System and Subsystem
Production and post-production screens for systems and subsystems
Accelerated degradation test Accelerated life tests
Robust Design Test STRIFE test Test-and-Fix for reliability growth
Component Certification burn-in Environmental stress screening
Generally, there is a need to do these tests as quickly as possible, and methods have been developed to accelerate all of these different types of tests and scream. The focus in this dissertation is the accelerated life tests that are done during product design to assist reliability and quantify the use of proposed materials and components (Meeker & Escobar, 1998).
2.6 Accelerated life test
The term “acceleration” has many different in reliability, but it generally implies making “time” (on whatever scale is used to measure device or component life) go more rapidly, so that reliability information can be obtained more quickly. The Accelerated testing (AT) is a way to predict the life at use conditions. For the test it is necessary the extrapolation of the time and the accelerating and it needs to be justified on the basis of physically motivated models, for it the statistic have developed important contributions with stochastic models for AT data.
2.6.1 Quantitative versus Qualitative Accelerated test
Within the reliability discipline, the term “accelerated test” is used to describe two different kinds of useful tests that have different purposes. To distinguish between these, the terms “quantitative accelerated tests” (QuanAT) and “qualitative accelerated tests” (QualAT) are sometimes used. A QualAT has purpose to identify product weaknesses caused by flaws in the product’s design or manufacturing process. The QuanAT tests units at combinations of higher than-usual levels of certain accelerating factors. The purpose of a QuanAT is to obtain information about the failure-time distribution or degradation distribution at specified “use” levels of these factors. Generally, failure modes of interest are known ahead of time, and there
16 is some knowledge available that describes the relationship between the failure mechanism and the accelerating factors (either based on physical/chemical theory or large amounts of previous experience with similar tests) that can be used to identify a model that can be used to justify the extrapolation (Escobar & Meeker, 2007).
2.6.2 Method of Acceleration
There are different methods of accelerating a reliability test (Escobar & Meeker, 2007):
Increase the use rate of the product - This method is appropriate for products that are ordinarily not in continuous use. For example, the median life of a bearing for a certain washing machine agitator is 12 years, based on an assumed use rate of 8 loads per week. If the machine is tested at 112 loads per week (16 per day), the median life is reduced to roughly 10 months, under the assumption that the increased use rate does not change the cycles to failure distribution. Also, because it is not necessary to have all units fail in a life test, useful reliability information could be obtained in a matter of weeks instead of months.
Increase the intensity of the exposure to radiation - Various types of radiation can lead to material degradation and product failure. For example, organic materials (ranging from human skin to materials like epoxies and polyvinyl chloride or PVC) will degrade when exposed to ultraviolet (UV) radiation. Electrical insulation exposed to gamma rays in nuclear power plants will degrade more rapidly than similar insulation in similar environments without the radiation. Modeling and acceleration of degradation processes by increasing radiation intensity is commonly done in a manner that is similar to acceleration by increasing use rate.
Increase the aging rate of the product - Increasing the level of experimental factors like temperature or humidity can accelerate the chemical processes of certain failure mechanisms such as chemical degradation (resulting in eventual weakening and failure) of an adhesive mechanical bond or the growth of a conducting filament across an insulator (eventually causing a short circuit).
Increase the level of stress (e.g., amplitude in temperature cycling, voltage, or pressure) under which test units operate - A unit will fail when its strength drops below applied stress. Thus, a unit at a high stress will generally fail more rapidly than it would have failed at low stress.
17 Combinations of these methods of acceleration are also employed - Factors like voltage and temperature cycling can both increase the rate of an electrochemical reaction (thus accelerating the aging rate) and increase stress relative to strength. In such situations, when the effect of an accelerating variable is complicated, there may not be enough physical knowledge to provide an adequate physical model for acceleration (and extrapolation). Empirical models may or may not be useful for extrapolation to use conditions (Escobar & Meeker, 2007).
It is useful to distinguish among ATs on the basis of the nature of the response.
Accelerated Binary Tests (ABTs). The response in an ABT is binary. That is, whether the product has failed or not, is the only reliability information obtained from each unit.
Accelerated Life Tests (ALTs). The response in an ALT is directly related to the lifetime of the product. Typically, ALT data are right-censored because the test is stopped before all units fail. In other cases, the ALT response is interval-censored because failures are discovered at particular inspection times.
Accelerated Repeated Measures Degradation Tests (ARMDTs). In an ARMDT, one measures degradation on a sample of units at different points in time. In general, each unit provides several degradation measurements. The degradation response could be actual chemical or physical degradation or performance degradation (e.g., drop in power output).
Accelerated Destructive Degradation Tests (ADDTs). An ADDT is similar to an ARMDT, except that the measurements are destructive, so one can obtain only one observation per test unit.
These different kinds of ATs can be closely related because they can involve the same underlying physical/chemical mechanisms for failure and models for acceleration. They are different, however, in that different kinds of statistical models and analyses are performed because of the differences in the kind of response that can be observed. Many of the underlying physical model assumptions, concepts and practices are the same for ABTs, ALTs, ARMDTs and ADDTs. There are close relationships among models for ABT, ALT, ARMD and ADD data. Because of the different types of responses, however, the actual models fitted to the data and methods of analysis differ. In some cases, analysts use degradation-level data
18 to define failure times. For example, turning ARMDT data into ALT data generally simplifies analysis but may sacrifice useful information. An important characteristic of all ATs is the need to extrapolate outside the range of available data: tests are done at accelerated conditions, but estimates are needed at use conditions. Such extrapolation requires strong model assumptions (Escobar & Meeker, 2006).
2.6.3 Acceleration models
Interpretation of accelerated test data requires models that relate accelerating with factors like, temperature, voltage, pressure, and size to time acceleration. For testing over some range of accelerating factors, one can fit model to the data to describe the effect that the factors have on the failure causing processes. The general idea is at high levels of the accelerating variable(s) to speed up failure processes and then to extrapolate to lower levels of the accelerating factors(s). For some situation, a physically reasonable statistical model may allow such extrapolation.
Physical acceleration models
For well-understood failure mechanisms, one may have a model based on physical/chemical theory that describes the failure-causing process over the range of the data and provides extrapolation to use conditions. The relationship between accelerating factors and the actual failure mechanism is usually extremely complicated. Often, however, one has a simple model that adequately describes the process.
Empirical acceleration models
When there is little understanding of the chemical of physical processes leading to failure, it may be impossible to develop a model based on physical/chemical theory. An empirical model may be the only alternative. An empirical model may provide an excellent fit to the available data but may provide nonsense extrapolations. In some situations, there may be extensive empirical experience with particular combinations of factors and failure mechanisms and this experience may provide the needed justification for extrapolation to use conditions (Meeker & Escobar, 2006).
2.7 Experimental design
Ronald A. Fisher invented the experiments design in the 1920s and 1930s at Rothamsted Experimental Station, agricultural research station 25 miles north of London. Fisher proposed
19 the Design of Experiments (DOE) based on experiments with natural fluctuations such as soil conditions, temperature, and rainfall. Statistical design of experiments refers to the process of planning the experiment so that appropriate data will be collected and analyzed by statistical methods, resulting in valid and objective conclusions. The statistical approach to experimental design is necessary if we wish to draw meaningful conclusions from the data. When the problem involves data that are subject to experimental errors, statistical methods are the only objective approach to analysis.
The three basic principles of experimental design are randomization, replication, and blocking.
Randomization is the cornerstone underlying the use of statistical methods in experimental design, in an experimental design, it means that both the allocation of the experimental material and the order in which the individual runs of the experiment are to be performed are randomly determined. Statistical methods require that the observations (or errors) be independently distributed random factors. Randomization usually makes this assumption valid. By properly randomizing the experiment, we also assist in “averaging out” the effects of extraneous factors that may be present.
Replication is an independent repeat run of each factor combination. Replication has two important properties. First, it allows the experimenter to obtain an estimate of the experimental error. This estimate of error becomes a basic unit of measurement for determining whether observed differences in the data are statistically different. Second, if the sample mean is used to estimate the true mean response for one of the factor levels in the experiment, replication permits the experimenter to obtain a more precise estimate of this parameter.
Blocking is a design technique used to improve the precision with which comparisons among the factors of interest are made. Often blocking is used to reduce or eliminate the variability transmitted from nuisance factors that is, factors that may influence the experimental response but in which we are not directly interested (Montgomery, 2012).
20 2.7.1 Guidlines for designing experiments
To use the statistical approach in designing and analyzing experiments, it is necessary for the experiment to have a clear idea in advance of what is to be studied, how the data are to be collected, and at least a quantitative understanding of how these data are to be analyzed, the guidelines are: Recognition of a statement of the problem, Choice of factors, levels and ranges, Selection of the response variable, Choice of an experimental design, Performing the experiment, Statistical analysis and Conclusion.
1. Recognition of a statement of the problem - It is necessary to develop all ideas about the objectives of the experiment. Usually it is important to solicit input from all concerned parties: engineering, quality assurance, manufacturing, marketing, management, the costumer, and operating personal. For that reason, a team approached to designing an experiment is recommended.
It is usually helpful to prepare a list of specific problems that are to be addressed by the experiment. A clear statement of the problem often contributes substantially to better understanding of the phenomenon being studied and the final solution of the problem.
2. Choice of factors, levels and ranges - When considering the factors that may influence the performance of a process or system, the experimenter usually discovers that these factors can be classified as either potential design factors or noise factors. The potential design factors are those factors that the experiment may wish to vary in the experiment. Often, we find that there are a lot potential design factors and often some classification of them is helpful. Some helpful classification is, design factors, held constant factors, and allowed to vary factors. The design factors are the factors actually for experiment. Held constant factors are factors that may exert some effects on the response, but for the purpose of the present experiment are not of interest, so they will be held at a specific level. Nuisance factor are the factors that could be influencing the variable answer but not necessary taking into account.
3. Selection of the response variable - In selecting the response variable, the experimenter should be certain that this variable really provides useful information about the process under study. Most often, the average or standard deviation (or both) of the measured characteristic will be the response variable. Multiple responses are not unusual. Gauge capability is also an important factor because if it is inadequate only
21 relatively large factors effect will be detected by the experiment or perhaps additional replication will be required.
4. Choice of an experimental design. If the pre-experimental planning activities above are done correctly, this step is relatively easy. The choice of the experimental design involves the consideration of sample size (number of replicates), the selection of the suitable run order for the experimental trials, and the determination of whether or not blocking or another randomization restriction are involved.
5. Performing the experiment - When running the experiment, it is vital to monitor the process carefully to ensure that everything is being done according to the plane. Errors in the experimental procedure at this stage will usually destroy experimental validity. It is easy to underestimate the logistical and planning aspect of running a designed experiment in a complex manufacturing or research and development environment. 6. Statistical analysis of the data - Statistical methods should be used to analyze the data
so that results and conclusion are objective rather than judgmental in nature. If the experiment has been designed correctly and if it has been performed according to the design, the statistical methods required are not elaborate.
7. Conclusion and recommendations - Once the data have been analyzed, the experimenter must draw practical conclusions about the results and recommend a course of action. Graphical methods are often useful in this age particularly in presenting the results to others (Montgomery, 2012).
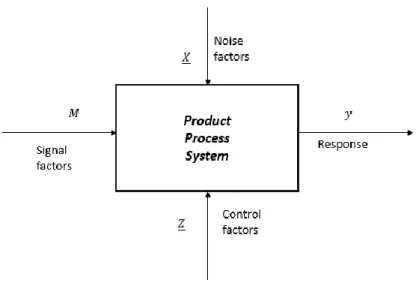
2.7.2 Taguchi method
Ealey Lance (1994) says that the main trust of Taguchi's techniques is the use of parameter design, which is an engineering method for product or process design that focuses on determining the parameter (factor) settings producing the best levels of a quality characteristic (performance measure) with minimum variation. Taguchi designs provide a powerful and efficient method for designing processes that operate consistently and optimally over a variety of conditions. To determine the best design, it requires the use of a strategically designed experiment, which exposes the process to various levels of design parameters.
22 Experimental design methods were developed in the early years of 20th century and have been extensively studied by statisticians since then, but they were not easy to use by practitioners. Taguchi's approach to design of experiments is easy to be adopted and applied for users with limited knowledge of statistics; hence it has gained a wide popularity in the engineering and scientific community. Taguchi specified three situations: Larger the better (for example, agricultural yield); Smaller the better (for example, carbon dioxide emissions); and On-target, minimum-variation (for example, a mating part in an assembly). See Figure 5, that represent how the product, process, and systems are directly influenced by the control, noise and signal samples and those implicates later a response variable.
Figure 5: Parameter diagram of a Product/Process/System
Taguchi realized that the best opportunity to eliminate variation is during the design of a product and its manufacturing process. Consequently, he developed a strategy for quality engineering that can be used in both contexts. The process or product has three stages of development: System design, Parameter design, and tolerance design The first one involve creativity and innovation, the second refers to robustification and third the reduction and control of variation in the critical dimension (Karna & Sahai, 2012).
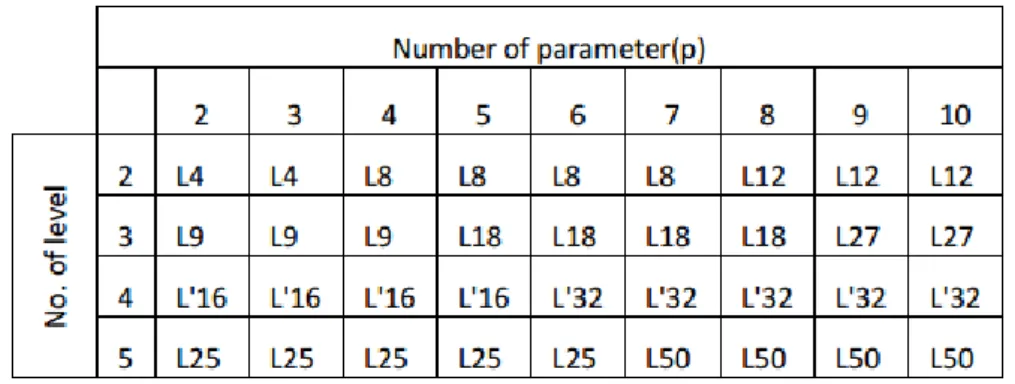
The effect of many different parameters on the performance characteristic in a process can be examined by using orthogonal arrays of experimental design proposed by Taguchi (see Table 2) the possible dimension of the samples according with the levels and the numbers of factors. Once the parameters affecting a process that can be controlled have been identified, the levels at which these parameters should vary must be determined. Determining what levels of a variable to test requires an in-depth understanding of the process, including the minimum,
23 maximum, and current value of the parameter. If the difference between the minimum and maximum value of a parameter is large, the values being tested can be further apart or more values can be tested. If the range of a parameter is small, then less value can be tested or the values tested can be closer together.
Table 2: Array selector
The Taguchi method is a powerful tool for designing high quality systems. To increase the experimental efficiency, the L18 mixed orthogonal table in the Taguchi quality design has been used to determine the significant factors. In experiments, influential machining parameters are selected, such as cutting tools of different materials, depth of cut, cutting speed, feed rate, working temperature and ultrasonic power.
In the parameter design stage Taguchi makes use of experiment design, using the orthogonal arrays, and signal to noise ratios to determine the optimal parameter settings. The Signal-to-Noise ratios (S/N) (see Eq. 2.6), which are log functions are based on “Orthogonal array”. The use of experiment design and signal /noise ratios is to determine the optimal parameter which gives reduced “variance “for the experiment, defining the “optimum settings “of control parameters. Equation 2.6 is used when the characteristics of the response variable is of the type large the better. There are other equations for response variable of the type the smaller the better or nominal is better (Karna & Sahai, 2012).
(𝑆 𝑁⁄ )𝑖 = −10𝑙𝑜𝑔 [ 1 𝑛∑ 1 𝑌𝑖𝑗2 𝑛 𝑗=1 ]
i is the number of a trial;
Y is the measured value of quality characteristic for the ith trial
jth is the number of experiment;
24
n is the number of repetition for the experimental combination
2.8 Accelerating testing using experimental design
This section explores experimental design concept, including concepts such as planning and design, but directly focused on the application of accelerate tests.
2.8.1 Test planning
The test planning plays a relevant role for an experiment, a relevant step in the proper development of it is the determination of the noise (see item 2.6). The stress stress is the means of acceleration for the material in order to have faster results, thus the following must be identified:
The stresses the unit are exposed to, under use conditions;
Which of those stresses most probably degrade the unit's performance;
Which of the identified stresses can be effectively controlled under a test environment to be measured.
This is important because failures can be propagated to very high levels of stress but also in very low levels of stress (MoKinney, 1993).
There are three important aspects to the combined test and the stress levels: The overall range of the test stresses and the number of test levels; The consideration of the eventual customer;
The process being formulated as a traditional designed experiment. 2.8.2 Design phase
The design phase of accelerated testing needs to remains free of typical accelerated testing shortcomings, such as assuming a specific time-to-failure distribution, assuming a stress/performance relationship function (e.g., the Arrhenius relationship), and utilizing lengthy extrapolations. A Design of Experiments approach, using a combined stress environment will avoid these pitfalls (Mashhadi, 1992).
25 The use of accelerated life testing reduces the test time significantly while the use of factorial design, by testing the effect of several factors simultaneously, provides the maximum possible information from a minimum number of tests. Combining these two methods is to benefit from the advantages of both methods;
The combination between these two methods increase the efficiency in an exploratory improvement investigation, when the factorial design is the main intention and the other is for verification of reliability, when accelerated testing is called for.
When verification via accelerated testing is the main purpose, a combination with factorial design serves to study the effect of disturbing factors and other interesting factors. Information can be obtained concerning the effect of these factors, interactions between them, and the interaction between each factor and the stress factor (Mashhadi, 1992).
Disadvantage
In some cases, the failure mechanism under study changes as the stress is increased. This is one of the main reasons for some people to question the use of accelerated life testing. However, application of factorial designs at increased stress levels can be used to identify such a change (Mashhadi, 1992).
2.9 Research’s Background
2.9.1 Environmental Effects on Fatigue Crack Initiation in Piping and Pressure Vessel Steels (O. Chopra, 2001)
The Argonne National Laboratory performed a study on fatigue of carbon and low-alloy steel and austenitic SSs in LWR environment. The objective was to evaluate the effects of the fatigue S-N life in the factors: steel type, strain range, strain rate, temperature, content in carbon and low–alloy steels orientation, and DO (Dissolved Oxygen) level in water . The time was measured in the number of cycles (N) to failure and S (Stress). In order to calculate the fatigue, statistical model is used in function of the type of Material, Loading and environment. This research also presented differenced investigations in the nuclear fatigue failures and later on discusses about the effect in crack initiation.
26 For the American Society of Mechanical Engineers (ASME), two methods are used based on statistical models: the design fatigue method and the fatigue life correlation factor methods. Even being different between each other, both methods are conclusive and can be used to environmental effects analyses.
The results for the ASME Code suggest that fatigue life is associated with the factor material and loading conditions are reasonable.
27
3. SCK•CEN
EXPERIMENTS IN FATIGUE CRACK INITIATIONThis chapter presents a description of SCK•CEN and an overview of MYRRHA reactor and some research results developed inside the company.
3.1 SCK•CEN: the Belgian Nuclear Research center
The Belgian Nuclear Research Centre was founded in 1952. This gave the Belgian academic and industrial world access to the worldwide development of nuclear energy. Ever since SCK•CEN has been playing a pioneering role with unique achievements and groundbreaking work in nuclear science and technology. Today SCK•CEN, with laboratories in Mol, Belgium and a registered office in Brussels, is one of the largest research centers in Belgium.
SCK•CEN conducts fundamental and applied research at an advanced scientific level and in an international context. The objective is to work on issues that are important to society today and tomorrow (Bausart et al., 2011).
SCK•CEN has three scientific institutes:
The Institute for Nuclear Materials Science, carries out research on materials and fuels used in present and future nuclear installations;
The Institute for Advanced Nuclear Systems, It supports the nuclear industry and authorities on a national and international level;
The Institute for Environment, Health and Safety studies the behavior of radioactive substances in the biosphere (air, water, soil, plants, etc.) and geosphere (subterranean clay layers, groundwater, etc.) and evaluates the impact of radiation on mankind and the environment (Bausart et al., 2011).
3.1.1 MYRRHA
MYRRHA is an Accelerator Driven System (ADS) for transmuting long-lived radioactive waste, which will contribute to addressing key issues for our future world. In a rapid growing world, the needs increase in a huge speed, in consequence it is necessary to provide advanced technology, and MYRRHA is designed with the objective to answer the technology demand through its flexible fast spectrum research reactor. This reactor has multiple applications of which the following stand out: Sustainable energy, Enabling technologies for renewable energies, Health care, Science.
28 An AD (Accelerator Driven) - sometimes also called an energy amplifier or hybrid system - is an alternative concept to the critical nuclear reactor. The idea was first proposed by Nobel Prize laureate E.O. Lawrence in the 1950's and revived by another Nobel Prize laureate C. Rubbia in 1993 after recent major advances in accelerator technology. The main advantage of ADS (Accelerator Driven System) is its non-critical fission core, i.e. a core that cannot on its own sustain the fission chain reaction (Van Tichelen et al., n.d.).
The design of the reactor MYRRHA ADS currently performing is based on a pool type configuration with a Standing Vessel (Figure 6). It allows also having an internal interim storage easing the fuel handling (Abderrahim & Malambu, 2005).
Figure 6: Parts of MYRRHA
The natural circulation for the residual heat removal in case of loss of flow (LOF) and loss-of-heat-sink (LOHS) is demonstrated to be feasible, particularly with the large thermal inertia that is also an argument in favor of this design. With an emergency cooling system based on natural circulation both on primary and secondary sides, a long-term core cool ability can be ensured even in situation of complete power loss. The core pool contains a fast-spectrum sub-critical core loaded with typical fast reactor hexagonal assemblies cooled by LBE. The three central hexagons are left free for housing the spallation module. The spallation target circuit is fully immersed in the reactor pool and thermally interlinked with the core, but its liquid metal is physically separated from the core coolant (Abderrahim, Sobolev, & Malambu, 2005).
3.2 Research’s projects in SCK•CEN
In order to be up with the development SCK•CEN is always working in new research, this section has two projects related with the topic in this dissertation made by SCK•CEN group and finally is performed a critical analysis of those researchers.
29 3.2.1 The Fatigue Behavior of T91 and 316L Steels
In October 2012, Pierre Marmy and Xing Gong wrote a paper “The Fatigue Behavior of T91
and 316L Steels”, to describe the fatigue on the steels T91 and 316L two of the commons
materials used in SCK•CEN to study LBE coolant (Marmy & Gong, 2012).
For the fulfillment of the objectives a strategic data collection was made and clearly explained. To select the factors, next conditions were considered: specimen, geometry and test machine, the test conditions (environment, mechanical conditions), and the material state (chemical analysis, heat treatments). The factors on study were: temperature, strain rate, hold times, chemical analysis, environmental medium.
In the paper conclusions, it is possible to see that, crack initiation of T91 and 316L steels occurs at the surface, at persistent slip band (PSB), and in rare case crack initiates at inclusion and grain boundary. About the parameters, the conclusion was that:
Temperature. The fatigue endurance for both steels, decreases with the increase of the temperature.
Hold times. At elevate temperature, hold time has a detrimental effect on the fatigue, on the other hand 316L is more susceptible to tension hold.
Strain rate. It has a weak effect on fatigue endurance for T91 steel for all levels of the temperature, in case of 316L the occurrences of DSA (Dynamic strain ageing ) became sensitive to strain rate strong when the temperature is between 400-600ºC.
Environment. LBE reduces the continuous fatigue life in T91 steel. For 316L steel, it affects negatively the fatigue endurance at 260ºC.
3.2.2 Influence of LBE coolant on the fatigue properties of 316L steel
A study was performed in 2015 by Pierre Marmy and Xing Gong, that addressed the “Influence of LBE on the fatigue properties of 316L steel”, which analyzed the LBE coolant and the characteristics of 316L that have been found to have great compatibility in that environment.
(Marmy & Gong, 2015) used a machine to perform the tests at SCK•CEN capable to produce fatigue results in steels, in the whole operating parameter range of the MYRRHA reactor. This novel fatigue test system, called LIMETS 3 has been described and validated. A innovation of
30 this facility is an original mechanical extensometer that is capable of directly measuring the strain at the gauge length of specimens submersed in LBE at temperatures up to 500°C.
The conclusion obtained with the analysis shows that the LBE pre-exposure time has no clear effect on fatigue life, and that compared to vacuum, a reduction of the fatigue life in LBE at 300°C was observed. However, the fatigue life in LBE is comparable with that in air.
3.2.3 Critical analysis of the performed works
The works performed by Pierre Marmy and Xing Gong described use similar methodologies for the realization and analysis of projects to study LBE in SCK•CEN. The conclusions in the articles are important and show results that can be used for decisions in the future. The authors describe clearly the data collection related with the step taken before and during the procedure, and present specific graphic for later describing the information collected.
However, the papers do not show relevant procedure, statistically in terms of design and planning regarding samples sizes and repetitions. Everything that deals with the collection, processing, interpretation and presentation of data belongs to the domain of statistics, and so does the detailed planning of that precedes. To develop a good investigation through statistic it is necessary to find answers to the following questions (Isotalo, 2001): What kind and how much data need to be collected? How should we organize and summarize the data? How can we analyze the data and draw conclusions from it? How can we assess the strength of the conclusions and evaluate their uncertainty.
To answer the questions, statistic as a methodology for interpreting and drawing conclusions from collected data provides different techniques as experimental design (simple experiments, by blocks, factorial, among others) (see section 2.6).
Statistic allows the use of different techniques in order to infer about the population on study, the two-researches reviewed, show the use of graphics to do a visualization of the data behavior. However, more methodologies can be used according to statistic, as for example: calculation of indicators and the use of the inferential statistic use of models that can bring more information about the sample and if it allows, subsequently, on the study population.
31
4. S
TATISTICAL ANALYSIS OF DATA FROMSCK•CEN
This chapter presents the statistical analysis for two set of data in which deceptive and inferential statistic are used as an alternative to the methodologies used previously in SCK•CEN.
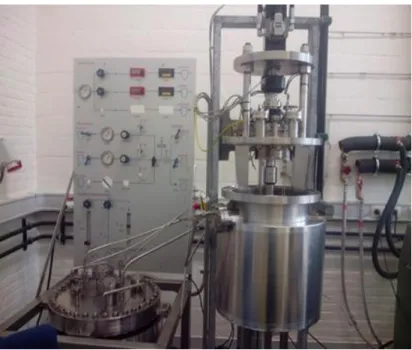
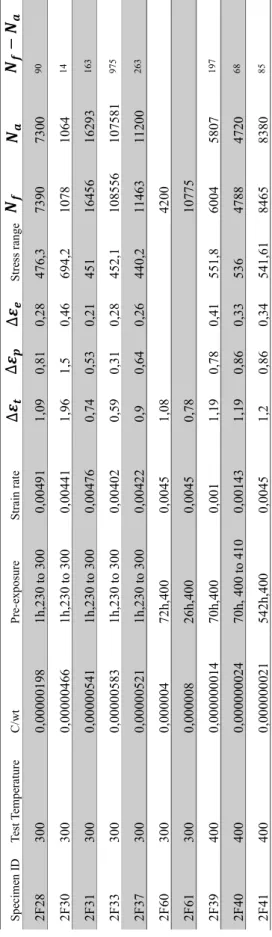
4.1 Practical experimental method of realization
According with Marmy Pierre (2017), the machine used for the study in SCK•CEN (See Figure 7) is a home developed system based on a MTS hydraulic cylinder with adequate software which can apply the force to the specimen. The test is strain controlled, through a strainmeter placed on the gauge length of the specimen, which evaluates the required strain applied by the movement of the cylinder. The command signal is a triangle and, its amplitude and frequency can be controlled. The test is finished when the force signal decreases more than a pre-set level.
The test is run into a vessel filled with the LBE, which is purified by a gas flow of Ar - 5% H2 mixture. This way, the O (Oxygen) is consumed by the hydrogen and exit the metal into the gas plenum. This process is very slow and requires 1 or 2 days. Currently, it can be chosen between oxygen saturated (the cleaning of is turned) or oxygen free where the liquid metal becomes corrosive (no oxide layers can be formed on the specimen surface).