Assessing the effect of weather on human
outdoor perception using Twitter
Laura Giuffrida
Thesis supervised by
Professor Otto Klemm
Professor Edzer Pebesma
Professor Joaquin Torres-Sospedra
Assessing the effect of weather on
human outdoor perception using Twitter
Laura Giuffrida
Thesis supervised by
Professor Otto Klemm
Professor Edzer Pebesma
Professor Joaquin Torres-Sospedra
Contents
Abstract Figures ... 7 Tables ... 9 1. Introduction ... 1 2. Human comfort ... 32.1 Further factors to HCOS... 7
2.2 Applications of the HCOS assessment ... 9
3. Twitter as a data source to understand and predict real-world phenomena ... 11
4. Concept and Methods ... 14
4.1 Aim and objectives ... 14
4.2 Study area ... 15 4.3 Data ... 19 4.3.1 Data sources ... 19 4.3.2 Data collection ... 20 4.3.3 Further Filtering ... 22 4.4 Perception extraction ... 23
4.4.1 Training a weather-specific classifier ... 25
4.5 Analysis ... 28
5. Results and Discussion ... 31
5.1 Indices ... 31
5.2 Weather parameters ... 34
5.3 Surveys vs. tweets ... 39
6. Conclusion and future work ... 43
7. Acknowledgments ... 45
Figures
Figure 1. Top 15 most popular social networks worldwide by May 2016. Source: www.dreamgrow.com ... 11
Figure 2. Concept and methods scheme ... 14
Figure 3. Number of active Twitter users in millions by May 2016. Source: Worldwide Statista market analytics (Greenwood et al., 2016)... 15
Figure 4. Number of collected tweets by state. August 2016. Source. Twitter. ... 15
Figure 5. Climatic regions in USA. Source: www.ncdc.noaa.gov ... 16
Figure 6. Wind speed during October and November 1971 -2000. Source: www.nrcc.cornell.edu ... 16
Figure 7. Average temperature departure. Autumn 2012, 2013, 2014, 2015, 2016. Source: www.nrcc.cornell.edu ... 17
Figure 8. Tweet on Indian Summer. Source: https://twitter.com ... 18
Figure 9. REST API model vs. Streaming API model. Source: https://dev.twitter.com ... 19
Figure 10. Open Weather Map weather stations in New York city. Source: https://openweathermap.org .. 20
Figure 11. Data collection scheme ... 20
Figure 12. Raspberry Pi. Source: www.raspberrypi.org/about ... 21
Figure 13. Further filtering scheme ... 22
Figure 14. Tweet example of weather reports. Source: https://twitter.com ... 22
Figure 15. Tweet example of the use of slang words. Source: https://twitter.com ... 24
Figure 16. Tweet example of the use of emoticons. Source: https://twitter.com... 24
Figure 17.Neutral tweet example. Source: https://twitter.com ... 25
Figure 18. Using the Natural Language Classifier service. Source: www.ibm.com/watson ... 25
Figure 19. Average temperature comparison between October 2015 -2016. Source: www.nrcc.cornell.edu ... 28
Figure 20. USA and Japan according to Köppen classification by Ali Zafan. Source: Wikimedia Commons ... 29
Figure 21. Climate diagrams comparison. Aomori, New York, Pittsburg and Boston. Source: www.klimadiagramme.de ... 30
Figure 22. Effective Temperature variation from Twitter data ... 31
Figure 24. Effective temperature thresholds at different months. Source: BARANOWSKA and GABRYL, 1981.
... 32
Figure 25.THI variation from Twitter data ... 33
Figure 26. THI ranges applied to the Twitter data ... 33
Figure 27. Variation of comfort sensation with air temperature. Source: SASAKI ET AL. (2000) ... 34
Figure 28. Variation of comfort sensation with Temperature from Twitter data ... 34
Figure 29. Variation of comfort sensation with Humidity. Source: SASAKI ET AL. (2000) ... 35
Figure 30. Variation of comfort sensation with Humidity from Twitter data ... 35
Figure 31. Variation of comfort sensation with wind. Source: SASAKI ET AL. (2000) ... 36
Figure 32. Variation of comfort sensation with wind from Twitter data ... 36
Figure 33. Variation of comfort sensation with weather description. Source: SASAKI ET AL. (2000) ... 36
Figure 34. Variation of comfort sensation with weather description from Twitter data ... 37
Figure 35. Variation of comfort sensation with cloud coverage from Twitter data... 37
Figure 36. Total number of tweets for all weather parameters (a. Temperature, b. Humidity, c. Wind speed, d. Cloud coverage and e. Weather description) ... 38
Figure 37. Example of the opinions reflected by tweets. Source: https://twitter.com ... 41
Figure 38. Tweet example of weather preferences in compliance with personal activities. Source: https://twitter.com ... 41
Tables
Table 1. Thermal sensation ranges for simple indices ... 5
Table 2. THI Classification ... 5
Table 3. Discomfort sensation ... 6
Table 4.Effective Temperature ranges and assessment scale. ... 31
Abstract
Human Comfort in Outdoor Spaces (HCOS) is linked to physical, physiological and psychological responses of people to environmental variables. Previous studies have established comfort ranges for these variables through questionnaires, reaching only small populations. However, larger amounts of data could not only generate more robust results in local studies, but also allow the possibility of creating an approach that could be applied into a wider range of weather conditions and different climates. This thesis describes a new methodology to assess people’s perception of weather based on human responses to weather conditions extracted from tweets, with the purpose of establishing comfort ranges for environmental variables. Tweets containing weather-associated keywords were collected using the Twitter API and then linked to real-time meteorological data acquired from the Open Weather Map API, which provides weather variables measured nearby the locations in which the tweets were posted. Afterwards, people’s perception of weather was extracted from the tweets using a classifier trained specifically on weather data that identified irrelevant, neutral, positive and negative tweets. The obtained tweets and their related meteorological data were analyzed to establish comfort ranges. Comparing the resulting ranges to others obtained in previous studies, a generally good agreement was found with the indices Effective Temperature (ET) and Termohygrometric index (THI) derived from questionnaires, but the peak of comfort is shifted towards lower and higher temperatures, respectively. Regarding the single weather variables, the obtained comfort ranges are alike the ones found in previous research, in particular, the temperature comfort range matches perfectly at 20 °C – 22 °C. Therefore, it was concluded that tweets can be used for the assessment of HCOS; not only the results of this methodology are comparable to the ones obtained in previous studies, but also the procedure itself shows new features and opportunities for future applications.
1 | P a g e
1.
Introduction
In the past years, there has been an enormous growth in the use of microblogging platforms like Twitter. Millions of messages are posted daily, on real-time, covering a wide range of topics, including opinions and feelings concerning Twitter users’ lives (Pak and Paroubek, 2010). Therefore, this platform has become a rich source of data for opinion mining and sentiment analysis, which aim at determining the attitude of a writer with respect to various topics (Kumari et al., 2015). Besides expressing views and opinions, tweets provide novel answers to classic questions and reports on current events. For this reasons, they could be used to predict, monitor, and cope with many different types of events, from simple matters of daily life to massive crises in the global scale.
Moreover, Twitter is the container of various types of available user-generated data that was published using smartphones and other GPS-enabled devices. Under this perspective, tweets are geographic information that can support decision making processes, when combined with other kinds of information such as sensors installed in certain locations with specific scopes. In this context, tweets highlight the potential of using citizen as sensors to improve people’s quality of life, which is a concept that is recurrently used by authors like Goodchild and Sheth. They and many others see citizens as a network of human sensors with billions of components that share their observations and views using mobile devices and Web services. They use their background knowledge, experience and perception to synthesize and interpret local information (Crowley et al., 2013).
It is also true that most tweets contain little information value and sometimes their reports do not correspond to the actual location of the user. Nevertheless, it is the aggregation of them that can generate meaningful content that can be translated into knowledge (Paul and Dredze, 2011). Twitter provides information that is not available in other intelligent sources, since it includes huge amounts of available data generated from users located close to the action (Panasyuk et al., 2013).
Several studies have demonstrated that the aggregation of tweets can provide valuable insights into a population (Paul and Dredze, 2011). Interesting patterns of aggregate sentiments, opinions and reports have been identified and used to measure and predict real-world events (Hannak et al., 2012). However, the nature of Twitter data requires practical approaches to obtain meaningful contents from it.
At analytical level, there are several technological innovations that help making sense of the large number of tweets (Kumari et al., 2015), so they can be efficiently used for social studies (Pak and Paroubek, 2010). For example, machine-learning methods have been trained on annotations to extract emotions from this kind of data, giving insights into users’ feelings towards specific topics and enabling emotion-temporal analysis Roberts et al., 2012).
In this context, this project aims to assess people’s perception on weather based on human responses to weather conditions extracted from tweets to establish Human Comfort ranges that could be used in several fields such as biometeorology and urban planning.
So far, these ranges have been established through interviews and questionnaires, reaching only small populations. However, larger amounts of data could not only generate more robust results in local studies, but also allow the possibility of creating an approach that can be applied into a wider range of weather conditions and different climates. For these reasons, an alternative methodology for the assessment of Human Comfort should be proposed.
2 | P a g e
The remainder of this thesis is organized as follows. Chapter 2 introduces the concept of human comfort, as well as the evolution of its assessment and the importance and applications of comfort ranges. Chapter 3 presents practical examples of tweets used as data source for social research. Chapter 4 will illustrate the data collection process, the choice of the study area and the methodology implemented for the perception extraction. Chapter 5 presents the resulting comfort ranges and their comparison with other comfort ranges established in previous studies. It also shows the pros and cons of tweets and questionnaires, when analyzing human comfort. Finally, Chapter 6 summarizes the conclusions and motivates future work.
3 | P a g e
2.
Human comfort
In this chapter, the concept of human comfort will be introduced, as well as the evolution of its assessment in the last decades. Moreover, the importance and applications of comfort ranges will be illustrated. Human comfort is a state of feeling, even if it is not associated to any specific sense organ. It is generally connected to pleasant conditions that are related to health and happiness. In specific, human thermal com-fort has been defined as “the state of mind which expresses satisfaction with the thermal environment” (Gagge et al., 1967). This means that thermal comfort is linked to the psychological responses of people to environmental variables.
In the past decades, several scientists from different disciplines have tried to define thermal comfort scales for different reasons. At the beginning, they carried out experiments conducted in indoor spaces that al-lowed the variation of a single parameter while maintaining the rest of them constant. By applying this methodology, they discovered important features of the comfort perception.
For example, Gagge et al. (1967) performed experiments on unclothed subjects exposed to various temper-atures. They observed that when body temperatures tended to the physiological neutrality people felt more comfortable, even if the same temperatures were related to discomfort in other circumstances.
Gagge et al. (1968) completed a second series of experiments, but this time they considered subjects doing physical activities. They concluded that warm discomfort and temperature perception are less affected by changes in temperature during exercise that during rest. They also described a comfortable zone for steady exercise, considering metabolism rates and perspiration, as well as humidity, wind speed and air tempera-tures. The lower boundary of this zone coincided with skin sweat equal to zero and the upper boundary corresponded to 65 % wetness of the skin.
Fanger (1972) performed chamber experiments, measuring sweat rate and skin temperature of people who considered themselves comfortable at various metabolic rates. He concluded that the ideal conditions for thermal comfort can be deduced from the metabolic rate, clothing insulation and environmental conditions. His model, based on indoor climate, allowed the calculation of the Predicted Mean Vote (PMV), which was one of the most popular comfort equations during the 1990s.
Then, the scientific community shifted its interest to the Human Comfort in Outdoor Spaces (HCOS), moti-vated by the need to explore the real conditions in which humans perform their everyday activities. Thus, the PMV equation was extended by Jendritzky (1979) to be applied in outdoor conditions, using the Klima-Michel-Model. Nevertheless, PMV was very hard to use for people who did not belong to the thermophysi-ology field and, therefore, other indices were proposed.
Some of them still focused on human metabolism and heat balance equations (e.g. Psychological Subjective Temperature, Standard Effective temperature, Psychological Equivalent Temperature, Perceived Tempera-ture), but others moved their emphasis into the monitoring of environmental variables. The latter indices were also called simple indices because they neither consider thermo-physiological parameters into their formula nor are they built on heat balance models. Instead, they only show the joint effects on the human body of several meteorological variables, based only on empirical research or some general theoretical con-siderations. Over time simple indices outmatched the complex ones due to their easier implementation and the fact that they do not require invasive measurements (e.g. rectal temperature) (Blazejczyk et al., 2012).
4 | P a g e
The following is a selection of comfort indices based on meteorological measurements. Among them, Heat Index, Humidex, Effective Temperature, Wet-bulb globe temperature, Apparent Temperature and Wind Chill:
− Heat Index (HI) combines temperature and relative humidity to define an apparent temperature. It is applicable in cases in which the temperatures are above 20 °C. It assumes that when humidity is high, the evaporation of water is low, which means that the body would retain more heat than under dry air conditions.
− Humidex describes as how hot humid weather is perceived by an average person. It combines temperature and vapor pressure.
− Effective Temperature (ET) defines the thermal exchange between a human organism and its environment, considering wind speed, relative humidity and temperature. It assumes normal atmospheric pressure values and normal body temperature.
− Wet-bulb globe temperature (WBGT) is one of the most used heat stress indices in the world. It is a kind of apparent temperature used to assess the influence of temperature, humidity, wind speed, and sunlight on bodies.
− Apparent Temperate (AT) is a modification of the ambient temperature based on humidity levels. There are two formulas for AT. The first includes solar radiation, vapor pressure, wind speed and temperature, while the second one excludes solar radiation.
− Wind Chill (WC) expresses the cooling power of wind in total shade and without evaporation. It includes temperature and wind speed values.
The characterization of Human Comfort includes also the definition of verbal categories for comfort percep-tion rages that accompany the indices. These categories have also been the focus of numerous studies in for years. Winslow et al. (1937) presented a way of classifying comfort sensation, using only 5 classes (very pleasant, pleasant, indifferent, unpleasant and very unpleasant), while Nevins et al. (1966) decided to clas-sify thermal sensation using 7 classes (cold, slightly cold, cool, comfortable, slightly warm, warm and hot). Gagge et al. (1967) analyzed both comfort sensation and thermal sensation of unclothed subjects exposed at various temperatures, obtaining combined sensations as pleasantly warm or pleasantly cool. Later, Fanger (1972) adapted Nevins’ classification to his PMV equation, but his output ranges were criticized later for being abstract numbers, instead of temperature values that could be easily be compared. Jendrizky et al. (1979) developed a human biometeorological classification for thermal stress on human bodies using PMV values. They proposed a six-classes table (no stress, resting range, slight stress, moderate stress, strong stress and very strong stress) to describe also outputs ranges consisting of abstract numbers.
The thermal sensation classification proposed by Nevins is currently the most used, and over time other classes were added. The following table shows the comfort perception ranges of the 5 indices presented above (Table 1), which provide temperature as the output value of their formula, accompanied by an ex-tended version of Nevins’ classification.
5 | P a g e
Table 1. Thermal sensation ranges for simple indices
HI Hum ET WBGT WC Thermal sensation
>54 >55 >30 Sweltering 41–54 45–55 >27 28–30 Very hot 32–41 40–45 23–27 24–28 Hot 27–32 30–40 21–23 18–24 Warm <30 17–21 <18 >-10 Comfortable 9 –17 -27–-10 Cool 1–9 -39–-28 Cold <1 -54–-40 Very cold <-55 Frosty Extreme hazard
In the past years, the European Union has been developing the Universal Thermal Climate Index (UTCI). It is based on recent scientific progress in human response related thermo-physiological modelling, therefore, is very sensitive to changes in wind speed, temperature, solar radiation and humidity. So far, UTCI is the most versatile index of HCOS and it is expected to become an international standard (Nass, 2017). Several research efforts have been made to evaluate UTCI outputs. Blazejczyk et al. (2012), for instance, presented a comparison analysis of UTCI and some of the most used thermal indices. He concluded that all the indices based on heat balance models had a higher correlation with UTCI than the simple ones, mainly because they do not consider solar radiation in their formula. The only exception was the Effective Temperature, which showed the second highest correlation (96.7), after Standard Effective temperature (97.5). ET can also be applied under a wider range of thermal conditions, in comparison to other simple indices, as we can see in table 1.
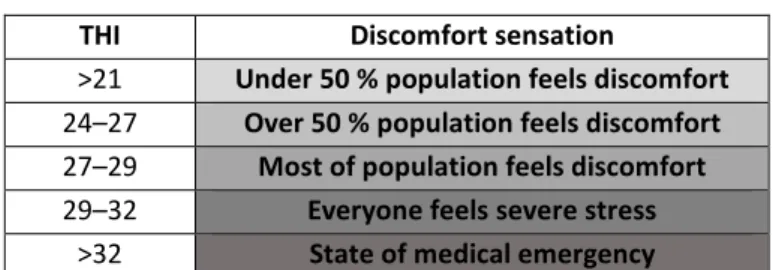
Nevertheless, ET can be also estimated through the application of Thom’s discomfort index, which is also called Thermohygrometric Index (THI). It was originally used to calculate discomfort due to heat stress, but over time, it has been applied into a broader variety of conditions. An assessment scale has also been established for THI. In this, comfort conditions occur between 15 °C and 20 °C. Under 15 °C, thermogenic mechanisms are required to fight cold stress and, over 20 °C, the perspiration system must be activated to prevent overheating. As one may see in Table 2, the THI assessment scale is less detailed when heat increases. Therefore, further research has introduced a classification table for summer (Table 3), based on the discomfort sensation. Nowadays, THI is widely used to estimate the differences of urban and rural bioclimatological conditions (Unger, 1999).
Table 2. THI Classification
THI Thermal sensation
>30 Torrid 26.4–29.9 Very hot 20–26.5 Hot 15–20 Comfortable 13–15 Cool 1.7–13 Cold -10–1.7 Very cold -10–-20 Extremely cold -20–40 Glacial <-40 Hyper glacial
6 | P a g e
Table 3. Discomfort sensation
THI Discomfort sensation
>21 Under 50 % population feels discomfort 24–27 Over 50 % population feels discomfort 27–29 Most of population feels discomfort 29–32 Everyone feels severe stress
>32 State of medical emergency
The application of indices has been proved to be very valuable to the assessment of HCOS and the definition of its comfort ranges. Nevertheless, it is not the only way. Several researches have studied the effects of single weather parameters on people’s perception. Stathopoulos et al. (2004), for example, chose the parameters wind speed, air temperature, relative humidity and solar radiation. They investigated the relationship between the comfort level of human activities and these four major weather parameters in Montreal and exposed their effect on comfort perception and preferences. Similarly, Nikolopoulou and Lykoudis (2006) studied the same four weather parameters, but across 7 European cities and throughout a whole year, to inquire into the relationship between microclimatic and comfort conditions.
In other cases, the combination of wind speed, humidity, temperatures and solar radiation was not chosen. For instance, de Motingny et al. (2011) studied the effect of temperatures, precipitation intensity and sunlight hours on pedestrian fluctuations in 9 different cities located in the northern hemisphere and Thorsson et al. (2007) related the presence of people in open spaces to temperature, wind speed and sky clearness, excluding solar radiation due to the difficulties in measuring it. These three parameters were proven to influence people’s perception of public open spaces as comfortable in different extends in Sweden and Japan. Sasaki et al. (2000) studied the relation between comfort sensation and meteorological factors in Northern Japan, by taking into account wind speed, relative humidity, temperatures and weather description.
7 | P a g e
2.1Further factors to HCOS
The study of weather parameters has revealed their strong influence on comfort perception. Nevertheless, it has been demonstrated that psychological factors may be as important as the physical ones (Nikolopoulou et al, 2003). Even if the complexity of the assessment of the Human Comfort in Outdoor Spaces (HCOS) has been discussed, there are still some factors that must be considered to define HCOS ranges.
First of all, adaptation, which implies all the actions that make humans better suited to survive a specific environment. It can be separated in three different categories physical, physiological and psychological. Physical adaptation involves both personal changes such as modification of clothing or consumption of hot drinks and changes that people make to their surroundings to improve their comfort. Physiological adapta-tion implies a change in the funcadapta-tions of the human body because of repeated exposure to specific condi-tions. Finally, the psychological adaptation contemplates the fact that each person perceives the environ-ment in a different way depending on the information that this person has about a certain situation (Ni-kolopoulou et al, 2003). This last category includes the effects of seasonal fluctuations and cultural differ-ences on the comfort perception.
Seasonal fluctuations affect people’s perception of weather because the average parameters for a certain season characterize the expectation of acclimatized residents; in other words, “expectations of seasonable weather conditions among residents may condition the physiological response to weather” (Stathopoulos et al., 2004). Consequently, the expectations on people’s perception affect people’s choice of clothing and, since people are prepared for a specific thermal sensation at that specific time, they may interpret any variation as dissatisfaction (Nikolopoulou and Lykoudis (2006). Nevertheless, the opposite can also be true, as Palutikof et al. (2004) discovered when studying people’s responses to exceptional mild winters. They found that 69 % of the interviewed believed that warm winters have a positive impact on their comfort, as well as in their leisure activities. Moreover, 66 % of the people declared to prefer unusual warm weather to unusual cold weather and the idea of having more mild winters in the future was considered by them to be either pleasant or very pleasant.
Skewed results in comfort studies that compare two or more regions are usually related to cultural differences. For example, the study by Thorsson et al. (2007) on thermal comfort and outdoor activity exposed differences between human behavior related to sun and exposition time in South Japan and Sweden. They found out that thermal conditions have a smaller effect on the attendance to open spaces in Japan than in Sweden. They associated this result not only to climate, but also to cultural differences between the two countries. Since in Scandinavia the time spend outdoors is confined by cold weather and short sunshine hours and their ideal of beauty includes suntanned skin and, in Japan, the cold weather is rarely a problem and the ideal of beauty is light skin. Moreover, Palutikof et al. (2004) and his team, in another study, considered samples taken within Scotland and England to compare the results and attribute eventual differences in the results to cultural more than climatic differences. Also, de Motingny et al. (2011) studied the effects of temperatures, sunlight and precipitation on the number of pedestrians in nine different cities located across the northern hemisphere. He noticed that the pedestrian flow increased when it was not raining or snowing. But the degree of this variation changes across the different cities accordingly to the character of the local environment, the social aspects of walking and the inhabitants’ adaptations to the local weather.
8 | P a g e
Consequently, due to physical, physiological and psychological adaptation the perception of the same weather conditions and weather preferences may vary in relation to where people live. For example, Ni-kolopoulou et al. (2006) carried out a study in four different open spaces in the city of Cambridge during spring, summer and winter. She and her team noticed that the greater number of people outside was found during the summer, so they concluded that people enjoyed feeling warm. However, considering their expe-rience in other study areas, they argued that in warmer climates the situation would be the opposite and more people would be found outdoors when temperatures are lower than the average.
Furthermore, weather preferences may also be related to people’s activities. People performing physical activities, like jogging or biking, prefer different weather conditions than people sitting in a square or walking to work. This is due to a variation in their metabolic rate and, consequently, in their thermal balance.
How-ever, it must be considered that activities may change the perception of thermal comfort as much as thermal
comfort affects people’s activities. For example, air temperatures have been proved to have a great impact on walking times and people’s attendance to open spaces (de Motingny et al. 2011).
9 | P a g e
2.2Applications of the HCOS assessment
The health and comfort of people living in cities have been considered by the urban planning field through urban biometeorology. The field was established to evaluate the combined effect of weather, climate and air pollution on humans, by defining threshold values that can include not only measurements, but also the physiological aspect into the assessment (Mayer, 1993). Urban biometeorology is divided in two different aspects: the air quality and the thermal component of the urban climate, and it is very important to distinguish them. The thermal component, the one of our interest, is based on the idea of the perfect urban climate. It may be utopic, but can be approached by avoiding extreme conditions and minimizing climatic stress on citizens (Jendritzky et al., 1979). Studies suggest some general conditions in which people are bioclimatically comfortable: temperature between 21 and 27.5 °C, relative humidity between 30 and 65 %, and wind speed up to 5 m/s (Toy et al., 2007).
Urban biometeorology is also related to the assessment of the quality of urban living, which includes 9 factors: material wellbeing, health, political stability and security, family life, community life, climate, job security, political freedom and gender equality (Economist Intelligence Unit, 2005). Regarding the climate factor, the strategy they have been following is to rate cities highly when they remained close to 21 °C all year around, and penalize places that have extremely cold or extremely hot temperatures. Yet, it was pointed out that some people enjoy hot weather and others like cold weather, and yet others enjoy seasonal changes. So, even if the climate factor principle rests on the assumption that mild climate is the most desirable one, which is a widespread presumption, it is often problematic in complex and heterogeneous societies (Diener et al., 1997).
Over time, the applications of the comfort perception analysis multiplied and its aim was not only to explore and quantify the impact of weather on human health, but also to understand how weather characteristics support specific social behaviors. In this context, architects and urbanists gained interest in the subject, since most of the activities that take place in cities are affected by weather parameters, which in turn influence the physical environment of the inhabitants. Having specific threshold values or comfort ranges for each of these weather parameters would be of great help at the early stages of urban design and planning. Knowing people’s comfort requirements linked to everyday activities such as walking, biking and attending to public open spaces, urban planners can successfully create urban areas that attract large numbers of people and become economically profitable, modifying the image of a city (Nikolopoulou and Lykoudis, 2006).
Penwarden (1973), for example, established limits to wind speed that were acceptable or unacceptable for pedestrian areas. He used the Beaufort scale as a base for his studies. This table, which was built in 1805 to measure wind speeds, considers observations rather than accurate measurements, so Perwarden integrated it with calculations of wind force on the human body, its effects on balance and the effort needed to walk against it. The results show that speeds over 5 m/s are at the beginning of the discomfort limit, those around 10 m/s were classified as absolutely unpleasant and, finally, the speeds of about 20 m/s are considered dangerous. The higher the wind speed the larger the consumption of energy to maintain walking speed and balance.
We can find an example of how comfort ranges provide useful information to urban planners in San Fran-cisco, USA. There, the Recreation and Park Department has approved separated ordinances for sun and wind, based on comfort in outdoor spaces (Arens and Bosselmann, 1989). Since San Francisco presents a cool cli-mate, the sun ordinance states that any decrease of sunlight is penalized. The wind ordinance, on the other
10 | P a g e
hand, assumes that air temperatures are low and strong winds are translated into unpleasant cooling. Nev-ertheless, these criteria may be acceptable for the local climate, but in other climatic regions they will be incorrect and, consequently, they will lead to inappropriate decisions.
Other studies were concerned with the influence of weather on walking levels in urban areas. For instance, de Motingny et al. (2011) studied the effects of temperatures, sunlight and precipitation on the number of pedestrians in nine different cities located across the northern hemisphere. He noticed that the pedestrian flow increased when it was not raining or snowing. He also compared the urban features of the cities under study and concluded that air temperature, irradiation and precipitation effects can be controlled within some certain limits and, consequently, suggested microclimate manipulations through physical urban design to enhance walking.
It has been shown by Thorsson et al. (2007) that walking trips are more resistant to weather than public open space attendance, since the first is frequently necessary to complete routine paths or chores and the second one is mainly a voluntary activity. In fact, studies on this matter have demonstrated that the presence of people in open spaces is very sensitive to weather and any variation in this relation is related to cultural and climate factors. The sensibility of the attendance to some public open spaces can also be related to the nature of the space: its location and function in the city. Some squares are located nearby office areas are transportation nodes, while some others are located outside of the city center and are more dedicated to leisure activities. With this in mind, urban designers can consider the HCOS ranges to modify the characteristics of open spaces and their surroundings support stationary social activities.
11 | P a g e
3.
Twitter as a data source to understand and predict real-world phenomena
In this chapter, practical examples of tweets used as data source for social research will be presented to give a panoramic view of what has been done so far.
In the last years, social media has grown until the point in which it is almost ubiquitous. Thus, there is a proliferation of easily and quickly accessible data that could transform social science research. In this context, many researchers have started to collect data from social media platforms to document and monitor spontaneous expressions of moods, feelings, attitudes, opinions, activities and interactions (McCormick et al., 2015). What makes social media platforms an interesting data source is that they contain vast quantities of traces of human behavior related to a wide array of topics, in real-time and on large scale. While single messages contain little value, it is the aggregation of them that generates important insights into specific populations (Paul and Dredze, 2011).
Even though Facebook, YouTube and Instagram are the most popular social media platforms nowadays (Figure 1), Twitter seems to be the favorite for social research. This may be because Twitter makes it easier to find and follow conversations, which gives insights into people’s interactions. Also, big events and news stories are easy to find as they are usually associated to a hashtag. Moreover, the Twitter API is more open and accessible than other social media platforms’ APIs, which makes it more attractive to developers. This consequently increases the availability of tools like sentiment analysis and machine learning methods (which work well with Twitter data as tweets allow maximum 140 characters), as well as time series analysis. Finally, many researchers have a Twitter account and may feel more comfortable when using a familiar platform as a data source (Ahmed, 2015).
Figure 1. Top 15 most popular social networks worldwide by May 2016. Source: www.dreamgrow.com
In this context, Twitter data have proven to be useful in several different fields, for example, public health monitoring. Paul and Dredze (2011) collected more than one million tweets related to health disorders to track them over time and localize them geographically. They concluded that public health institutions and researchers should integrate the current methods to survey sicknesses and symptoms with Twitter data to increase both the range and the type of information that can be tracked. Krieck et al. (2011) argue that the detection of disease activity in an early stage, if followed by a fast response, can reduce the effect of epidemics. To address this challenge, they collected and analyzed twitter messages posted during sickness outbreaks and concluded that they can be relevant for public health threats detection.
12 | P a g e
Tweets can also track political opinions or predict election results. Bekafigo and McBride (2013) investigated how citizens use Twitter to engage in politics. The results demonstrated that traditional political activist tweet about politics more often, but also some marginalized groups, such as racial minorities, participate in Twitter conversations, which may indicate that they have found a space to express their political opinions. Gerbaudo (2012) analyzed protest movements of the 21st century. He found a connection between the escalation of social media and the appearance of new kinds of protest. Tumasjan et al. (2010) collected tweets before the 2009 German election and concluded that the opinion trends reflected in their data paralleled the results of the election, while Scorik et al. (2012) studied the use of Twitter during elections in Singapore and found out that the accuracy was significantly lower than in the previous case, which suggests that media freedom, among other issues, might have led to inaccuracies in the estimations of the voting sentiment.
Cox and Pale (2011) studied how to use tweets to increase the accuracy of localized weather events reports and they concluded that the twitter stream does not contain enough contextual information for the spatiotemporal analysis they proposed and, therefore, the monitoring of localized weather events for many areas would not be possible. Nevertheless, they argued that it could be very useful during significant weather events like hurricanes or earthquakes. Lachan et al. (2014) collected tweets within #nemo and #bosnow (which were created to share information about the winter storm that affected USA and Canada in 2013) from the historical archives of Twitter. Their aim was to categorize different kinds of risk perception observed in national and local hashtags and found out that localized hashtags provide a stronger sense of relevance to people. Moreover, they suggested that since Twitter can allow government agencies to monitor public reactions in real-time, they should provide useful information through these kinds of hashtags.
Mood rhythms on large scales have been also observed through tweets, as it was demonstrated in a recent study carried out by a group of scientists from Cornell University. They measured and mapped the frequency of words expressing positive and negative emotions to show how individual mood varies from hour to hour, day to day, and across the seasons. They found that there are robust rhythms across diverse cultures but, in general, people tend to be in better mood during the morning (Asanet, 2012). Similarly, Biever (2010) used tweets to map moods on large scale, discovering the general emotional state of America over a period. But moods can be also modelled, as Bollen et al. (2011) demonstrated. They performed sentiment analysis on tweets, extracted six mood states and compared their results to a list of popular events. They found out that events in the social, political, cultural and economic domain have a significant and immediate effect on public mood.
Regardless of their application, the studies above and many others suggest that tweets are a good source to understand human activities and attitudes. They are spontaneously created and archived by humans, so they allow researchers to see what people are doing and saying, and how they feel about specific events while they are still happening. It is undeniable that they are an extraordinary form of data with huge research potential. Nevertheless, it must be appropriately managed and such a task presents several challenges (McCormick et al. 2016).
For example, even if Twitter’s API offers a fast way to collect great amounts of data in real time, it provides a sample that only includes up to one percent of all tweets if a filter is not used, which implies a lack of transparency regarding how tweets are sampled within the stream(Cox and Plale, 2011). On the other hand, the filtering requires the definition of key words or hashtags to define the research and it has been argued that certain keywords or hashtags may not only give a partial data set related to a topic, but also could introduce a systematic bias.
13 | P a g e
Moreover, a sample of Twitter users considered for a study does not represent the offline population nor all the Internet users. As it was shown in a survey carried out on May 2016 in the USA, only 24 % of the people with internet access and 21 % of the total population used Twitter (Greenwood et al. 2016). Moreover, it does not even represent all Twitter users because not all of them are interested in the same topics (Ahmed, 2015). This may lead to the exclusion of certain populations, generating biased results and new social discriminations and aggravating existing structural inequalities. In fact, the same survey showed that disadvantaged and elderly people continue to be underrepresented online as younger people were more likely to use Twitter than older people. Thirty six percent of online adults between 18 and 29 years of age are Twitter users, compared to 23 % of people between 30 and 49, 21 % between 50 and 64 and only just 10 % of over 65. Twitter was also more popular among the highly-educated (29 %), better paid (30 %) and urban citizens (26 %) (Greenwood et al. 2016).
Furthermore, it is also difficult to obtain demographic data from tweets since users often do not provide this information. This is a great problem for social research because this kind of information is often vital to examine differential patterns in humans’ behavior (McCormick et al. 2016). For these reasons, Tweets can be used for theory generation, but it must be clear that they are related to a specific respondent pool. Other problems are that tweets are messy and unfocused data that do not respond to a specific research question, they can generate skewed results due unrelated information, they present an idiosyncratic nature and users appear multiple times in the data (McCormick et al. 2016). Moreover, as Marks (2013) demonstrated in his research “Happy, snappy tweets gain more followers”, so people tend to tweet positive messages to be popular on Twitter, which means that more positive than negative tweets are posted. Additionally, Twitter gives information about what people do, but these activities are limited to those things that users like to share with their friends or followers. Similarly, it is possible to know when people write, but not when the activities they describe actually occur.
Finally, since most of the social researchers lack the skills to process online data, computer scientists are the ones that are taking advantage of this continuous flow of data. However, they do not always have the appropriate training to make the correct queries, to identify unsupported assumptions and to face the social consequences of the results (Asanet, 2012).
Besides these methodological problems, the use of tweets for research also implies ethical issues. Even if most tweets are considered public, since approximately 88.2% of the Twitter accounts are not protected, they are still linked to people’s lives. Consequently, researchers must handle publications with care, particularly when they are related to sensitive topics (McCormick, 2015).
For these reasons, there is a huge controversy related to the use of tweets as data source for social research. Some people argue that widely available data, no matter the scale, are not better data and, therefore, are not an option. Others say that Twitter could be used as current and historical data source for social science research, but as a complement to traditional data sources (Asanet, 2012). Nonetheless, it must be accepted that Twitter provides important insights into human behavior and it should not be discharged as useless. Instead, researches must be creative and innovative in how to collect and analyze them in a proper way.
14 | P a g e
4.
Concept and Methods
4.1Aim and objectives
In this context, this project aims to establish reference comfort ranges for weather parameters based on human responses to weather conditions extracted from tweets posted within the Northeast Climate Region of the USA during autumn.
The idea is to collect and store tweets that contain weather-associated keywords from the Twitter streaming API and then link them to real-time meteorological data collected close to the specific locations the tweets are posted. Afterwards, people’s perception of weather will be extracted from the filtered tweets using a classifier trained specifically on weather data that will identify irrelevant, neutral, positive and negative tweets. Subsequently, positive and negative tweets and their related atmospheric data will be analyzed to establish comfort ranges for each weather parameter under study. Finally, the resulting ranges will be compared to other comfort ranges obtained in previous studies to evaluate the reliability of the Twitter stream for assessing human outdoor perception.
Figure 2. Concept and methods scheme
Since the influence of the adaptation factor must be considered, this project will address a specific location during a specific period. However, if the methodology works and thus Twitter is proved to be a reliable source of information for this purpose, future work could consider wider areas and times.
15 | P a g e
4.2Study area
The Northeast region of the USA was chosen as the study area for very specific reasons. First, The United States of America are the country with the highest amount of Twitter users, as it was illustrated by the social media update of May 2016 (Figure 3), 67.54 million people had an active Twitter account in the USA, representing 21 % of the entire population. This means that this country is generally the most suitable one to evaluate the reliability of Twitter as a data source.
Figure 3. Number of active Twitter users in millions by May 2016. Source: Worldwide Statista market analytics (Greenwood et al., 2016)
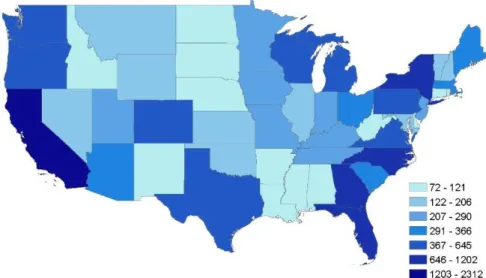
Secondly, a map regarding the distribution of weather tweets across USA was made, using the testing data collected during August 2016 (Figure 4). As it can be seen, the Northeast, the Southeast and the West regions showed the highest amount of weather tweets across the country. However, the Northeast region is the one with the highest weather variability over the seasons.
Figure 4. Number of collected tweets by state. August 2016. Source. Twitter.
The Northeastern United States, as defined by the U.S. Census Bureau, includes Maine, New Hampshire, Vermont, Massachusetts, Rhode Island, Connecticut, New York, New Jersey, and Pennsylvania.
0 10 20 30 40 50 60 70 80 USA India Indonesia Japan China Brazil UK
16 | P a g e
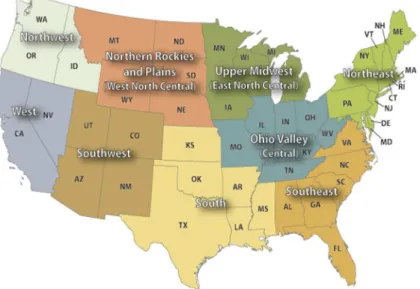
It has also been defined as an independent climatic region by the National Oceanic and Atmospheric Administration (NOAA) (Figure 5).
Figure 5. Climatic regions in USA. Source: www.ncdc.noaa.gov
The Northeast shows a varied climate. Average temperatures decrease towards the north, with distance from the coast, and in the mountains. Average annual rainfall varies by about 500 mm throughout the region, from 1270 mm annually in the coastal areas and elevations to 812 mm in Pennsylvania and New York. During winter, frequent storms bring cold and precipitation, especially to the north. Snowfall ranges from over 2500 mm per year in New York to small amounts in Maryland. Generally, it presents warm, humid summers and snowy, severely cold winters in the north and hot, humid summers and moderately cold, snowy winters in the south (NOAA, 2017). Finally, it is important to mention that the Northeast region belongs to the humid continental climate (Dfa-Dfb) in the climate classification made by Köppen.
This region is also one of the windiest in the USA, as Figure 6 illustrates.
17 | P a g e
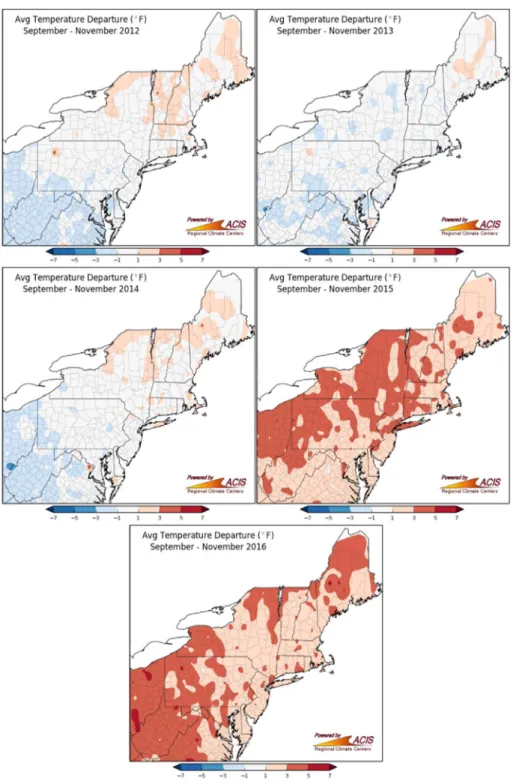
The climate has been changing in the last years in the Northeast region (Figure 7) and records show earlier springs, hotter summers and warmer autumns and winters.
Figure 7. Average temperature departure. Autumn 2012, 2013, 2014, 2015, 2016. Source: www.nrcc.cornell.edu
In fact, in 2016, the region had its third warmest year on record. Regarding autumn, it has been showing higher temperatures and a three-week delay in the arrival of the typical cool fall weather. Also, short recurrences of warm summer days during the fall months called Indian summer (Figure 8) are becoming more frequent. The year 2016 had the third warmest autumn on record for the Northeast region. West Virginia had its second warmest autumn on record, while New York, Washington D.C. and Connecticut had their warmest autumn on record (NRCC, 2017).
18 | P a g e
19 | P a g e
4.3Data
For this study case, two different kinds of data were collected. First, tweets related to weather that were posted within the Northeast region of USA during autumn and, second, real-time weather data linked to the locations of the tweets. In this chapter, the data sources will be introduced, the processes of data collection and filtering will be explained and the specific data fields that were used for the HCOS assessment will be illustrated.
4.3.1 Data sources
The collection of data from a web platform can be automated by using a program to access the platform’s Application Programming Interface (API). In this way, data can be gathered thought structured queries regarding specific topics or attributes. For this project two APIs were used. The Twitter API and the Open Weather Map API.
Twitter API
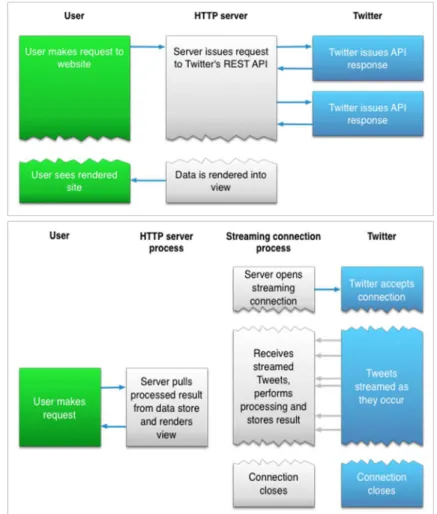
The Twitter API includes the related documentation, data, code, and other materials that Twitter made available for developers to access its data. Twitter provides the REST API, in which a user can make one or more requests and then obtain the response, and the Streaming API that continuously deliver new responses to users’ queries. Connecting to Streaming API requires a persistent HTTP connection. While the Streaming model is more complex than the REST model (Figure 9), it gives the possibility of having a real-time stream of Tweet data.
20 | P a g e
Open Weather Map API
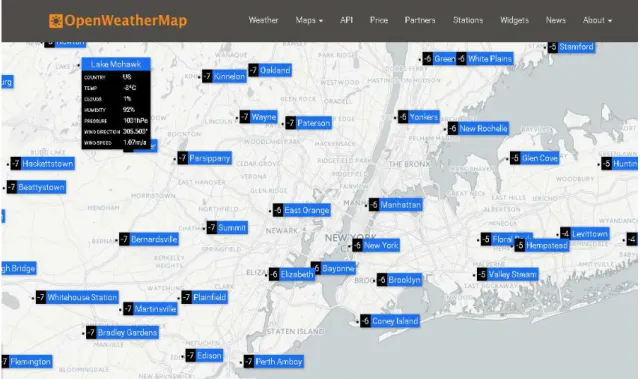
The Open Weather Map service allows to collect current and historical weather data, as well as weather forecasts. It is based on a spatial data science platform that collects, processes and distributes information. The collection of data includes more than 40.000 professional and private weather stations and forecasts of meteorological services and research laboratories. Long-term and short-term forecasts and real-time data from weather stations are combined and stored in the database and then processed with algorithms to create interpolated data of current weather conditions. Finally, the API allows access to data at any location on Earth, including over 200,000 cities, to support research and inspire new innovative applications. Data is available in different formats and calls can be made by geographical coordinates, by city ID or by ZIP code (Open Weather Map, 2012).
Figure 10. Open Weather Map weather stations in New York city. Source: https://openweathermap.org
4.3.2 Data collection
The process of collecting and cleaning data was divided into three stages. Extracting tweets from the Twitter API, linking tweets to the Open Weather Map API and storing the tweets and the meteorological data on the Raspberry Pi.
Figure 11. Data collection scheme
In this case study, the Twitter streaming API was accessed using a Python script and the tweepy library. Queries were designed to capture information on individuals who expressed their feelings or opinions regarding their weather perception. Only tweets written in English that contained any of the following key words, which were collected from several weather glossaries online, were used for the extraction stage:
21 | P a g e
rain, rainy, wind, windy, sunny, sun, breeze, chilly, drizzling, flurries, fog, foggy, hail, frost, humid, humidity, hot, cold, temperature, blizzard, cloudy, heat, snowy, sunshine, thunder, umbrella, weather, storm, snow, snowing, raining, freezing, freeze, warm, mist, haze, °F, downpour, blustery, gale, graupel, overcast, scorching, chill, dry, arid, sunscreen, sunburn, sunlight, sweltering, sizzler, autumn, summer, springtime, summertime, °C, colder, coldest, hot, hottest, warmer, warmest, muggy and sleet.
For every received tweet, the script performed a selection in which only those that contained geographic information (coordinates) were chosen. Afterwards, for each chosen tweet, a call by geographical coordinates to the Open Weather Map API was made to obtain the current meteorological data for the tweet location. The resulting information was then stored in a CSV file.
The variables collected from the Twitter API were:
− User ID is a unique number that identifies each user.
− User name refers to the name of the user, as they defined it when the Twitter profile was created. It is not necessarily a person’s name.
− Tweet text is the 140-characters text that compose the status update. It usually comes with a link to a picture or website.
− Tweet Time refers to the moment in which the Tweet was created.
− Tweet Coordinates represents the geographic location of the Tweet as reported by the user or client application. The inner coordinates array is formatted as GeoJSON (longitude, latitude).
− Tweet city, region and country are names of locations that correspond to the Tweet coordinates. They can be attached to Tweets by specifying a place id when tweeting.
The variables collected from the Open Weather Map API were:
− Temperature in Celsius (°C)
− Wind speed in meter per second (m/s)
− Relative Humidity in percentage (%)
− Cloud coverage in percentage (%)
− Weather description
To maintain the constant HTTP connection required by the streaming API and store the stream of tweets, a Raspberry Pi was used. It is a low-cost, high-performance and credit-card sized computer (30).
22 | P a g e
Once the connection was set, 1.198.663 tweets were collected from September 1th to November 31th. From those, 201.580 were posted within USA and 38.780 within the Northeast region.
4.3.3 Further Filtering
After the extraction of the data, further filtering had to be made to clean up the collected data. The first step was to eliminate duplicates. Then, only tweets posted within the Northeast Region of USA were selected.
Figure 13. Further filtering scheme
Afterwards, potentially irrelevant tweets were filtered out to effectively capture peoples’ weather perception. This required a methodical read of the tweets aimed at creating a second list that included frequently-occurring irrelevant words. These words were mostly related to weather reports, as it can be seen in Figure 14.
Figure 14. Tweet example of weather reports. Source: https://twitter.com
Finally, these tweets—which compose a great part of the total body of data collected—were systematically removed, along with job offers, products discounts and specific irrelevant hashtags, as they do not express any opinion or emotion and, therefore, are irrelevant for the perception extraction. The following is the list of irrelevant words:
“wind:calm”, “humidity up”, “humidity down”, temperature up”, “temperature down”, “dew point”, “today’s records”, “trump in”, “good morning#”, “#drinking a”, “gusting”, “#I’m at”, “USGS”, “today’s forecast”, “barometer”, “weather now”, “hiring”, “can you recommend anyone for this job”, “diabetic”, “Pittsburgh International Airport” and “just posted a photo@”.
23 | P a g e
4.4Perception extraction
Sentiment analysis is the task of extracting the opinions, feelings or perceptions of authors from text. The approaches to sentiment analysis can be divided into two main groups, supervised and unsupervised. First, the unsupervised approach is based on the definition of the semantic orientation (SO) of an object, namely sentences or words. To estimate its SO, an object is compared to two other sentences or words car-rying opposite polarities. An example for this are words like good and bad. Based on their co-occurrence in a specific corpus of documents or on-line resources, the statistical dependency between them is calculated. Thus, it can be known if the given object is closer in meaning to the positive word (good) or to the negative (bad). Sentiment lexicons are used to give the syntactic, semantic, and pragmatic information required to estimate the co-occurrence of objects and, therefore, calculate their statistical dependency (Feldman, 2013). Sentiment lexicons can be acquired in three ways. The first is building them by hand, which is a very time-consuming process. Secondly, lexicons can be based on dictionaries like Wordnet because they are “large lexical databases of English nouns, verbs, adjectives and adverbs are grouped into sets of cognitive synonyms and interlinked according to conceptual-semantic and lexical relations” (Princeton, 2017). Finally, if a domain-specific sentiment lexicon has to be created, a corpus-based algorithm can be used. These algorithms gener-ate graphs of words clustered by their function and polarity using the relations obtained from the corpus analysis.
Second, the supervised approach requires a set of training data that are already labeled. This means that part of the data is related to a set of classes that could contain either distinct emotions (anger, happiness, sadness) or polarity categories (positive, negative, neutral). The seeds are used to feed a classification (e.g. Naïve and Byes) or propagation algorithm (e.g. MAD) that classifies the rest of the data (Feldman, 2013).
Sentiment analysis can be applied at different levels: document-level, sentence-level and aspect-based. Giv-ing the character limitations of tweets, applyGiv-ing sentiment analysis to Twitter data occurs on sentence-level. When working with sentence-level sentiment analysis, it is important to distinguish the objective sentences from the subjective ones, because only the firsts contain opinions and feelings and, therefore, can be used for sentiment analysis. For this reason, supervised approaches for sentence-level sentiment analysis usually include a subjectivity classification, before applying the polarity classification. Moreover, one of the assump-tions of the sentence-level sentiment analysis is that each sentence must express a single opinion, otherwise, they must be separated into parts until this requirement is met. Nevertheless, specific kinds of sentences, such as conditionals or sarcastic remarks, are exceptions and must be handled with special strategies. It is important to consider that supervised approaches require a smaller number of seeds than unsupervised approaches to obtain the overall sentiment of the sentence. For this reason, supervised approaches are very common in sentence-level sentiment analysis.
Sentence-level sentiment analysis is a very complex process. Additionally, the nature of tweets, including very informal language, abbreviations, lack of orthography, slang words (Figure 15), introduces further diffi-culties (Kouloumpis et al., 2011).
24 | P a g e
Figure 15. Tweet example of the use of slang words. Source: https://twitter.com
For this reason, some researchers have created methodologies that combine supervised and unsupervised approaches to improve their outcomes.
For example, in the Urban Emotions project (Resch et al., 2015), researchers used tweets to detect specific emotions. They decided to apply the Modified Absorption Algorithm (MAD), which is a graph- based semi-supervised learning algorithm and requires only a small set of training data. MAD requires several steps. First, the tweets were filtered by language (English) and then volunteers were used for the annotation stage. Af-terwards, the seeds were selected according to the emotions they contain. Subsequently, the pre-processing stage started. In this case, the researchers used part-of-speech tagging and a lexicon called ANEW. Next, the degree of similarity between labeled and unlabeled tweets was calculated. For Urban Emotions, the similarity was not only based on linguistics and semantic content, but also on temporal and geospatial distance. At this point, they built the graph. The seeds and the unlabeled data were the nodes and the edges between them described their similarities. The stronger the edge, the higher the similarity degree. Finally, MAD was applied to the graph. It propagated the labels of the seeds over the unlabeled tweets using the similarity scores. This was done by comparing the scores between all pairs of nodes, starting with the strongest edges.
Similarly, other researchers are using microblogging features, such as emoticons and hashtags (Figure 16), to improve the selection of the seeds and apply machine learning techniques.
Figure 16. Tweet example of the use of emoticons. Source: https://twitter.com
For example, Go et al. (2009), applied the Naïve and Bayes algorithm, which is a probabilistic classifier based on the application of the Bayes theorem. This theorem describes the probability of an event in compliance with prior knowledge of the conditions that are related to that event. In this case, the prior knowledge was represented by the seeds including different polarity emoticons. They reached 81 % accuracy on their tests, but also found that the accuracy of this method decreases when using three categories (positive, negative and neutral), instead of two (positive and negative).
In another study (Hannak et al., 2012), decision trees, which are machine learning techniques, were applied to a general Twitter corpus (not weather-related) to predict the aggregate sentiment given the time of the day, the season and the weather. They constructed a Twitter-specific token list that used positive and nega-tive emoticons and calculated the relanega-tive fraction of times that each token occurred with a posinega-tive or a negative emoticon. Afterwards, they were able to estimate the sentiment score of each tweet. Nevertheless, they only obtained 65 % accuracy when comparing their sentiment analysis methodology with human ratings collected on Amazon Mechanical Turk.
25 | P a g e
Furthermore, several classifiers are available online to perform sentiment analysis due to the increasing mand of this service. The AYLIEN Text Analysis API was tested using weather-related tweets. AYLIEN is de-scribed as a “package of natural language processing, information retrieval and machine learning tools for easily extracting meaningful insights from textual content” (Aylien, 2012). It had a very high accuracy regard-ing the classification of positive, negative and neutral tweets, but it could not identify tweets irrelevant to the weather perception analysis, as AYLIEN was not trained on weather related data, but on general topics. In a nutshell, it can be said that traditional unsupervised approaches are suitable for the present study case, because they allow the creation of domain-specific sentiment lexicons. Nevertheless, this task is very com-plicated and requires a great deal of time. Similarly, semi-supervised approaches can also fit the aim of this project because they need a small set of seeds and could use already created lexicons. Unfortunately, a weather perception lexicon was not found online. Moreover, they require the creation of a similarity-based graph that would exceed the time and the effort available for this thesis. On the other hand, there are several services available online that offer sentiment analysis based on machine learning techniques, which fall into the category of the supervised approaches. Nevertheless, to completely fulfill the requirements of this thesis, the classifier must give a highly accurate performance on weather data, distinguishing between relevant and irrelevant tweets. Additionally, it must be trained to identify neutral, positive and negative tweets, because neutral tweets do not express opinions (Figure 17) and, therefore, cannot be used to extract people’s per-ception of weather.
Figure 17.Neutral tweet example. Source: https://twitter.com
With all this in mind, training a weather-specific classifier that can distinguish among irrelevant, positive, negative, and neutral tweets was considered as the most suitable option for the aim of this thesis.
4.4.1 Training a weather-specific classifier
To train a domain-specific classifier, three stages were completed. The preparation of the training data (also called annotation), the creation and training of the classifier and the evaluation of the results.
Figure 18. Using the Natural Language Classifier service. Source: www.ibm.com/watson
26 | P a g e
In the last years, platforms like Amazon’s Mechanical Turk and Crowdflower have been offering the possibility of using crowdsourcing to annotate texts to be used for natural language classifications. This methodology usually has better results on the annotation stage than part-of-speech and sentiment lexicons. Humans can easily recognize and understand sarcasm and irony, misspellings, slang words, abbreviations and other fea-tures that are distinctive of the microblogging nature (Crowdflower, 2017). Additionally, these platforms of-fer the possibility of collecting several judgements, made by difof-ferent people, for each tweet, giving a meas-ure of accuracy to each annotation. Tweets with a low accuracy percentage can be filtered out, increasing the quality of the final set of seeds. Seed selection is an important step because it strongly influences the output of the sentiment analysis process.
For the present thesis Crowdflower was selected because it allows a better quality control of the annotations than Mechanical Turks. For example, the user can identify and exclude unreliable annotators based on tests that he or she can design based on the aim of their research project (Nakov et al., 2016). It also gives a final report including all the annotators that contributed to a specific work and the demographic information related to them. Moreover, the use of Amazon’s Mechanical Turk has been restricted to US residents. Crowd flower is easy to use. The platform provides specific templates that respond to the user’s necessities. It also allows the customization of the task: the user can explain the goal of the research and give detailed instructions to the annotators. As mentioned above, the platform asks for a set of test questions that can be used to evaluate the performance of the annotators. After launching the project, it is possible to monitor the collection of judgements. At the end, the results are automatically compiled, stored and aggregated, if re-quired.
For the assessment of the HCOS, 15.000 tweets were annotated with 2 judgments each using Crowdflower. An additional third judgement was added manually. The annotators first decided whether a tweet was rele-vant or not, and if relerele-vant, put the tweet in one of the three categories: positive, negative or neutral. Only those tweets in which two out of three judgments agreed were used as seeds. The tweets selected as seeds were equally distributed over the three months of the study period (5000 per month). This allowed the in-clusion of a greater range of expressions and vocabulary related to the variation of weather over the months.
Once the seeds were ready, they were used to train the so-called Watson Natural Language Classifier, which is a service offer by IBM. Watson can be trained to learn predefined classes in example texts and then apply those classes to new inputs by using a mathematical approach called deep learning. It can be said that Watson mimics the human ability to classify phrases into categories by understanding the intent behind text (IBM, 2017).
To successfully train a natural language classifier, each text value and class in the training data must represent the kinds of texts and classes that the classifier is expected to predict. Moreover, the classes that are associ-ated with each text must be correct. Finally, the more training data, the more accurate are the results. Con-sequently, the trained classifiers can be only as good as the training data.
The main reason Watson was selected for this thesis was that it allows the creation of natural language classifiers without prior knowledge in machine learning. The input of the service is the training data and the outputs are the corresponding classification and the associated confidence levels. Also, Watson works best with short texts, which makes it perfect for tweets analysis, and it can also be trained for a specific domain.
27 | P a g e
Four different classifiers were created and trained. One included the whole season under study (autumn), while the other three included only one month each (September, October, November). The reason behind this choice was to evaluate the accuracy of them, compare the results and then select the most accurate alternative.
The autumn classifier was initially trained with the high accuracy seeds obtained from Crowdflower. Then an additional set of seeds was added to complete the 150000 that Watson permits. The monthly classifiers, on the other side, were fed with only 5000 seeds each. Tweets from September were used to feed the September classifier, Tweets from October were used to feed the October classifier, and so on.
Finally, the autumn classifier was used to classify the rest of the data because of its higher accuracy (90 %), since the monthly classifiers, altogether, were less accurate (86 %).