Implementation aspects of data visualization based on
map of attributes
Tomasz Rzeźniczak
Institute of Computer and Information Systems, Faculty of Cybernetics, Military University of Technology, Poland
Abstract: The aim of this study is to present an original data visualization method with greatest focus on selected aspects of its implementation. The proposed method is designed for visualiza-tion of multidimensional data sets consisting of objects described by nominal attributes. The goal of the visualization is to facilitate objects recognition and remembering based on hu-man perceptual capabilities. The expected result for a given input data set is a two-dimensional map of all attributes. Arrangement of the attributes on the map allows visuali-zation of individual objects as, so called, good figures. The study is focused on the algo-rithm, which searches for the optimal maps; implementation aspects and overall complexity of the problem are also explored.
Keywords: data visualization, graphical language, structural information theory, figural goodness
1. Introduction
Human natural capabilities predestine us to process visual forms very fast and accurate. Therefore, visualization is heavily leveraged for data analysis in various domains of life. Over the years, a number of data visualization methods have been constructed. Different types of charts, suitable for tabular data and mathematical functions visualization (for in-stance: line chart, bar chart, pie chart, etc.) are among the most popular. For more specific purposes other methods were built such as: cartograms for presenting data in the geographic map context, treemaps applicable to visualize tree structures or techniques that cope with multidimensional data: Parallel coordinates, Scatterplot matrix, Reordable matrix, Spi-derweb chart, Glyphs [22].
There is no doubt that visualization is a powerful tool - but only when it is used correct-ly. Selecting among known or constructing a new visualization technique is not a trivial problem. To find a good technique for presentation of some data set, one must take into count all the aspects related to human perception. Only such an approach can guarantee ac-curacy of interpretation, its speed and presentation simplicity - all of these are very important considering the overall effectiveness of visualization [16, 21]. These are also sig-nificant parameters for this study.
leveraging human perceptual capabilities and incorporates use of data characteristics in the design process.
Recognition is a major activity for any process of diagnosing. Mostly, data over which diagnosis is conducted is a set of abstract characteristics that only analyzed together can produce certain value. A process of medical diagnosis can be an example here. Physicians collect symptoms and other information from many interviews and physical examinations. In the next step, they evaluate all the data and try to identify the initial diagnosis. Very often large amount of medical data and possible diseases is difficult to analyze. This is a natural place where mentioned data visualization method can be applied in order to facilitate the diagnosis process. The collected symptoms can be treated as attributes of a visualized ob-ject. The object in this case reflects a potential diagnosis, thus the recognition process can be supported.
Further discussion will concern the idea behind the proposed visualization method. I will also define a basic algorithm and issues which need to be solved.
2. Background definitions
First of all, in order to describe the proposed method, it is necessary to briefly define basic concepts of graphical language and encoding convention, which originate from re-search on automatic design of graphical presentation [16, 21]. According to pioneers in this area,graphical languageis a way of describing how a graphic corresponds to an input data.
An optimal graphical language for a given data type is selected from a defined design space. The design space of graphical languages can differ significantly, for instance Mackinlay used only a limited set of so called primitive languages and composition opera-tors which allow producing alternative languages based on primitive ones like: line chart, bar chart, tree, vertical/horizontal axis, color, size, shape, etc [16]. Other approaches, like first-principle of M. Schiff [21], defined deep decomposition of the design space. In Schiff's model instead of primitive languages there are primitive graphical objects: lines, arrows, circles, rectangles, etc., which altogether give larger design space.
Furthermore, first-principle method also developed the notion of encoding convention. Schiff leveraged perception model similar to Lohes and Pinker's and on its basis distin-guished two subsequent steps in graphical presentation understanding: perception and inter-pretation [14, 15, 18, 21]. According to Schiff, the successive levels of presentation description are: graphical description, perceptual description and cognitive description. The lowest level description of presentation is based on the mentioned earlier primitive graphical objects. During the perception step, graphical objects are identified and the perceptual de-scription is built. Next, the interpretation step occurs and the cognitive dede-scription is con-structed. A cognitive description can be seen as a mental representation of information found in a presentation, while the presentation itself is a graphical description level. In this context, encoding convention defines the transition from one level of description to another for a given type of data. Therefore, design of a presentation can be also divided into two dif-ferent tasks. The first one is representationtask, where the input data set is transformed to a perceptual description [21]. The second is layout task, when it is decided how the perceptual description is transformed into actual graphical objects, its proprieties and most importantly – layout.
more interesting for the presentation design. Precisely, a data instance will be modelled as a set of objects O and a set of possible domain attributes A, where each object x∈ O is defined as x⊆ A.
The encoding convention proposed here is aligned to the above data definition. It speci-fies the subsequent description levels and systematic method of mapping them. The descrip-tion levels:
• cognitive level - a set of objects O; a set of possible domain attributes A; each object
x∈ O is defined as x⊆ A;
• perceptuallevel – perceptual objects are: points, lines and figures;
• graphical level – dots and lines on a square grid/map of n equal cells, where n is a number of different attributes in the set A; each cell represents a different attribute and dots can be placed only inside a cell; each line connects two different dots.
The mappings:
• cognitive level ↔↔ perceptual level (representation task) – ↔↔ each attribute of a
cognitive object x is represented by a single point on a plane; all points that belong to one object are connected by lines, so the whole object creates a closed polygon;
• perceptual level ↔↔↔↔ graphical level (layout task) –each point of the perceptual level
is represented by a single dot on the grid; each line is represented by single line drawn between dots; polygon constructed this way forms good figure [ 9, 17].
An example presentation generated using the encoding convention can be found on Fig. 1.
Figure 1. An example of object visualization – generated by the implementation of the proposed en-coding convention
interpretation, its speed, presentation simplicity or any other characteristic related to human perception. Thus, the layout task becomes a separate problem for each input data set in-stance, so it is treated differently then representation task and engages automated processes for solving the issue, what will be elaborated further in the article.
3. Encoding convention justification
There are at least several arguments, originating from the data type characteristics, sup-porting the encoding convention.
First of all, objects are described by nominal attributes, which means that they are only named values. There is no defined order and no arithmetic operations are possible [23]. The only thing that can be done over nominal values is comparing them with other nominal val-ues. This implies that standard techniques of visualization such as line charts, bar charts, etc. are hard to apply.
Secondly, human perception is better equipped for some tasks than the other. Mackinlay proved this measuring effectiveness of perceptual task required by different graphical lan-guages [16]. Mackinlay prepared a ranking (Tab. 1) of perceptual tasks' efficiency depend-ing on the type of graphical encoddepend-ing. Mackinlay's rankdepend-ing includes quantitative, nominal and ordinal data types. Looking at the ranking, it can be noticed that determining a position of graphical object is most efficient for all the data types including nominal. It is clear, that the use of space is the most significant aspect of visualization. Space is treated in a particu-lar way in relation to other image attributes – it is the basis, on which other elements are dis-tributed [2]. Following Card and Mackinlay, the empty space of an image is a container with a metric structure that can be described by axes [2]. For the nominal data type, axes are cov-ered by regions divided into subregions. Considering the above arguments, realization of the representation task by leveraging the use of arbitrary location in space to exhibit attributes of an object, as it is proposed in this study, is well justified.
Table 1. Mackinlay's ranking of perceptual tasks efficiency − from the most to the least efficient [16]
Quantitative Ordinal Nominal
Position Position Position
Length Intensity/Value Colour (hue)
Angle Colour (saturation) Texture
Slope Colour (hue) Connection
Area (Size) Texture Containment
Volume Connection Intensity/Value
Intensity/Value Containment Colour (saturation)
Colour (saturation) Length Shape
Colour (hue) Angle Length
Texture Slope Angle
Connection Area (Size) Slope
Containment Volume Area (Size)
Shape Shape Volume
At this point, we come to the “dynamic part” of the encoding convention - the layout task. The effectiveness of layout construction is going to be achieved by application of figu-ral goodness concept [9, 17]. The main characteristics of good figures are regularity and simplicity in contrast to bad figures which are complex and poorly organized. In conse-quence of this, humans process good figures more efficiently. It is proved that people re-member, match, learn and describe good figures much better than bad figures [4]. The hypothesis that simplicity has a positive influence on perception of shapes by improving the performance of visual matching and recognition was formulated by Donderin [3]. Studies conducted by Kayaert and Wagemans confirmed that simplicity in general and symmetry in particular enhance the recognition of unfamiliar shapes [10]. Since the goal is to achieve effective identification and remembering of cognitive objects, the layout task can be boiled down to represent them as good figures. The figures are formed of points and lines on the map representing their attributes. Each cell of the map is assigned to a different attribute, so changing the position of the cell influences all object's representations. Therefore, the chal-lenge is to find optimal cells arrangement, so as to produce good figure for each object rep-resentation.
There are additional questions regarding this method of visualization that need to be considered. It can be expected that looking for an optimal map for some realistic data set may lead to the same figures for different objects (or very similar figures which differ only in size). In some cases this may be a drawback of the method that in consequence reduces the recognition performance. This unwelcome effect can be omitted introducing additional constraints on the search algorithm, which would prevent equal polygons’ shapes in a final solution. However, even in the basic form of the method (no constraints on similar shapes) the solution can be acceptable, because of several reasons.
If two objects share the same shape and they have nothing in common (no common at-tributes), they will be located in different places on the map. The figure’s position is an ad-ditional factor supporting recognition. The efficiency of leveraging position for perceptual tasks was already mentioned in the context of attributes representation, but it is also relevant for whole figures. Another aspect is a partial similarity of two figures. If there are figures that have identical parts (and the same position on the map) it obviously means that repre-sented objects have shared attributes, this presentation effect is very important because it is consistent with natural human perception of similar objects.
4. Algorithm overview
Summarizing the earlier description, the problem which is developed in this study con-cerns building a graphical representation of each object x from a given data set O. The rep-resentation must facilitate remembering and recognition of this objects as well as extraction of their characteristics. The adopted approach is based on proposed encoding convention. The representationis fixed and the layoutengages automated processes for solving the prob-lem of optimal map's cells arrangement.
Basic algorithm proposed here to solve the layout task consists of the following steps. First of all, it is necessary to be able to generate all the potential maps. Then each of the generated maps must be evaluated on how good the objects' representations are. To evaluate one map, visual representation of all the objects must be checked. Since, only the sum of evaluations of individual objects gives overall assessment of the map.
Table 2. SIT encoding rules: Iteration, Symmetry, Alternation (ISA-rules) [8]
Rule Symbol sequence Code
Iteration aaa...aa m*(a)
Symmetry abcdcba S[(a)(b)(c),(d)]
Alternation abacad
bacada
<(a)>/<(b)(c)(d)> <(b)(c)(d)>/<(a)>
This is the primary flow of the control inside which more complex steps related to eval-uations of a single figure are conducted. This includes determining the actual shape of an object, which is required, because points representing attributes of the object can be con-nected by lines in many different ways. The only assumption here is that they form a poly-gon.
Having determined shape of a figure, it is possible to evaluate its figural goodness. The figural goodness assessment is based on Law of Praegnanz [11]. According to this law pre-ferred interpretation of a shape corresponds to the simplest description of this shape. Fur-thermore, human vision encodes shapes optimally by the use of regularities found in a particular shape, like: symmetry and repetition, each regularity means less information needed to encode figure's description [1, 9]. The complete pattern perception theory, that clarifies also a model of figural goodness evaluation, is Structural Information Theory (SIT) introduced by Leauwenberg [12]. SIT is heavily used in the algorithm presented in this study. The evaluation model is composed of three steps [7, 8]:
1. Transformation of 2D visual pattern to 1D sequence of symbols (any kind of symbols, e.g. characters)
2. Reduction of the encoding of 1D sequence by application of encoding rules (ISA- rules) defined in SIT (see Tab. 2).
3. Calculation of information load (complexity metric) for the reduced code [7].
The main problem of the whole algorithm is the computational complexity. Naive solu-tions for most of the steps have exponential complexity. Starting from maps, a number of possible maps (different cells' arrangements) is n!, where n is number of attributes in the set A. It should be mentioned here, that only square maps are considered. Manipulation of the number of rows and columns in maps would be additional unwelcomed factor, increasing the search space. Considering that this is irrelevant for the main ideas, it is omitted and only square maps will be discussed.
Figure 2. The overview of the algorithm of search for an optimal map.
Determining the shape of an object for a given map has similar complexity. Theoretical-ly, each point representing attribute can by connected to any other point, which for k attrib-utes gives k! different shapes. Moreover, using SIT model of encoding requires recursive search for regularities, which causes a combinatorial explosion of possible minimal codes [7, 5]. In the next sections approaches and methods adopted to solve the above issues will be presented.
4.1. Figure constructing
As Structural Information Theory is a representation theory and not a process theory, it does not specify how to obtain a 1D sequence of symbols from a 2D visual pattern [8]. De-termining shape of a figure given a set of dots on a map is a separate complex task.
First of all, it is necessary to guarantee that 2D regularities remain in 1D encoding. For this task, the spatial contiguous condition introduced by Tujil and Leeuwenberg is being ap-plied [24]. Spatial contiguity means that the dots in the 1D sequence should be given in a spatially contiguous order. To construct the polygon and fulfil the above condition set of dots is considered to be a set of vertexes in a graph, which is complete and planar (a path between each pair of vertexes exists and there are no intersections between edges). Each edge represents straight line with assigned weight equal to Euclidean distance between dots connected by the edge. The interesting polygon is defined by shortest Hamilton cycle in this graph [8]. In such a case the searched sequence of 1D symbols corresponds to the sequence of dots/vertexes in the cycle. At the same time vertexes in a contiguous subgraphs form spa-tial contiguous elements of the figure.
A polygon constructed by this method has the lowest circuit, it can have also the lowest complexity of all possible polygons for given dots, but there is no proof. Only checking complexity all the polygons could ensure this. This is note possible from the computation time perspective. However considering that the same technique is applied to all objects equally and that the complexities of polygons are being measured later in the algorithm (in the Code Reducer component), this is assumed to be good enough heuristic for the purpose of determining shape.
Having solved the task of figure determination, the next step is to choose a method of encoding 1D sequences. The method must allow easy detection of regularities. A most natu-ral method for encoding of 1D sequence would be writing down coordinates of cells corre-sponding to consecutive dots. However human regularity perception does not operate by means of isolated numbers, but rather by relationships among figure elements like compar-ing sides or subsets of sides. Therefore, this simple encodcompar-ing would enforce additional cal-culation when looking for regularities, for instance calcal-culation of sides’ length. That is why the algorithm uses so called contour code [7]. Contour code encoding, which directly incor-porates all the necessary characteristics, is a method facilitating regularities search. Contour code is built by following sides of a figure and angles between them. In this notation the se-quence of dots coordinates is replaced by length of segments between them and size of an-gles connecting segments. An example of contour code for trapezoid is presented on Fig. 3.
Figure 3. The figure of trapezoid with labelled sides and angles. 1D sequence could be: aebeadcd, and after applying ISA-forms: S[(a)(e), (b)]S[(d), (c)].
This engine is based on a hybrid algorithm using GA and heuristics for rapid solution of TSP. One of the reasons of good results is probably that the algorithm immediately ex-cludes all path crossings - which in this case are equal to polygon sides intersecting.
4.2. Minimal code
SIT allows comparison of efficiencyof different figures. This is achieved by calculation of figural goodness for a given shape. Let's consider now the method implemented in Code Reducer for assessing goodness to a given contour code.
The ISA-rules can be applied to the contour code in many different ways, resulting in different codes. The only requirement is that a code should be reversible, so it is possible to reconstruct an original code and consequently an original figure. However, codes are not equal, because they reflect different number of regularities. As it was mentioned, preferred perceptual interpretation of a figure corresponds to the simplest code [6], which is called a minimal code. Comparison of codes is based on the information load metric, a minimal code has also the lowest information load. In this algorithm, information load is calculated as a number of symbols that remain in a code [7]. Below are examples of different codes, its minimal codes and information loads:
• ababab ↔ 3*((a)(b)) : inf. Load = 2 • abcdcba ↔ S[(a)(b)(c),(d)] : inf. Load = 4 • abacad ↔ <(a)>/<(b)(c)(d)> : inf. load =3
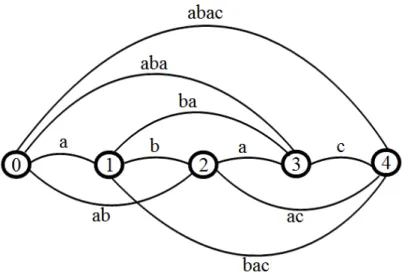
To explain the complexity of finding minimal code, let's consider a graph representation of an example sequence abac, drawn on Fig. 4 [7]. Each edge corresponds to one subse-quence of the initial sesubse-quence. The number of different paths in such graph is equal to 2N-1, where N is the number of symbols. Each of the paths in this kind of graph can potentially give a minimal code. Searching for a minimal code can be transformed to searching for the shortest Hamilton path in weighted graph, where the weights are equal to information load of subcodes associated to edges. A code of length N gives N*(N+1)/2 different subcodes of length 1 to N, for which information load needs to be calculated. If we found the covering of ISA-rules for all the subcodes and calculated all the necessary information loads, the first part of the task can be solved by Dijkstra's shortest-path method [5].
However, finding the ISA-forms covering for all the subcodes is a much harder problem. This is actually a recursion of original problem for subcodes.
Taking into account definitions of ISA-rules, computational complexity of encoding subcode of length N is as follows [5]:
• I-forms covering – O(Nlog(N));
• S-forms covering – O(2N);
• A-forms covering – O(N2N);
adding O(log(n)) recursion steps, overall complexity of naive algorithm would be superex-ponential O(2Nlog(N)). This is obviously not acceptable.
Code Reducer uses hyperstring concept proposed by Peter van der Helm [5]. Detailed description of hyperstring is beyond the scope of this paper, so I will introduce only the general idea. Hyperstring is a special kind of distributed representation which allows trans-parallel processing. This means, that it allows searching for regularities in up to 2N sub-codes as if one subcode of length N would be considered. With the application of transparallel processing approach for minimal code, Code Reducer achieves acceptable complexity of O(N3+logN).
The Java implementation of Code Reducer uses a free Java library JgraphT that provides many graph-theory algorithms, among them also Dijkstra's shortest-path implementation [26].
4.3. Map selection
Code Factory and Code Reducer allows comparing complexity of figures and conse-quently assessing a map. These components can be seen as necessary tools for solving the main problem. Many alternative algorithms for finding the optimal map problem can be constructed based on them. Since, the goal of the first implementation of Map Factory was to validate the overall idea and mentioned components, so only the simplest – naïve, algo-rithm was implemented.
Map Factory generates a sequence of all possible maps for a given set of attributes A and each of generated maps is evaluated. As it was mentioned earlier, only square maps are con-sidered. Square maps bring a certain consequence that can be used to narrow the number of maps for evaluation. A map and some of its rotations are the same from our perspective. Removing maps corresponding to the rotations of 90, 180, 270 degrees reduces the search space to one-fourth of the initial one. However this is still very small yield considering the factorial number of all possible maps.
From the technical side, a permutation generation algorithm is used for the construction of subsequent maps [19]. Each permutation reflects an ordered list of attributes which then is transformed to a map. Used approach of trying all permutations/maps and checking which one is optimal is the most direct solution, but the running time for this approach has a poly-nomial factor of O(n!), where n is a number of attributes in the set A. This brut force search method is unpractical even for 16 attributes, which is equal to a 4x4map. The running time of the algorithm assuming that it is able to verify 1000 maps/second (which is a very opti-mistic assumption) would be approximately 600 years, therefore it can not be used for real data set where hundreds of attributes can be expected.
of single object as well as characteristics of subsets of objects. At least a couple of strategies and rules that could contribute to reducing computational complexity by finding a close to optimal solution appear. The examples are:
1. Object's set clustering – clusters of objects which have the most common attributes can form partitioning of the set of objects as well as the set of attributes. The attribute's subsets would contain all the attributes occurring in the objects belonging to one cluster. This way the main problem would be divided into a set of autonomous problems. The final solution would have to be assembled of all of these separately solved subproblems. 2. Attribute's set clustering – identical groups of attributes, which repeat among
descrip-tions of many different objects, can be used to find for them a good figure separately. These clusters and corresponding good figures could be then fixed elements while searching for a final map.
3. Sequentially extending the solution – algorithm would construct a map step by step, starting from finding a good visual representation of a single object (this also places the object's attributes on a map) and then adding next object's visualizations until there is no more object in the data set.
Effectiveness of mentioned strategies is not proven. This will be a subject of experimental verification. However they can provide substantial acceleration of the process. Application of heuristic methods seems to be very reasonable. Obviously, this approach does not guaran-tee finding an optimal solution, but any close to optimal solution can be good enough for the visualization goals.
5. Summary
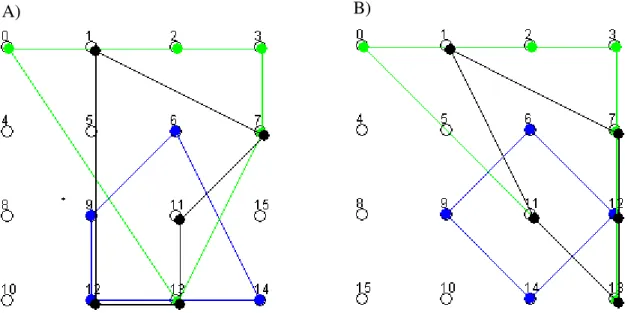
At this point in time, none more efficient approach than sequential search through all possible maps has been yet developed, so the basic method was implemented and used for the initial evaluation of the algorithm’s components, namely: Code Factory and Code Re-ducer. The implementation proof of concept has been run on several random data sets. The data sets constraints were as follows: 16 attributes, 3 objects, each with minimum 4 and maximum 5 attributes. Figure 5 presents screenshots taken from selected steps of running the program. In this example, objects are visualized on two different maps representing two different iterations of the algorithm. For the purpose of clarity, the objects are drawn in dif-ferent colours, and dots representing the same attributes are shifted relative to each other (otherwise presenting all objects in one picture would be not readable because of overlap-ping lines and dots). The aggregated information load for map A is 23 while for map B it's only 14, what is easily noticeable and reflected in the regular shapes of objects' representa-tion. The implementation was enough to evaluate correct work of the components, but is obviously not enough to find a final solution even for 4x4 map, therefore no real data result can be presented yet.
Summarising, this paper presents an original method of multidimensional data visualiza-tion and focuses on the implementavisualiza-tion issues. The method is based on the use of human perception capabilities in the process of designing graphical representation of objects from an input data set. The intended effect of the algorithm is a common map of attributes, where visualized objects are represented as polygons which vertices correspond to objects’ attrib-utes.
visual-ized - if there is only part of information about attributes of some unknown object, visuali-zation of such partial data may also help identify the object [13].
The method was designed for specific type of multidimensional data. Although in its basic form the attributes are expected to be nominal, it may be in the future extended to handle ordinal and quantitative data types as well. An exemplary extension can be intro-duced using additional visual variables to represent attributes on the map. For instance in-stead of simple dots the attributes can be presented using different size, colors, shapes, textures, etc., in accordance with the Mackinlay's ranking (Tab. 1). This approach signifi-cantly extends the applicability of the method.
Figure 5. Screenshots taken from the program. The aggregated information load for map A is 23 for map B it's only 14, this difference is easily noticeable in the figures' shapes.
From the implementation perspective, the main issue is obviously the search space of order n!. The computational complexity of the naive algorithm is unacceptable. Therefore, further work is going to be focused on building more efficient approach. One of the charac-teristics of the method is that visualization is constructed specially for a particular instance of data. In this regard, use of available information about data in heuristic methods of search for optimal map seems promising.
References
[1] Attneave, F.: Some informational aspects of visual perception, Psychological Review, 61, pp. 183-193, 1954.
[2] Card, S., Mackinlay, J., Shneiderman, B.: Readings in information visualization: using vision to think, Morgan Kaufmann Publishers, San Francisco, 1999.
[3] Donderi, D.: Visual complexity: A review, Psychological Bulletin, 132, pp. 73-97, 2006.
[4] Garner, W.: The processing of information and structure, MD: Lawrence Erlbaum Associates, 1974.
[5] van der Helm, P.: Transparallel processing by hyperstrings, Proceedings of the National Acade-my of Sciences USA, 101 (30), pp. 10862-10867, 2004.
[6] van der Helm, P., Leeuwenberg, E.: Accessibility: A Criterion for Regularity and Hierarchy in Visual Pattern Codes, Journal of Mathematical Psychology, 35, pp. 151-213, 1991.
[7] van der Helm, P., Leeuwenberg, E.: Avoiding Explosive Search in Automatic Selection of Sim-plest Pattern Codes, Pattern Recoqnition, Vol. 19, No. 2, pp. 181-191, Pergamon Press Ltd.,1986.
[8] van der Helm, P., Leeuwenberg, E.: Goodness of Visual Regularities: A Nontransformational Approach, Psychological Review, Vol. 103, No. 3, pp. 429-456, American Psychological Asso-ciation Inc., 1996.
[9] Hochberg, J., McAlister, E.: A quantitative approach to figural goodness, Journal of Experi-mental Psychology, 46, pp. 361-364, 1953.
[10]Kayaert, G., Wagemans, J.: Delayed shape matching benefits from simplicity and symmetry, Vision Research 49, pp. 708–717, 2009.
[11]Koffka, K.: Principles of Gestalt psychology, New York: Harcourt, Brace, 1935.
[12]Leeuwenberg, E.: A perceptual coding language for visual and auditory patterns, American Journal of Psychology, 84(3), pp. 307-349, 1971.
[13]van Lier, R., van der Helm, P., Leeuwenberg, E.: Integrating global and local aspects of visual occlusion, Perception, 23, pp. 883-903, 1994.
[14]Lohse, G.: A cognitive model for the perception and understanding of graphs, The University of Michigan dissertation, 1991.
[15]Lohse, G.: A cognitive model for the perception and understanding of graphs, Human-Computer Interaction, 8(4), pp. 353–388, 1993.
[16]Mackinlay, J.: Automating the Design of Graphical Presentations of Relational Information, ACM Transactions on Graphics, Vol. 5, Issue 2, New York, USA, April, 1986.
[17]Palmer, S.: Vision Science : Photons to Phenomenology, MIT Press, 1999.
[18]Pinker, S.: A theory of graph comprehension, Artificial intelligence and the future of testing, Lawrence Erlbaum Associates, 1990.
[19]Rosen, K.: Discrete Mathematics and Its Applications, 2nd edition, NY: McGraw-Hill, pp. 282-284, 1991.
[20]Saiko, D.: Traveling Salesman Problem – Java Genetic Algorithm Solution, [online], 2005. [21]Schiff, M.: Designing graphic presentations from first principles, Doctoral Dissertation,
Univer-sity of California, Berkeley, 1998.
[22]Siirtola, H.: Interactive Visualization of Multidimensional Data, Dissertations in Interactive Technology, Number 7, 2007.
[23]Stevens, S.: On the Theory of Scales of Measurement, Science, 103 (2684), pp. 677-680, 1946. [24]van Tuijl, H., Leeuwenberg, E.: Perceptual interpretation of complex line patterns. Journal of
Experimental Psychology: Human Perception and Performance, 6, pp. 197-221, 1980.
[25]Wertheimer, M.: Gestalt theory, A sourcebook of Gestalt psychology, 1-11, New York: The Humanities Press, 1924/1950.
![Table 1. Mackinlay's ranking of perceptual tasks efficiency − from the most to the least efficient [16]](https://thumb-eu.123doks.com/thumbv2/123dok_br/16331342.188219/4.892.199.719.741.998/table-mackinlay-s-ranking-perceptual-tasks-efficiency-efficient.webp)
![Table 2. SIT encoding rules: Iteration, Symmetry, Alternation (ISA-rules) [8]](https://thumb-eu.123doks.com/thumbv2/123dok_br/16331342.188219/6.892.154.763.444.547/table-sit-encoding-rules-iteration-symmetry-alternation-rules.webp)

![Figure 3. The figure of trapezoid with labelled sides and angles. 1D sequence could be: aebeadcd, and after applying ISA-forms: S[(a)(e), (b)]S[(d), (c)]](https://thumb-eu.123doks.com/thumbv2/123dok_br/16331342.188219/8.892.340.589.786.959/figure-figure-trapezoid-labelled-angles-sequence-aebeadcd-applying.webp)