M
ESTRADO
M
ASTER IN
E
CONOMICS
T
RABALHO
F
INAL DE
M
ESTRADO
D
ISSERTAÇÃO
E
MPLOYMENT
L
EVEL AND
B
USINESS
C
YCLES
–
D
IFFERENCES
BETWEEN
SME’
S AND
L
ARGE
F
IRMS
’
P
ERFORMANCE
M
ASTER IN
E
CONOMICS
T
RABALHO
F
INAL DE
M
ESTRADO
D
ISSERTAÇÃO
E
MPLOYMENT
L
EVEL AND
B
USINESS
C
YCLES
–
D
IFFERENCES
BETWEEN
SME’
S AND
L
ARGE
F
IRMS
’
P
ERFORMANCE
B
ERNARDO
M
ASTELING
P
EREIRA
ORIENTAÇÃO:
P
ROFESSORD
OUTORM
ÁRIOG
OMESC
ENTENOBernardo Masteling Pereira September 2013
Abstract: Employment level and its fluctuations are historically one of the most discussed topics
in the economic literature. This study focuses on the differences in employment’s sensitivity to the business cycle, existent between small and medium enterprises (SMEs) and large companies in the Portuguese economy. Which group of firms presents a more significant reduction in employment level during a recession? And during expansions? Are those SMEs with more fragile business or large firms with more employees? The theoretical discussion is still an open debate, being far from a consensus. The study analyses four major economic sectors - Construction, Retail Trade, Services and Industry between 2000 and 2012. The database is first used for this approach to the labor market and is developed by Statistics Portugal. Regarding the Portuguese economy for the sectors studied, the conclusions are clear, large firms are more sensitive to the economic cycle, regardless of their economic sector, recording more significant employment variations than SMEs. These conclusions call into question some well known ideas about SME’s contribution to the employment variations over the business cycle, opening the discussion on the determinants of these differences between SMEs and large companies’ performance.
JEL Classification: E24, E32, L25, J23
EMPLOYMENT LEVEL AND BUSINESS CYCLES – DIFFERENCES BETWEEN SME’S AND LARGE FIRMS’ PERFORMANCE
Bernardo Masteling Pereira Setembro 2013
Resumo: O nível de emprego e as suas flutuações são desde sempre um dos temas que maior
debate suscita na literatura económica. Este estudo foca as diferenças na sensibilidade do nível de emprego ao ciclo económico existentes entre pequenas e médias empresas (PME’s) e grandes empresas na economia portuguesa. Qual o grupo de empresas que apresenta reduções mais significativas do número de trabalhadores em períodos recessivos? E em períodos de crescimento? Serão as PME’s com negócios mais frágeis ou as grandes empresas com mais trabalhadores? O debate sobre as respostas teóricas é intenso e encontra-se distante de um consenso. O estudo analisa quatro importantes sectores económicos – Construção, Comércio a Retalho, Serviços e Indústria entre 2000 e 2012. A base de dados é utilizada pela primeira vez na abordagem ao mercado de trabalho e é desenvolvida pelo Instituto Nacional de Estatística. No que respeita à economia portuguesa, para os setores estudados, as conclusões são claras, as grandes empresas apresentam maior sensibilidade ao ciclo económico, independentemente do sector de atividade, registando variações do nível de emprego mais significativas que as PME’s. Esta conclusão coloca em causa algumas ideias feitas sobre o contributo das PME’s para as variações de emprego abrindo a discussão sobre os factores determinantes destas diferenças na variação do nível de emprego entre PME’s e grandes empresas.
Classificação JEL: E24, E32, L25, J23
Palavras-Chave: Ciclo Económico, Desemprego, Economia Portuguesa, Emprego, Empresa,
I. Introduction ... 3
II. Background ... 8
II.1 Sensitivity between sectors ... 11
III. Data Characterization ... 14
III.1 Definitions and Concepts ... 14
III.2 Database ... 16
IV. Methodology ... 18
IV.1 Reclassification Bias ... 18
IV.2 Regression Bias ... 19
IV.3 Indices Methodology ... 20
IV.4 Business Cycle Indicators ... 21
V. Descriptive Analysis ... 23
VI. Results ... 26
VI.1 Monthly Analysis ... 26
VI.2 Quarterly Analysis ... 28
VI.3 Results Comparisons ... 30
VI.4 Discussion ... 31
VII. Conclusions & Future Investigations ... 36
References ... 38
I. Introduction
This study is focused on assessing the sensitivity of firms’ employment level to the business cycle. The crucial problem under analysis is the answer to the following question: "Which group of firms is more correlated with the business cycle?", or in other words, "Are small companies with fragile businesses, or large companies with more workers, the ones that reduce more the employment level in times of recession?”. In a period of economic contraction with government spending increasingly restricted and controlled, it is important that economic policies designed to support economic activity and job creation are built with accurate knowledge. There is a widespread perception that small and medium enterprises (SMEs) are the engine of net job creation, however, it is gross job creation that leads the cycle, being fundamental to assure a virtuous employment level in the economy.
Portugal began this century with an unemployment rate close to 4%. At the end of 2012 the unemployment rate reached 17.3%. The average annual GDP (Gross Domestic Product) growth in these thirteen years was residual, only 0.2%. During this period, Portugal experienced three recessionary periods – 2003, 2009 and is now living the third recession period that began in 2011. Also the annual net employment growth rate during the whole period was negative. In 2000 there were 5.060 million jobs1, whereas in the last
quarter of 2012 this number was only 4.531 million jobs2. At the same time the total labor
force grew 5.5%3. In these extremely adverse economic conditions it is important to survey
the variations in employment in SMEs and large enterprises and establish which group is the most sensitive to the economic conditions.
1 Employed population (Series 1998 - No.) - Statistics Portugal, Labor Force Survey 2
Employed population (Series 2011 - No.) - Statistics Portugal, Labor Force Survey 3 AMECO Database – Labor Force Statistics
The study focused on the Portuguese economy, which registers more than one million firms, in which more than 99.9% are classified as SME4. However this group only
represents 77.3% of total employment and 53.4% of the total turnover. The average firm size is less than 3.5 workers for the total economy. Additionally, almost 64% of SMEs are in Retail Trade and Services, while 12.5% are in Manufacturing and 14% in Construction.
The database that underpins this study is provided by Statistics Portugal (Official Bureau of Portuguese Statistics) - Short Term Statistics Unit. There are four economic sectors under analyses: Construction, Industry, Retail Trade and Services. The database covers the period between January 2000 and December 2012 and unlike other studies conducted on this topic it has a monthly frequency.
Since the beginning of the first recessionary period, January 2003, the Portuguese economy observed negative employment changes. Regarding each group of firms, SMEs have relatively stable employment trends, unlike large firms that have significant variability within and between sectors.
The literature conducted on this topic is dispersed. Each study starts from different assumptions, some stress the role of monetary shocks while others are more focused on demand shocks. The period of analyses is also notable different, ranging from only three years to four decades. The covered sectors in the analysis are also an important distinction, as conclusions are in most cases sector specific. Finally, at a methodological level, while some studies consider firm size as a proxy for the access to financial markets, mostly when studying the response to monetary shocks, other focus on the employment level as a variable of interest. Even for classification in large or small firm there is a notable diversity.
4
As a result, only few papers have directly comparable results which create an illusory contradiction in the literature. Two important studies are closely related to the approach followed here - Moscarini & Postel-Vinay (2012) and Haltiwanger et al. (2012). The first concludes that large firms have the higher sensibility to the economic cycle conditions, while Haltiwanger et al. (2012) concludes exactly the opposite, SMEs (with less than five years) are the group with larger correlation to the business cycle.
Why should differences in performance between large and small firms be expected? Can it be explained, in theory, by financial, operational or market characteristics? In terms of financing, larger companies have easier access to necessary financial support when compared to SMEs. This feature is very important not only in recession times but when support to investment is needed. In terms of their operation, while large companies have the necessary flexibility to outsource services and to adjust internally to specific shocks, SMEs do not have that possibility, thus having fewer instruments to battle against economic recession. There may also be differences in terms of market distribution, with a greater share of small and medium firms in sectors with significant domestic business activity, therefore being in worse condition to face an adjustment after a domestic demand shock. Being aware of these differences it is expectable that these two groups of firms have different performances through the business cycle regarding the employment level.
Concerning the consequences of business cycles on employment level there are two important views that can be drawn. At first, the theory developed by Moscarini &
Postel-Vinay (2012), supports that firms tend to recruit unemployed persons due to the lower costs
that this option implies. However, when this reserve ends (full employment), and a firm aims to recruit, higher wages have to be paid to attract workers from less productive firms.
This firm’s policy thereby increases the employment level in larger firms at the expense of small businesses that ultimately maintain their employment level relatively constant. This reasoning assumes that larger firms are more productive, thus able to pay higher wages. In a recessionary period, larger companies have a higher accumulated employment level which they are not willing to save, unlike small businesses that have maintained a stable employment level. Therefore, large firms contribute the most to employment decrease in recession periods. However, a different reasoning can be made based on financial aspects.
Gertler & Gilchrist (1994) argued that large companies, by having easier access to funding
than SMEs are able to make use of new debt to overcome the recessionary period. Small businesses have a much more difficult process ahead them in what concerns the access to financial market, which imply harder consequences to the firms’ activity, including the reduction of employees.
This study uses the Business Turnover, Employment, Wage and Hours Worked monthly indices for each of the four economic sectors mentioned. The first step is to decompose the Employment Index into two indices, for SMEs and large companies, obtaining an index series for each type of firm. To assure a wide scope of analysis there are four business cycle indicators: year-on-year differences in unemployment rate, the HP- - detrended unemployment rate, the real GDP growth and the net employment growth. This is the first study linking these indicators for the Portuguese economy. Following Moscarini & Postel-Vinay (2012) and Haltiwanger et al. (2012), the correlation coefficients were computed between a business cycle indicator and the difference between SME’s and large firms’ employment level year-on-year change rate.
The main conclusion of this study is that large companies are more sensitive to the economic cycle than SMEs. This conclusion is valid for all the four sectors analyzed and confirmed by every indicator used. These results mean that in times of economic expansion, large companies are the most responsible for the positive or less negative change in employment. A key feature to retain is SME’s employment level stability, unlike large companies that registered a large dispersion throughout the sample period.
The whole period was split into two sub-periods, January 2001 – December 2007 and January 2008 - December 2012, though the main conclusions are valid for the two periods. These conclusions go against the established common sense of SME's contribution to business cycle employment variations.
The database used in this study does not allow ascertaining the exact causes behind these employment variations, in particular, the justification for such significant differences between different groups. However, some of the possible explanations have been already addressed. In particular, a more cautious approach by SMEs to the labor market in order to prevent future adjustments due to economic movements that they already anticipate. For large companies the wages above market-payment and the need for structural adjustments promotes the hire (and dismissal) of workers. Moreover large firms are focused on broader markets causing its greater sensitivity to the market conditions. These features cause a greater dispersion in employment changes.
II. Background
The debate about the cyclical sensitivity of employment level in SMEs has been object of discussion over the past decades. Alongside the theoretical view there have been several methodological improvements, in particular in the use of statistical techniques which allowed refining data treatment since the first studies conducted on this topic. As an example of the ongoing debate, Helfand et al. (2007) and Acs & Mueller (2008) presented and discussed several methodologies options. The findings of the studies themselves have evolved as well as the context of analysis. In particular, as the first studies focused mainly on financial and monetary shocks, the most recent studies also approach demand shocks.
There are some seminal articles that are worth to mention in some detail.
Gertler & Gilchrist (1994) started by investigating the importance that the access to
capital markets have in determining the sensitivity of firm’s employment level in a context of a monetary shock. The study uses data for the United States of America in the decade of 1980. Without access to financial firm-level data the authors used the firm size measured by total sales as proxy to assess the capacity to access financial markets.
The reasoning beyond Gertler & Gilchrist (1994) model is based on the transmission mechanisms of monetary policy which regulates the total amount of credit available in the economy. The access to credit determines major investment decisions of any firm, i.e., ceteris paribus, monetary policy has a disproportionate impact on companies without access to financing. This theory is based on the problems of asymmetric and incomplete information, but also on the difficulty of small businesses to seem credible to financial institutions point of view, which is high needed to obtain the necessary funding.
The authors used nominal variables, such as sales and assets, and concluded that small businesses when compared to large firms are the ones that have a more significant decrease in their sales during a negative monetary shock (credit constraint), in other words, small businesses have a higher sensibility to monetary shocks. Nevertheless, the authors restricted their study to the manufacturing sector and the conclusions drawn denote some fragility, such as, the nonexistence for some studied recessions of significant effects in firms’ activity.
Sharpe (1994) employed a similar method as Gertler & Gilchrist (1994) for the
manufacturing sector between 1959 and 1985, by using the number of employed persons as a proxy for financial vulnerability. The author studied the relationship between firm size, aggregate demand and monetary shocks, concluding that small firms made the most use of lay-offs during recessions. Besides, it could be expected that being small firms the ones that fire more employees during recessions that they would compensate it with a higher number of hired employees during expansions, but this study concludes exactly the opposite: large firms hire more rapidly than small firms during economic expansions.
Moscarini & Postel-Vinay (2012) include data from the last forty years (1979-09)
for the United States of America in different economic sectors. They reached surprising results, since they established a strong negative correlation between the economic cycle and the net job creation in large firms. This conclusion disputes previous amount of literature in this topic which indicates a greater sensibility of small businesses to the economic cycle. The authors draw a number of relevant facts from the findings. In particular, large companies destroy proportionally more jobs during and after recessions and create proportionally more jobs during expansions, both in gross and net terms. Moreover, this
pattern is independent of firms’ entry and exit flows along the business cycle, being valid for firms that remain over time. Unlike Gertler & Gilchrist (1994) the business cycle focuses the unemployment evolution and not the monetary policy.
Moscarini & Postel-Vinay (2012) also propose an alternative vision with respect to
the effects of monetary policy on the employment level of large and small firms. Commonly, central banks conduct their monetary policy by the Taylor rule, thus, with the central bank action in the initial period of recession, small businesses will benefit the most from this action. After some periods the economic recovery and the unemployment decrease will originate a sharp increase at large enterprises, without financial constraints, in their activity and consequently in their employment level.
Laying between the vision of Gertler & Gilchrist (1994) and Moscarini &
Postel-Vinay (2012); Chari et al. (2007) take into account both types of recessions, not only those
indicated by the National Bureau of Economic Research (NBER) but also the recessions caused by monetary shocks. The study is based on the relationship between sales and the firm’s assets value. The main conclusion is that in case of an aggregate demand shock, differences between large and small firms are not significant. Nonetheless, small firms are more sensitive to monetary shocks, confirming Gertler & Gilchrist (1994) results.
Sahin et al. (2011) studied the consequences of 2007-09 recession in the United
States of America for firms’ employment level. The authors calculated a 10.4% reduction in firm’s employment level with less than fifty workers (SMEs) and an 8.4% fall for large firms (fifty-plus), thus concluding a larger sensibility of SMEs to economic conditions. This study also focused the main determinants to these performance differences with the use of an inquiry, concluding that poor sales, economic uncertainty and a tightened credit
supply affected in a much larger scale small firms.
In a more recent study, Haltiwanger et al. (2012) analyzed the consequences of the global recession in United States of America’s job dynamics between 2007 and 2009, particularly regarding the size, age and firm location. In fact, the study extends the scope of previous investigations concerning firms’ characteristics and concludes that small and young businesses were the type of firms that suffered the most from the last recession. For instance, a company with less than 20 employees and less than five years reduced its employment growth from 26.6% to 8.6%. In larger and older firms, with more than 500 employees and more than five years, employment growth fell from 2.8% to -3.9%.
II.1 Sensitivity between sectors
Much of the literature focuses Manufacturing’s performances. However, there are other studies that center their analysis on employment’s sensitivity in different sectors to negative economic shocks.
Mian & Sufi (2011) try to explain the incidence of unemployment among sectors, in
the specific case, among tradable and non-tradable goods sectors. Retail Trade and Restaurants were considered non-tradable sector, while Manufacturing was considered as being part of the tradable sector. The study centers its analysis on the fall in employment recorded in the United States of America between 2007 and 2009. The authors conclude that 65% of the decline in employment was due to the fall in aggregate demand. Decomposing this effect, the authors conclude that the breach of employment predominates in the non-tradable sector. This behavior is due to the impossibility of this sector to explore new markets that could compensate the fall in aggregate demand in his home market, and as result achieving a smoother demand fall caused by the initial negative
shock. On the other hand, the tradable goods sector with its ability to find new markets for their products will not be too much affected by the loss of demand in his home market as it can be compensated by new markets. Besides, it as to be taken into account that tradable goods demand is diluted across different markets (states) so that a negative shock in one market has few consequences for the aggregate demand of that sector. That is, states and even firms with significant dependency of non-tradable goods sector are more vulnerable to demand shocks.
Also Moscarini & Postel-Vinay (2012) addressed this issue. They divided the economy into eight sectors Construction, Retail Trade, Wholesale Trade, Services, Manufacturing, Mining, Transport & Communications, Finance & Insurance. They calculated correlations for all sectors between the average unemployment rate of the year before and the difference in growth rates of large and small companies. All sectors showed a negative correlation. Transport & Communications and Finance & Insurance are the sectors with a higher correlation with statistical significance. Mining and Manufacturing are those with lowest correlation coefficients (also with very low statistical significance). These results allowed the authors to conclude that this is a phenomenon that occurs essentially within the sector rather than between sectors.
The closest approach to this topic for the Portuguese economy is made by Centeno,
Novo & Machado (2007). They studied the job creation and destruction in Portugal,
focusing the analysis on the existing heterogeneity between sectors. The authors concluded that job creation and destruction rates are higher in sectors such as Construction and Services, while Manufacturing has lower variation rates. Those job flows are concentrated in companies with lower average salaries, i.e., where human capital have less
importance. Also adjustment costs play an important role in this heterogeneity, being considerably higher in Industry than in Services, so that adjustments become steeper and job creation and destruction rates higher. The job destruction that takes place in companies that have negative adjustments larger than 20% is 84.3% in Industry, 78.3% in Services and 77.3% for the total economy.
Concluding, the question concerning the analysis of firm’s sensitivity to economic conditions is still an open issue. On the one hand, there are authors who prioritize the study of monetary shocks using nominal variables, as Gertler & Gilchrist (1994), on the other hand, Moscarini & Postel-Vinay (2012) focused mostly on demand shocks and take the number of employed persons as the determinant variable for assessing firms’ size. Each study assumes different recession periods, time scopes, methodology options and economic sectors, making comparisons between results very difficult.
III. Data Characterization
III.1 Definitions and Concepts
As it was shown earlier, literature on this topic contemplates various forms of assessing a firm’s size. Indicators such as annual sales, firm’s assets value, employment level or measures resulting from the combination of different indicators are used. In this study, the choice fell on the evaluation of employment level as the determinant of firm size. The basis for this option is provided by several studies. Moscarini &
Postel-Vinay (2009b) identify the number of employees as a main determinant of productivity
which in parallel with employment rate, are the two main determinants in any contract proposal made by a firm, which determines the hiring and firing of employees, meaning that ultimately it defines the firm size.
This option has advantages in minimizing future problems, such as the Reclassification Bias which is linked to the artificial growth of a company, particularly through the effect of inflation on the asset’s value or sales. This topic will be further developed. The option for employment level also allows this study to maintain an important degree of comparability with other studies.
One common feature shared by most studies conducted on this topic is the use of an annual database for the complete universe of companies. In contrast, this study is based on monthly data for a selected sample, representative of the Portuguese firms’ population. This property enables monthly measurement which is useful to detect changes in economic variables at the earliest possible stage, providing a more quickly and detailed analysis and a continuous monitoring of employment level’s evolution, thereby avoiding the existence of biases originated by annual data. The use of an annual database for an infra-annual analysis
requires statistical techniques which incur in an imperfect illustration of reality if compared with the responses of the companies themselves. In general, these adjustments by applying formulas to calculate weights distort the actual values, as in Moscarini & Postel-Vinay (2012) and Haltiwanger et al. (2012).
In this study, four key economic sectors are analyzed – Industry, Services, Retail Trade and Construction. Monthly Turnover and Employment Indices are produced by Statistics Portugal through a survey, framed by European Statistical System coordinated by EUROSTAT. A firm’s answer includes the total number of employed persons5, without
subdivision by establishments6.
The database starts in January 2000 and goes through until December 2012. The survey makes use of a sample, which guarantees the representativeness of each sector. In order to assure a high reliability, the sample is renewed every five years allowing the base index year to change. Those modifications imply the entry of new firms, in particular smaller ones. Large companies remain throughout the sample period. Despite these changes there is no break in indices series through the analyzed period.
Nevertheless it should be noted that the sample definition is based upon the firm's background, implying the company existence for at least two years, so that the sample does not include startups. This fact ensures greater continuity of the sample, but limits the study
5 The number of employees is defined as those persons who work for an employer and who have a contract of employment and receive compensation. The definition of persons employed is a wider definition and as well as covering all employees, also includes persons who are engaged in the observation unit during the reference period irrespective of whether they are paid or not. The following groups should be included in the persons employed variable. All paid employees, including: apprentices/trainees (but should only be included if on a contract of employment); paid working proprietors and family members; persons on temporary leave (for example maternity, sickness, leave, strike, lock-outs) for a definite period; part time, temporary and seasonal workers. Unpaid persons employed: unpaid working proprietors (owners); unpaid family workers.
6 This formulation has several advantages. At first, it allows following in a much more realistic way the evolution of the company, by incorporating in its responses automatically additional workers due to a new establishment or factory, thus ensuring that this increase in activity is reflected in the index. The classic example is a large retail trade chain, where it is important to take into account the reality of the company globally and not just each facility individually.
conclusions. Davis et al. (2008), Haltiwanger et al. (2011), Sedlacek (2011) and
Haltiwanger et al. (2012) in their recent studies emphasized the role of firms’ age as
determinant for employment evolution. In this study that factor is isolated, ensuring that employment evolution is not determined by firms’ age. In other words, as strata construction implies data aggregation, by extrapolating the sample values to the firms’ universe it turns the calculation of an “age factor” impossible.
Finally, by using monthly frequency data there are two possible measures for assessing employment variations: monthly change rate and year-on-year change rate. The option fell on the year-on-year change rate, since it ensures greater economic sense in the analysis by avoiding seasonal effects in data interpretation.
III.2 Database
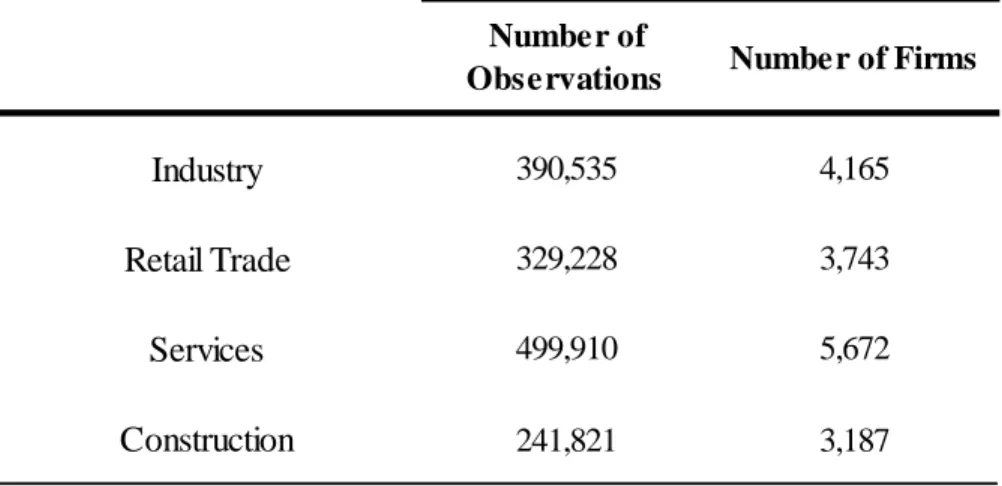
The database used in this study incorporates over one million observations and more than fifteen thousand different firms’ – Table I.
The construction of an index implies the stratification of each firm, for which was used the number of employed persons as criteria, corresponding to the methodology used by Statistics Portugal, framed by the EUROSTAT methodology. Each company is classified into one of the seven strata - Table II. Strata 6 and 7 are considered as those including large firms while small and medium enterprises are included in remaining strata.
Concerning the stratification of each firm, some peculiarities should be noted. First, the allocation of each firm is neither linear nor tight. The initial allocation is made based on a base year reference value, however this allocation is changed whenever any demographic event takes place in a firm structure, for example, in the case of a merger or a spin-off, the company strata is adapted to the new firm situation. There are other cases considered,
particularly when large companies create auxiliary enterprises, for example, to record exports, in this case the company, despite the very small number of workers, is considered in the same stratum as the core enterprise.
The definition of the stratum assumes a key role in this database, by guarantying that the index illustrates in a reliable way the economics’ sector situation. Due to the need of short-term economic indicators it would be impossible to do a monthly collection of data from all companies. This implies a sample selection (NACE code – Appendix 1) for each economic activity and the distribution of each firm to the corresponding stratum. To each stratum is thus associated an extrapolator, i.e., a multiplicative factor applied to the answers of each company. This factor is calculated by dividing the number of firms in the strata’s universe, by the number included in the collected sample for the same stratum. The sum of the extrapolated values allows us to calculate the total of persons employed in each sector.
IV. Methodology
The methodology presented in this study is different from any other applied in a study conducted on this topic. The information presented in each Business Turnover, Employment, Wage and Hours Worked Indices monthly published by Statistics Portugal has never been used before in a study on this topic. Moreover, by recurring to the construction of indices this methodology is unique. However, traditional economic analysis fallacies are still present and need to be resolved, in order to avoid biases that may cast doubt on the conclusions. The two most important fallacies are the reclassification bias and the regression bias. In this section both are explained, along with the solving strategies.
IV.1 Reclassification Bias
The reclassification bias emerges from the business cycle evolution, and is due to the consequences of economic conditions on the increase or decrease of enterprise’s size. The economic cycle has an impact in the natural growth or decline of the company sales or assets. A classic example is the role of inflation on nominal variables. Inflation itself leads to an increase in nominal variables without it actually representing an increase of business activity for the firm. This fact has consequences for economic interpretation which can lead to incorrect firms’ classification, particularly during periods of economic expansion. Moreover, it can lead to a situation in which the growth of a small business is attributed to a higher firm class, thereby causing a data misinterpretation (keeping the intervals unchanged). The opposite effect occurs in cases of deflation. The main consequence of this bias is to create an illusion of pro-cyclical change rates in the evolution of the company size. Since this research focus on these types of relationships it is of utmost
This bias is a recurring problem in economic literature, therefore several ways are already tested to overcome it. One solution is dynamic allocation, which assigns to each size class the corresponding firm growth. For example, a company that grows from 10 to 20 workers; an increase of 5 workers is allocated to the stratum of 10 - 15 workers and the remaining 5 to the 15-30 class. However, also this method is not exempt from reclassification bias. Assigning artificial company’s growth to different classes assumes as valid the firm size evaluation in order to access the relationship between the economic cycle and employment change.
In this study the methodology adopted in the indices construction is based on the definition of each firm stratum’s in a reference period (2005), which considers the company classification as fixed. This solution eliminates the reclassification bias. It is important to notice that it is a flexible definition, as previously explained, for example, in a case of a merger the new firm is considered for an upper tier than the ones existing before.
IV.2 Regression Bias
The regression bias is considered by many economists as one of the most common fallacies in the economic data analysis.7 It arises from a simple aspect of a firm’s activity
but often overlooked and can be illustrated by the following example: companies that went through an adjustment process, as are mergers or spin-offs, will have its development determined by this event. While companies with a positive shock (merger) will have a negative expected growth, companies that experienced a negative shock (spin-off) have a positive expected growth. This means that these firms are only briefly in the situation (size class) in which they are now inserted. Having in both cases trends above the average of
other classified in the same strata, it consequently creates a bias. This bias is also known as regression to the mean bias because the growth of the involved companies tend to their previous average values (before shock) however that return to the average is not immediate, hence the bias. By incurring in this bias, it creates an illusion in cyclically of firm’s growth rates. It is also known as "Galton Fallacy" - the illusion of an inverse relationship between size and growth of a company.
The method used to overcome this fallacy in this study is derived from a unique characteristic of the database. In contrast to what occurs in the remaining literature, a sample database is used in this study. This feature presents itself as a great advantage in solving this type of bias, allowing the control of each firm’s demographic event through the use of statistical mechanisms, such as the change of a firm’s strata or the exclusion from the sample through the transition period, so that it is not taken into account when measuring the economic sector. This mechanism assures a greater consistency of the results.
IV.3 Indices Methodology
The total number of employed persons in an economic sector is obtained by the sum of each stratum that composes that sector. The value of each stratum is the result of multiplying the extrapolator by the value of each firm response. The result is a time series from January 2000 to December 2012 composed by the total number of employed persons each month in each economic sector. This series is the base for monthly indices calculation starting for the base year (2005) whose annual average is equal to 100. After the base year calculation the below indicated formulas were applied, resulting in an indices series for the sample period.
To calculate the base year index (2005 = 100)8, index I for activity k is obtained by
dividing the value of the variable in period t by the annual average :
(1.1)
The index is chained and calculated until December 2012, following:
(1.2)
To calculate the indices until January 2000 starting from the base year followed:
(1.3)
The illustrated methodology applies to the general case. In this study, each index series construction, for SMEs and large firms, adopted the specific data series regarding firm size classification previous mentioned.
IV.4 Business Cycle Indicators
One of the issues that have been subject of debate in economic literature is the choice for the best business cycle indicator. The literature uses several indicators, including the real GDP growth, the net employment growth rate and change in unemployment rate.
Moscarini & Postel-Vinay (2012) used the HP - detrended unemployment rate, based upon
previous studies - Moscarini & Postel-Vinay (2009b) - with the application of Shimer’s (2007) methodology, removing the trend of the variable, by applying the Hodrick - Prescott Filter (HP-Filter) to the time series. The focus is thus on the sensitivity of firms in periods of high or low unemployment and not in recession or expansion periods.
To undergo this evaluation it is important to assess the degree of correlation
between the various options. An important aspect to correlation calculations is to assure the same frequency between variables. Changes in unemployment rate and HP - detrended unemployment rate have monthly frequency, while real GDP growth and net employment growth have quarterly frequency. It should be noted that the correlation analysis period is the entire sample period, January 2000 until December 2012.
The results are presented in Table III. The business cycle indicator with lower correlation coefficients is the HP - detrended unemployment rate, presenting a correlation coefficient of -0.30769 with the annual GDP growth; -0.4961 with net employment growth
rate and 0.5510 with the change in unemployment rate. The low values obtained are the demonstration of the fragility of this indicator as business cycle indicator.
Regarding the remaining indicators, the correlation between real GDP growth and employment growth rate is 0.7782, while between real GDP growth and the difference in unemployment rate is -0.7556. The correlation between the difference in unemployment rate and net employment growth rate is -0.8965. The values obtained are identical to those find by Haltiwanger et al. (2012), justifying a greater emphasis to the net employment growth rate, the difference in unemployment rate and the real GDP growth as business cycle indicators.
V. Descriptive Analysis
In this section are presented the employment variations of each firm’s group. For a better understanding of the performance within each sector, graphic information is shown. First the overall picture for each group of firms is highlighted – SMEs and large firms.
It is visible from Figure 1 that SMEs have a similar trend between sectors, particularly after 2003. However, Construction denotes a sharper employment decrease, with a clear divergence since 2008 indicating a more intense decline that was not followed by the other sectors. Moreover, this sector only had positive year-on-year change rates in the early 2000s. Since January 2003 only Services had positive year-on-year change rates, but for a short period of time and never above 1%. All other sectors registered negative year-on-year change rates for SMEs since 2003. Noteworthy is that Industry never had positive year-on-year change rates throughout the sample period.
Figure 2 illustrates large firms’ variations and point to a complete different scenario. If for SMEs trends are relatively similar, in this case the differences are evident. Not only are there differences between sectors but also differences within sectors. Retail Trade is the sector with the largest variability, while Services and Industry are relatively stable. Notice however that Industry had a positive year-on-year change rate, but only for a few months in 2011 and never above 1%.
The differences between SME’s and large firms’ performance within each sector will be further developed.
Services - Figure 3 - had a relatively stable trend until 2011 however, when total employment entered in a downward trend, employment reductions in this sector registered
a fall of nearly 10% in 2012 both in SMEs and large firms groups. However when comparing SME’s performance with large firms’ there are significant differences, with even contrary (symmetric) movements between large companies (positive variations close to 5%) and SMEs (negative variations close to 5%) between 2006 and 2007. Concerning the sensitivity to the business cycle it is visible that when an upward trend existed, large firms had higher year-on-year change rates. Otherwise, when a downward trend in employment subsisted, the change rates were almost equivalent (2005; 2009; 2011-12).
Regarding Industry - Figure 4 - large firms have more significant year-on-year change rates than SMEs. Remarkable is that the most extended period of recovery for large companies’ employment is simultaneous to a period of several economic difficulties (2010-12). This group had until January 2010 the lower change rates comparing to all other sector for the Portuguese economy. Industry’s large firms become the group with the best performance in 2012. It is noteworthy the high level of employment destruction by large firms in the early years of the decade, far larger than those verified in the SMEs group.
Concerning Construction – Figure 5 - the decrease in SMEs is visible since 2003, maintaining a relatively stable trend until 2009 where both group of firms presented a huge year-on-year decrease in the number of employees, reaching almost a 20% fall in 2012. It is also clear that in this sector employment variations had a greater dispersion in large companies than in SMEs, i.e., in times of employment level recovery, large firms had higher change rates, but this group also had the lower change rates in times of employment level destruction.
In the case of Retail Trade – Figure 6 - large companies had very significant year-on-year change rates between 2005 and 2009, reaching a 7% annual (average) growth. Only
since July 2011 large companies registered negative year-on-year variations, while in the small and medium businesses group this trend begun already in January 2003. The decrease verified since 2011 is slightly higher in SMEs than in large firms. It should be mentioned the stability on SMEs group variations even them being always negative since 2003, (only after July 2011 it stood under -5%). Retail Trade was the economic sector where large firms always had a better performance than SME’s.
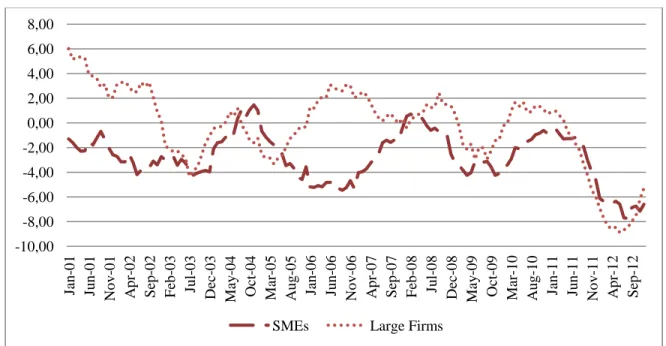
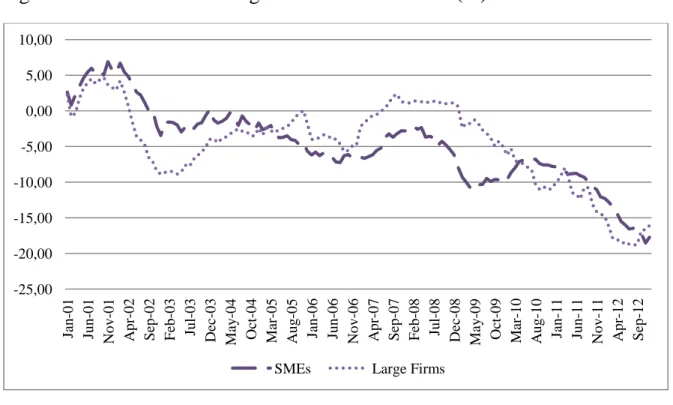
Concerning total employment10 evolution of the four sectors, since 2002 there are
negative year-on-year change rates with an exception of a few months in 2008. Despite the existence of some less negative tendencies they were never sufficient to lead to net job creation – Figure 7 & 8.
10 Indices calculated for the total of the four sectors, without the desegregation into small and medium enterprises and large firms. National Accounts Employment Weights for the base year – 2006. The four studied sectors account for 62.3% of the total economy employment.
VI. Results
As shown in the previous section there are significant differences between and within economic sectors through the sample period that are worth to explore. In this section are presented the results for the correlation coefficients calculations. The time sample is divided into two periods, January 2000 to December 2007 and January 2008 to December 2012, intending to obtain a period of economic stability and a period of deep economic recession.
The correlation coefficient is obtained from the difference between the year-on-year change rate of SMEs and the year-on-year change rate of large firms and the respective business cycle indicator. This methodology option follows the most recent studies on this topic, Moscarini & Postel-Vinay (2012) and Haltiwanger et al. (2012), by focusing on growth rate differentials across firm size groups. It allows highlighting different groups’ variations most clearly. Large firms are used as base group, following Haltiwanger et al. (2012). Due to different frequencies of the economic cycle indicators used, two independent calculations were needed – one taking into account variables with monthly frequency (change in unemployment rate, HP - detrended unemployment rate and turnover index) and other for quarterly frequency variables (real GDP growth rate and net employment growth).
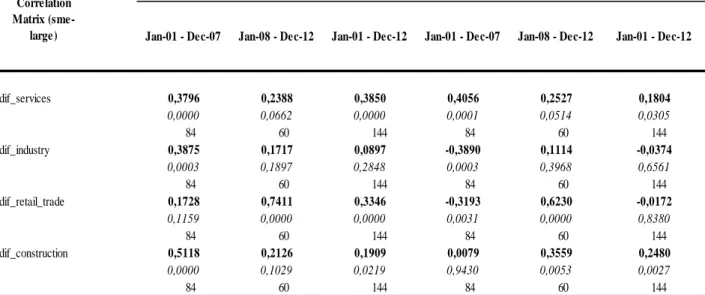
VI.1 Monthly Analysis
Year-on-Year change in unemployment rate is the business cycle indicator that shows the highest significance levels. For this variable a positive correlation coefficient
between SME’s and large enterprises year-on-year change rate, thus implying a higher correlation of large enterprises to the economic cycle.
The coefficient obtained for Services and Retail Trade for the all sample period are positive and highly significant, 0.385011 and 0.3346 respectively, thus showing a greater
correlation of large enterprises to the economic cycle. Noteworthy is still the coefficient obtained for the period started in January 2008 in Retail Trade (0.7411), with large companies demonstrating a very strong correlation with the economic cycle. Industry and Construction have less significant coefficients, yet they all have positive signs showing a greater correlation of large enterprises to the economic cycle – Table IV.
Regarding the indicator developed by Moscarini & Postel-Vinay (2012) – HP - - detrended unemployment rate
-
the results show important differences between sectors that shall be specified. In the case of Services it is visible the reduction from the first period to the second (0.4056 to 0.2527) – confirming the results obtained by the change in unemployment rate – greater correlation of large companies to business cycle. The same applies to Construction for the complete period (0.2480). Regarding Retail Trade it is worth mentioning that there is a huge difference from the first period, -0.3193, (until December 2007) to the second period (since January 2008), 0.6230. In the first period there was a higher correlation of SMEs to the business cycle, however the situation reversed and large firms became more correlated in the second period. Note that Industry does not have significant correlation coefficients, except for the first sample period where the SMEs had a higher correlation with the business cycle. Results are presented in Table IV.To complement this analysis Turnover Indices are used. These indices are also
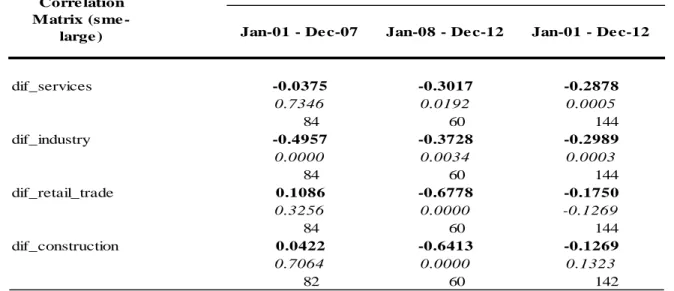
produced by Statistics Portugal following the same methodology as for employment indices and the same firm sample for each analyzed sector. This indicator illustrates the monthly turnover in each sector thus enabling the use as a specific business cycle indicator for each sector – Table V. The results show small correlations coefficients and low significance levels, particularly for the first period (January 2001 – December 2007). The period started in January 2008 shows better significance levels and higher correlations coefficients proving that large firms’ employment level to turnover variations have a more significant correlation than SME’s. Construction and Retail Trade presented the higher correlation coefficients (-0.6413 and -0.6778 respectively). These results prove that large firm’s employment level is more correlated with turnover of each specific sector than SME’s. This aspect, linking aggregate demand to employment level, is important to understand some of the factors that are behind the performances differences. This topic will be further developed.
VI.2 Quarterly Analysis
Concerning quarterly economic cycle indicators – Table VI – note that this feature limits the number of observations and hence the robustness of the results is lower if compared to monthly frequency data.
Regarding the real GDP growth rate, a negative coefficient indicates that economic growth is associated to a decrease in the difference between year-on-year groups firms change rate, i.e., an increase in large firms’ change rate with economic growth and larger decrease in a recession period. In this context, it is worth to highlight the period ended in December 2007 for Construction (-0.5782), to conclude that in this sector large companies have a stronger correlation to real GDP growth than SMEs. In Services the conclusion
already withdrawn from the analysis of monthly indicators is confirmed - larger companies are the most sensitive to the economic cycle (-0.4933). Industry and Retail Trade did not present significant coefficients.
With regard to the net employment growth, the differences in coefficients signs between sectors are remarkable. Services has the largest (negative) coefficient in absolute terms (-0.5640) for the full period. The negative sign indicates that the decrease of the difference between firms’ group change rates is accompanied by a more favorable employment growth tendency. In this case, with a negative coefficient is proves a greater correlation between net employment growth and large firms’ performance.
Note also the coefficient obtained for Retail Trade in the period after January 2008 (-0.7725), which again shows a greater connection between large enterprises and employment growth, in particular when entering into a recessionary period. Industry’s positive coefficient (0.3071) shows a link between net employment growth rate and an increase in the difference between the firms’ group change rates, meaning a more significant positive change in SME’s employment level with economic expansion and the reverse in times of a negative tendency in employment growth. In other words, it implies a greater correlation of SME’s employment level to net employment growth. However it is visible in Figure 4 that the variations of the major Industry companies are greater than SME’s variations. Hence, despite the correlation coefficient indication of SME’s closer performance to the economic cycle, graphic information demonstrates that large companies are more sensitive to economic cycle variations. Concerning Construction, the low significance levels do not allow conclusions to be drawn.
VI.3 Results Comparisons
As previously mentioned and explained there are significant differences between studies conducted on this topic, not only in sample periods but also in what concerns the analyzed sectors and methodology options. Acknowledging this, only few studies have comparable results despite the efforts made in this study to follow the existing literature.
Moscarini & Postel-Vinay (2012) assess annual data between 1977-2006, for the
United States of America, splitting SMEs as those with less than 50 employees and large firms as those with more than 1000 employees. The main conclusion is that large companies destroy proportionally more jobs than small firms. They divided the economy into eight sectors, using only the HP - detrended unemployment rate as business cycle indicator. Reported values indicate a coefficient12 of -0.596 for Construction, suggesting the
same conclusion as for the Portuguese economy (0.2480). For Services the value obtained suggests the same behavior of large firms so as for the Retail Trade (-0.534), which in this study presents an outcome without statistical significance. Industry’s correlation coefficient had not the necessary statistical significance. Moscarini & Postel-Vinay (2012) concluded for all branches of activity, a greater cyclical behavior in large firms. The same conclusion was reached for Denmark’s and Brazil’s economy. One important suggestion of their study is that it is a behavior that occurs mainly within each sector rather than between sectors.
Haltiwanger et al. (2012) includes the firm’s age as determinant variable which
invalidates a direct comparison with this study.13 Again, the study focuses the United States
of America. However, the authors attempt to replicate Moscarini & Postel-Vinay (2012).
12 Moscarini & Postel-Vinay (2012) used SMEs as base group implying that for comparisons the symmetric must be considered.
13
They define SMEs as those with less than 500 employees and large firm as the ones with more than 500 employees. The results indicate a correlation of the difference between SMEs and large firms and the change in unemployment rate of -0.26 but without statistical significance (in this study, the correlation coefficients were all positive for this variable). For the HP - detrended unemployment rate the obtained coefficient was 0.36 (statistically significant) which is close to the coefficients obtained for Services and Construction in this study. The authors also replicated the study with a time scope (1981-2009) similar to
Moscarini & Postel-Vinay (2012) obtaining a correlation coefficient of 0.54 with the HP -
- detrended unemployment rate, identical to the one obtained by Moscarini & Postel-Vinay (2012). Noteworthy is the fact that the simple subtracting of one year to the database causes a substantial change in the results.
VI.4 Discussion
There is a recognized impossibility to use the underlying data to quantify and present in high detail the causes of the differences between SMEs and large firms employment variation. However, it is possible to address this topic by approaching the existent labor market literature - Kahn & McEntarfer (2013) – and by analyzing the Portuguese economy at two different years - 2007 (2.4% GDP growth) and 2012 (3.2% GDP fall).
The labor market analysis approaches two perspectives – labor demand and supply. It is worth to explore some sources of significant employment level variations. The first factor is related to differences in firms’ long-term strategies. SMEs by being aware of their greater fragility are primarily focused on efficiency, productivity and sustainability, while
larger companies place greater emphasis beyond these questions in the need for growth, particularly in periods of economic expansion. These structural strategies differences make the existence of more significant adjustments in large enterprises inevitable, leading to stronger growth in periods of expansion and a sharper decrease in recession periods. This aspect is consistent with the obtained results.
One important question is how aggregate demand variations affect the firm’s structure. There is not a consensus in the economic literature on the evaluation of which type of firm is more sensitive to these changes. However, SMEs maintain a relatively stable structure throughout the business cycle, while large companies seek a structure that suits to the expansion period. By increasing its structure through expansions periods, then in a recession significant employment adjustments will be first happening in large firms. The higher correlation of large firms’ employment level to turnover, previously calculated, supports this theory.
Another hypothesis may be explored. Wage rigidity is often referred as a determinant factor to employment level; in other words, can the reduction of labor costs only be made through dismissals due to the impossibility of reducing nominal wages to most workers? Knowing that larger companies regularly make use of bonus and variable remuneration this hypothesis loses strength since in a case of wage adjustments a large company has the ease to reduce this wage component, contrary to SMEs that do not make use as often of this mechanism. Concluding, wage rigidity cannot be used as a strong argument to justify more cyclical employment level variations in large firms.
Regarding job supply, Moscarini & Postel-Vinay (2012) already addressed in detail those mechanisms. In simple words, large firms by achieving higher efficiency and productivity levels are able to pay higher wages than small firms, particularly in periods of expansion. By presenting more favorable conditions it generates a flow of hires to large companies that attract workers from smaller businesses. However in a recessionary period this flow substantially decreases due to the ongoing adjustment processes in large firms employment level, which unlike the SMEs, have a set of expendable workers accumulated through the expansion period.
On a less significant level it is possible to consider the existence, particularly in smaller firms, of an informal labor market. If existing, it is not accounted in these statistics. This feature may have some impact on the results, because in expansionary periods SMEs may rely on this type of work to satisfy a higher demand and in periods of weak economic activity the company dispenses these workers. Due to the inexistence of a data source that assesses these informal variations, the results may suffer a bias which ultimately proves a more significant variation in SME’s employment level than the initial estimation.
In conclusion, many consistent causes with a more cyclical performance of large firms’ employment level are presented, being its quantification and detailed display dependent on research into new information sources.
Regarding the financial impact on firms’ performance and consequently on its employment level it is important to explore the Investment Survey14 results. This survey
provides information on firms’ financing sources for entrepreneurial investment. The self-
14 Statistics Portugal - The Investment Survey (semiannual) is based on a firm sample with more than four workers and that have a yearly turnover of, at least, €125,000. The firms with 200 or more workers were exhaustively surveyed.
-financing is throughout the analyzed period the primary source of financing, corresponding to 65.2% in 2012. Noteworthy is the significant drop of credit use from 2011 to 2012, around 7 percentage points (pp.), standing at 18.7% in 2012. Other funding sources such as bonds and share markets had a residual use. This financial information shows large firms’ main financing sources more retrench namely bank credit, as the preferred SME’s financing source, self-financing, increases its importance configuring a reason for more significant adjustments in large firms and a more stable trend in SMEs variations.
Differences with 2007 results are significant with regard to economic context but also what concerns firms’ financing sources. Self-financing was once more the most important financing source, however, representing approximately 55% (less 10pp. compared to 2012). Bank credit assumed a more important role standing for approximately 27.5% of total funding (almost more 9pp. compared to 2012). Also bonds and share markets had a greater vitality, being worth approximately twice as in 2012. These features are consistent with the findings of this study, showing a financing market conducive to large firms’ growth. These results contradict a well established fact about SMEs financial vulnerability - Gertler & Gilchrist (1994).
In more operational terms, investment is a determinant factor for a firm’s growth and consequently its employment variations, turning the analysis on the reasons for its (non)existence particularly important. The Investment Survey focuses investment variations by firm size. In 2012 all firm strata showed negative variations, however compared to 2011, companies over 250 employees have the worst performance. With regard to 2007 companies with more than 250 workers had the largest positive changes, over 25%,
Although a common economic context, once again the factors presented are consistent with a greater sensitivity of large firms to financial and economic conditions. This embodied in a proportionally more significant investment reduction for large firms than for SMEs during recessions and a rise in large firms’ investment in periods of economic expansion.
Common to all firms are the factors listed as investment determinants. In the foreground, sales expectations and investment return preview are listed as the most important factors. In a secondary level, interest rate level and future use of the productive capacity are also determinants. This understanding that the most important factors are linked to aggregate demand and not to financial or monetary aspects is an aspect that should be noted.
VII. Conclusions & Future Investigations
This study aimed to investigate the relationship between employment level and business cycle for the Portuguese economy since January 2000 for different groups of firms - SMEs and large companies. Four sectors were studied - Industry, Retail Trade, Construction and Services. Using different business cycle indicators and a monthly frequency database, the main conclusion is that large firms are those with the highest correlation with the business cycle, regardless of their economic sector. However some specific features are worth to mention, large firms in Retail Trade registered the highest year-on-year change rate between 2005 and 2007 while Construction globally achieved almost a 20% fall in 2012. Industry and Construction had relatively similar tendencies within each sector concerning differences between SMEs and large firms. Services sector had the most volatile differences between groups throughout the sample period.
Besides the correlation coefficient analyses the theoretical thinking about the mechanisms behind those differences is also very important. It should be noted that the underlying data does not allow to drawn definite conclusions about those mechanisms, however by exploring the already existent economic literature and some characteristics of the Portuguese economy it turns this analysis possible and plausible. The reasoning is split into two main areas: labor market and financial aspects. The pursuit for growth in large firms enhance employment growth in expansion periods that will mostly imply a downwards adjustment in the future. The fact that SMEs maintain a relatively stable structure throughout the business cycle without too many fluctuations assumes a stable employment level, becoming in some periods independent from the business cycle.
Also the capacity of larger firms to recruit due to higher wages, particularly in expansion periods supports the main conclusion – larger firms are more cyclically sensitive. This performance is also endorsed as financial aspects are analyzed. The data shows that a contraction of credit means is linked to a worse large firm performance. As a crucial employment level determiner, entrepreneurial investment is fundamental for any firm’s development. In general, firms indicated aspects such as sales expectations and investment return preview as crucial to determine investment decisions.
The main conclusions of this study go against a well set of theories about SMEs fragility. Even having more stable tendencies than large firms it is noteworthy that since 2003 there is not net job creation in SMEs. This feature reinforces the need to build public policies that support job creation, particularly in smaller firms.
Nonetheless this study focused a particular angle of the Portuguese economy. There still remains a wide scope for further research about the relationship between business cycle and employment level. The use of micro data would allow exploring the importance of variables, such as firms’ exports and productivity, to the explanation of differences in employment variations between firms’ group. Further, it is meaningful to follow the most recent literature regarding the evaluation of firm age and the role of this factor in companies employment change. Finally, as previously mentioned there is still some uncertainty about the mechanisms that generate the change in firms’ employment level, some factors such as demand and credit conditions certainly play a role, nonetheless a higher level of detail could bring more accuracy to economic studies conducted on this topic.
References
Acs, Zoltan J. & Pamela Mueller (2008). Employment Effects of Business Dynamics: Mice, Gazelles and Elephants. Small Business Economics, 85-100, Issue 1
Centeno, M. & Álvaro Novo & Carla Machado (2007). A Criação e Destruição de Emprego em Portugal. Boletim Económico - Inverno, pp. 79-108, Banco de Portugal
Centeno, M. & Álvaro Novo & Carla Machado (2008). The Anatomy of Employment Growth in Portuguese Firms. Economic Bulletin – Summer, pp. 65-89, Banco de Portugal
Chari, V. & Lawrence Christiano & Patrick Kehoe (2007). The Gertler-Gilchrist Evidence on Small and Large Firm Sales. Mimeo
Davis, S. & John Haltiwanger & Ron Jarmin (2008). Turmoil and Growth: Young Businesses, Economic Churning, and Productivity Gains. Kauffman Foundation Eurostat (2006). Methodology of Short-Term Business Statistics - Interpretation and
Guidelines. Luxembourg: Office for Official Publications of the European Communities.
Friedman, M. (1992). Do Old Fallacies Ever Die? Journal of Economic Literature, vol. XXX, pp. 2129-2132
Gertler, M. & Simon Gilchrist (1994). Monetary Policy, Business Cycles, and the Behavior of Small Manufacturing Firms. The Quarterly Journal of Economics, vol. 109(2), pp. 309-40
Haltiwanger, J. & Ron Jarmin & Javier Miranda (2011). Historically Large Decline in Job Creation from Startup and Existing Firms in the 2008–2009 Recession. Kauffman