Vol-7, Special Issue-Number5-July, 2016, pp119-132 http://www.bipublication.com
Research Article
Study the Relationship between Actual Cost Indices of Health, Variables
of Economic Growth and Oil Revenues in Iran
Batol Ghavidel Lari1, abbas dadras2 and Mohammad Mohebi3
1
.Student Of Insurance Management , Department Of Insurance Management , College Of Humanities, Qeshm Branch, Islamic Azad University,
Qeshm, Iran [email protected]
2.Assistant Professor ,Department Of Management, College Of Humanities,
Qeshm Branch, Islamic Azad University, Qeshm, Iran . [email protected] 3.Assistant Professor , Department Of Economic, College Of Humanities,
Qeshm Branch, Islamic Azad University, Qeshm, Iran . [email protected]
ABSTRACT
One of the approaches to reduce poverty faced by governments is establishment the Social Security System . Present research has been conducted to consideration the relationship between paid health care costs by the people or the share of people for such costs and also , oil revenues and economical development during 1991 – 2012 . Ordinary Least Squares method and Eviwes software has been used in this research .Obtained results of estimating models of this research shows that the increasing in oil revenues and national production has no a significant impact on improving the health situation in Iran.
Keywords: Inflation, Oil Revenues, Medical Costs , OLS
1.INTRODUCTION
It can be said that inflation is one of the basic problems in some countries in the current situation of global economy. For any reason which inflation occurred and if it was higher than the accepted and acceptable of limitation in long-term economic program it will be direct effect on financial relationships between individuals and companies .Also , insurance industry has no any security of various effects of inflationary conditions due to extensive relationship with other economical and social sectors of country . Study the effect of inflation on paid costs by insured is important and if such effect increase along with inflation of insured medical expenses , it will be reduce their welfare and in these conditions, if governments and economical organizations cannot be neutralize the negative impact of inflation on
number of poor people has been increased following by increasing the economical and social expensive caused by economical adjustment programs in two past decades. So , in order to achieve the above goals , there is no way unless the establishing the social security . As the motto Forum International Social Security noted :" Consistent peace will no possible without social justice "( Panahi Bahram , 2007 ) .
This study investigates the relationship between macro – level variables and costs of health care in Iran during 1991 – 2012 period addressed as follows:
First, an overview related to the literature review and then background of studies and studied researches in this area has been explained . Third part of the research has been studied the methodology and statistical analysis . Estimation the methods to convergence procedure has been studied in the fourth part. Finally, in final section , conclusions and suggestions were made. To understand this subject , we intended to study the relationship between inflation and health care expensive in Iran . This chapter will be provide an overview of the research.
2-Literature Review
2-1-Inflation and Factors of Inflation
Serious inflation is considered as taxes for some people and as a kind of financial assistance (subside) for others ( Ketabi , 2002 : 68 ) . One of the most obvious features of inflation is disproportion and coordination between rising prices and income so that the price of all commodities will not increase as same rate. Some commodities have increased intense price and others will faced with a slightly increase price . Likewise increasing in revenues will be different for different groups of society. Intense inflation will be have a high damage on groups who have nominal fixed income (like as governmental employees , workers, wage-earners, retired people and pensioners) and also , it will be benefit to those who have fixed assets such as reserves housing, land, jewelry, antiques, cars, warehouses and other assets . As a result ,
countries which is caused by lack of development in the structure of production. The low efficiency of production is not responsive to the needs of the population. On the other hand , Non – adequate growth of economical sector due to economical structure of country . So that , rapid development of one sector and developments caused by it leads to creation the imbalance between other economical sectors . If the average money supply growth higher than the average growth rate of gross domestic product (GDP), this leads to an imbalance between demand and supply and thus lead to an increase in the general level of prices. Generally , increasing the liquidity was mainly in response to an increase in the monetary base and increasing in monetary base is also caused by increased foreign assets and bank debt to central bank. Imbalance between revenues and government expenses is another causes of inflation in point of view of the supply-demand . Inflation and the factors that cause this problem are as follows: free capacity in the manufacturing sector, low share of private sector investment, low foreign investment, low proportion of the country's exports, high prices for industrial production and One of the causes of inflation is inflation expectations in a society .If people predict that prices will be increase in next future based on their last experiences or based on bazaar observation , so , the rate of their costs and purchase will be increase and on the other hand , producers and sellers ( increasing the price in future) have refused from selling and providing of their commodities . Obviously, in this case with this policy, supply and demand will have direct effect on prices and causes the increasing inflation . Another factor of inflation is reducing the savings rate . As mentioned earlier , non-stability of the prices will be have imbalance effect on economical stability of a country and expectations of people concern to future which as a result , these conditions leads to reducing the saving rate and even in sometimes , it leads to negative rate of saving and most important reason is increasing the repair costs caused by increasing
the currency rate and high rate of capital wear . Another important effect of reducing the savings is the impact on the level of investment that will be increases the stimulate demand and consequently increase the general level of prices . Along with the other mentioned factors, the effect of the exchange rate on the price level of inflation is another factor which arises the macroeconomic policies. If the exchange rate combined with fiscal and monetary policies it will be leads to inflation pressures and if this increase is accompanied by the \implementation of fiscal and monetary tightening policies , it will be have no significant effects on inflation and the general level of inflation . Another factor of inflation is the high interest rates of bank facilities . So that this would cause to domestic producers in world markets which have less competitive than their foreign competitors . Therefore , producers expect that the rate of facility interest decreased in order to reducing the production costs and finally , non-stability can be leads to inflation , and if there is no stability and security in a country it leads to reducing the investment and decreasing the production which it will be along with inflation .
2.2 The impact of Inflation on the Economy
inflation even affect the economic efficiency . One of the adverse effects of inflation is its impact on savings and consumption of the people. Due to the reducing the national currency caused by inflation, all those who hold their liquid capital as savings will be lose their cash which this has a negative effect on people's willingness to saving , and, as mentioned earlier , in inflation condition , willing to durable goods and capital, such as land and housing consumption increases and this can be affected on consumption type .
Another effect on inflation is its impact on decision making of firms so that this subject could be leads to uncertainty the economical actors in their own decision-making because of the fact that economical agents will be faced with difficulties in estimates of revenue and expenditure . The next inflation can be seen in the current expenses of the state since state is consumer itself and on the other hand, state must be pay their wages of employees . Of course , it
should not be forgotten, however, inflation can be increase the government revenues through other fiscal effects of inflation. Of another factors of inflation is its impact on foreign commercial so that inflation often leads to disturbing in payment parallels since in the effect of inflation , on one hand , rate of exports will be decrease due to increasing the prices and on the other hand , the rate of imports will be increase . In this regard , it should be expressed that if in Iran’s inflation is more than other the other countries , then , Iranian consumed commodities will be expensive in these countries and thus , our export will be reduce and on one hand , foreign made countries goods will be cheaper for Iranian consumer and due to import goods into the country it will increase which the initial effects of this phenomenon is more superior concern to payments and in case of shortage of financial resource could be lead to a trade deficit.
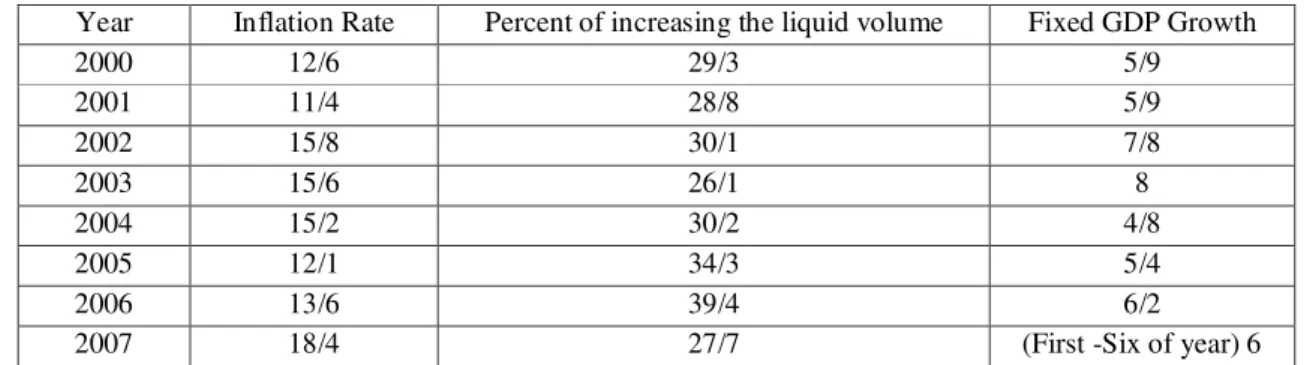
Table 1: Inflation Rate , Liquidity and GDP
Year Inflation Rate Percent of increasing the liquid volume Fixed GDP Growth
2000 12/6 29/3 5/9
2001 11/4 28/8 5/9
2002 15/8 30/1 7/8
2003 15/6 26/1 8
2004 15/2 30/2 4/8
2005 12/1 34/3 5/4
2006 13/6 39/4 6/2
2007 18/4 27/7 (First -Six of year) 6
Source : Iranian Islamic Republic Central Bank
2-3-Literature of Research
Based on author ‘s search, such research has not been performed by this title until now . But some researches has been provided in the field of insurance and inflation as below:
Miss Kay Zhu et al in 2003 studied about high household expenses in an analysis of several countries . They earned data from the census of households in 59 countries and by regression analysis examined the effects of desired variables on household expenses .When the financial contribution includes more than 40% of household expenses from health system ( family health care
costs ) (after removing the livelihood needs) households exposed at catastrophic expenses undesirable condition . They concluded that the share of catastrophic has a wide and various range as payments of pocket among countries. Highest rates of catastrophic payments in some countries was in some transiting countries and South America. In Table 1, some of these countries has been mentioned [4].
The goal of the study is a quantitative analysis of the insurance 's role in payments catastrophic of a country with a low revenue .This study has used the most recent data budget of households in Zambia. The most important result contrary to expectations was that health insurance will not decrease the risk of poverty trap catastrophic of households [5].
In Iran, in recent years this matter is taken into consideration, so that Article 90 of the Fourth Plan as mentioned that "in order to the provision of equitable access of people to health services and reducing the share of low-income and vulnerable households in the payment of fees, distribution resources and facilities will be as way that the contribution index of financial equity of people (FFCI) shall be promoted to (0.90) and whatever people pay directly (from pocket) should not be more than 30 percent " .
In 2005 , a research carried out at the Ministry of Health and training Mehr Ara, M. et al
Table 1 : The percentage of households faced with catastrophic costs of health , in selected countries , name of the country ,Argentina 5/77 , Azerbaijan 7/15 , Bangladesh 1/21 , Brazil10/27, Bulgaria , 2/00, Cambodia 5/02 , 0/09 , Canada 6/26 , Colombia 0/12 , Costa Rica 10/45 , Vietnam 0/07 , Denmark 2/80 , Egypt 0/31 , Estonia 0/44 , Finland 0/01 , France 0/03 , Germany 1/30 , Ghana 2/17 , Greece 0/20 , Hungary 0/30 , Iceland 1/26 , Indonesia 1/86 , Jamaica 2/75 , Lithuania 5/17 , Lebanon 1/54 , Mexico 0/17 , Morocco 2/05 , Nicaragua 0/28 , Norway 2/35 , Panama 3/51 , Paraguay 3/21 , Peru 0/78 , Philippines 2/71 , Portugal 0/55 America 0/55
* source: Zhu et al (2003) health management 2010 ; 40 (13) 54), a physician by Deputy
Razavi et al.was implemented as: (equity in financial participation of health system), they concluded when 8-year-olds plans were in the range of 1995 up to 2002 , index of equity financing reflect the direct situation of justice in households involved in providing financial costs of health. Also each year has at least 2% of
households due to payment the costs of catastrophic health care fall into poverty [6]. Hammond and Houston and Melander: Hammond and Houston and Melander by using data 1952 and 1962 America examined the relations between the right to life insurance as a dependent variable and income, wealth, inflation, age of supervisor of household , education and job of householder as explanatory variables . The estimated regression equation shows that per unit of increasing in revenue of household will be increase 39% of insurance demand.
Neumann: The main contribution of Neumann in open discussion is the effect of inflation on demand of life insurance. Neumann has been used both the demand for life insurance, it means , the insurance premium as well as funds bought . Dependent variables of his explanatory model include : expected price , personal disposable income, the number of marital status, number children per household, citizenship of families, time and dependent variable of lag and time series of distance between 1946-1964 has been used . The model that is dependence to variable of insurance right caused by consumer price index and positive effect and marital status were positive and the effect of having a child, citizenship , time, personal disposable income and lag dependence variable is a negative effect . In a model that dependent variable is insurance funds ,so , description variable of price and delay variable of insurance funds are significant . Diakan : Diakan has been investigated the UK life insurance demand for the period 1946-1968 . The dependent variable premiums of ordinary life and the explanatory variables, the rate of actual inflation, the real index of the market price, real permanent income, wealth, number of children, marital status, income tax rate, the unemployment rate and the rate of change is considered .
models. Rate of unemployment has a positive effect with elasticity of 25% on model of axis saving . There is a significant negative effect of inflation on both the type demand for life insurance.
Atrovil : Atrovil has been considered the factors affecting on the life insurance in developing countries . Econometric data analytics is based on cross data in 1986 for 48 developing countries . Dependent variable of insurance right was related to all types of life insurance and even pensions and the explanatory variables were income per capita, real interest rate, inflationary expectations life expectancy as an indicator of price, the level of financial development, exclusive market and presence of foreign companies in the market is considered. Estimated mode shows that the exclusive market and expected inflation forecast have a negative effect on the demand . The rate of financial orientation, GNP per capita and life expectancy have a positive effect on demand for life insurance.
Pajoeian and Pour Partovi ( 2003 ) : Dr. Pajoeian .J and Pour Partovi .M.T has been evaluated the model of insurance demand since 1966 and its amount estimated by the end of 2001 by using the statistical data . Their objective was to evaluate the effect of income , , inflationary expectations, responsibility and the education level on life insurance applications in Iran . The coefficient of inflationary expectation indicating that insurance life demands is inelastic with respect to inflation. Coefficient LDEP is estimated as dependency ratio 1/85.According to done studies in other countries shows a low elasticity of demand to this variable. Factor LITE shows an effect of literacy on demand for life insurance and this coefficients is higher than to all other coefficient . So , if the percentage of literacy changes by 3% therefore , the demand for life insurance will be changes to 4%. Kardgar (1997): Kardgar has been used statistical data and a series time of national accounts statistics for consideration the affecting factors on demands of life insurance during 1994-1995 . Coefficient LPH indicates the negative
elasticity of expected inflation of demand for life insurance. Therefore , the increase in expected inflation will lead to reducing the demand for life insurance. DUM dummy variable shows the effect of the government's decision based on life and accident insurance for civil employees on demand for life insurance. In this research , impact of responsibility variable and risk for death of supervisor in the family will be rejected by possible level of 1% and removing these two variables has no any much impact on other variables .This is related to cultural and beliefs in society . Aziz Zadeh Niari (2008 ) : Aziz Zadeh Niari . A , has been investigated the factors and affecting variables the demand on life insurance in his research . He analyzed the used statistical data over 13 years from 1966 to 1996 . The variables used in this study are as follows : The dependency ratio by dividing the non-working population to the working population is obtained. The coefficient of per capita income with 91% confidence is meaningful . The literacy rate coefficient with the same confidence is significant but the coefficient load factor and inflation ratio states the t irrelevant of these variables with demand. There is a low correlation between variables in this model .
3. METHODOLOGY
generalized unit root test of Dickey-Fuller. In this type of researches the relationship between the variables will be analyzed on the aim of this study . In this research since time series data may be used by different degree of reliability , so , the regression model will be used and ordinary least squares will be used in order to evolution the model . Used software in this study is software EVIEWS. For data analysis has been used both methods of descriptive and inferential by using the software Eviwes . To investigate the hypothesis used t ESNEWDENT . Often , stability of variables will be test by using the generalized unit root test of Dickey-Fuller according to instability of time series in macroeconomic reviews and their instability provides the false regression .Because of the fact that the purpose of this research is examination the long term relationship between variables of economical growth and inflation ratio to medical expenses , so , ordinary least squares method will be used in order to evolution the model . Statistical population in this research subjects to individuals covered insurance in Iran . In this study, we will be used the period 1991 – 2012 . Often , stability of variables will be test by using the generalized unit root test of Dickey-Fuller according to instability of time series in macroeconomic reviews and their instability provides the false regression .
The basis of research model is as follows:
DIF=α1+α2GOILY + α 3GDP+Ut
Here:
DIF = subtracting the inflation ratio and the growth ratio of the cost of health care of house hold in Iran
GOILY = rate of growth of oil revenues GDPY = rate of economic growth UT: error component
For testing hypotheses ,we will be use OLS method as mentioned above .
4. Analysis of Data Collected 4.1 Descriptive Statistics
In this section, statistical details related to the research variables has been provided . Descriptive statistics variables can be great help to understanding the audience and nature of data and their role in investigating of hypotheses by a comprehensive picture of the data. Table 2 shows the descriptive statistics of research variables during 1991 – 2012 . These values is observed as separately for each of the indexes of OIL , Y and DIF . Although regression method used in this study is OLS or at least squares, but in order to better understanding of variables in each of the test years during ( 1991-1994) has been provided the descriptive statistical of variables . Descriptive statistical of variables are provided in Table 2 which will be examined over time .
Chart 1 : chart related to oil revenues
As the chart shows that rate of 20 year oil revenues in Iran showed that oil revenues has been changed with a mild growth and normal
volatility by 2004 year . But it combined with a significant growth in 2005 and this growth rate has been stalled since 2012
.
Chart 2 : chart related to GDP growth
One of the most important indicators of the state of economy of a country in different periods is GDP growth . In this regard , it will be attempted to investigate the GDP growth in study period . The price of oil had increased on world markets as tripled and due to this rise in prices gross domestic product had high growth in 1981 – 1982 . For example, in 1983 growth GDP was about 11% but unfortunately in the years after 1985 due to the destruction of infrastructure and the sharp decline GDP oil prices have been declined and there was mainly a negative growth. For example, the rate of growth in 1985 and 1986 and 1987 was -1/9 and -1/0 and -5/5 , respectively . In 1989 , this
prices which led to sharp fall in oil revenues and GDP , consequently . So , GDP growth reached to 2/8 and 2/9 and 1/7 in 1997 , 1998and 1999 , respectively. GDP growth rose in 2002 due to the suitability of climatic conditions and on the other hand , balancing and increasing in oil prices and it reached to 6% and 7% . Based on preliminary estimates, in 2007 , Iran's economy has been a good growth compared to 2006 . Calculations shows that the gross domestic product due to base price and due to the constant
price of 1997 has been increased from 446 880 milliard rials in 2006 to 477,683 milliard rials in 2007 and in other words , it represents 6/9% growth. Also , the rate of GDP growth in 2006 was equaled to 6/2% . As a result , the real sector of the economy in 2007 has been an increase by 0/7% in the rate of growth. Also, according to declared statistics by government , economical growth rate was 5/8 , 8/3 and 5% in the years 2008 to 2012 , respectively.
Chart 3: Related to the costs of health care
Chart 4 : related to inflation ratio in Iran
As shown in the above chart , official statistics of Central Bank of Iran shows that inflation rate has enjoyed a relative stability since the beginning of the Islamic revolution to the end of imposed war in spite of the challenges posed by war; whereby the inflation reached to 10% at the end of 1978 and for one year later has been grown by 4/1 percent . Iran's economy has entered a new stage according to warmongering of Iraq regime and the beginning of Holy Defense course and concluded that the first two years of the imposed
imposed war came to promotion gradually and the highest inflation rate over 34 years equals to 4/49 percent was recorded in 2005 . Criticism of the government's economic policy led to removing the inflationary economic plans and constructive government ended to his performance by 3/17 percent rate inflation in 2007 . In government reformation which basis of his economical plans was structural reforms in the economy’s Iran , the lowest inflation rate imposed to Iran's economy concern to the administration building and the ninth and tenth government and during eight years of government reform, only one time inflation passed to 20% in 1999 and finally , file of present government ended by inflation rate of 4/10 percent in 2005 . But economical policies of the ninth government was more injection liquidity
to the wheels of country’s economic and this policy led to record of inflation rate be broken by registration of 4/25 percent after 17 years in 2008 . One year later , inflation close to one-digit rate and reached to 9.10 % and even in some months of 2010 had one-digit rate . But after a few months the inflation rate increased and inflation reached to 9.11% in 2010 and 5.21% in 2011 , respectively .
During the study process of the real cost of healthcare at urban and rural households section in Iran to fixed price period has increased. Although the effect price was removed by price index, but the cost of total household for health care also increased which this cost urban households is higher than rural households.
Chart 5 : related to total cost of household in healthcare section
2-4 Static Test of the Variables (Root Unit)
Test of unit root is one of the most common tests which is used for diagnosis the static of a time series process . For achieving to this purpose , generalized Dickey Fuller has been used for all variables during 1991 to 2012 which null hypothesis (existing the Unit root)
tested against the hypothesis (No
unit root), if the absolute test value of generalized and calculated Dickey Fuller is larger
than the critical value of table, so , the null hypothesis is rejected and variables is static , otherwise , variable in no static in surface , test of stability must be perform on the first difference variables . Tables (2), (3) and (4) shows the obtained results of static test of the variables by using the generalized Dickey Fuller. The findings of the test on variables of model at surface and in the case of source and process mood has been shown in tables (2) and (3) .
test result Statistical value
Variable Name
static 3.07
Oil revenue growth rate
static 3.13
Economical growth rate
static 3.19
growth rate of health care costs
Table 3: Results of static tests of variables at surface and source and process. (Variables are in logarithmic form)
As observed in the table (2), (3) , absolute value of generalized and calculated Dickey-Fuller test for variables of research on the level and process is larger than the critical values of table . So , static of variables will be prove . The reason of stability of variables is that we faced with growth rate data that usually it is static for all growth rates over time.
3-4- Estimation the model based on Ordinary Least Squares and its results
As mentioned earlier , to prove the hypotheses are required to estimation two regression equations . The following table provides the obtained results of differential equation between cost growth rate of household and inflation rate as the dependent variable and the growth rate of oil revenues as an independent variable.
Table 4 : Related to the estimation the relationship between the difference between cost growth rate of household and inflation rate as the dependent variable and growth rate of oil revenues
significant level t value
coefficient Variable
0.0461 2.18
0,06 C
0.3381 -0.99
-0.21 GOIL
R2=0.97 DW=1.61
F=197
According to Table (4) variable dependent is differential variable between the cost growth rate of household and inflation rate . Oil v revenues variable has a negative sign. But it was not significant at the level of 5% . We expect that sign of this variable for negative because of the fact that there are improvements in health indexes and also there are possibility increasing of government’s cost . But it can be seen that the effect of increasing of oil revenues is no significant in this model and it shows that status health according to government health facilities is no improved . Dependent variable coefficient equals to -0.21 . it means that by increasing the oil revenues to 1% , promotion will be increased to 21% in health statue .
R2 index is equal to 0.97 and it means that 97% of changes the independent variable has been explained by dependent variable . F value is a reason for significant the regression and at significant level of 1% l , null hypothesis based on null of all coefficients of model will be rejected . Durbin - Watson also suggests that there is no correlation in model because of the fact that it is more than 1.5 . As mentioned earlier , for prove the hypothesis of research is required to estimation two regression equations. The following table provides the obtained results of differential equation between cost growth rate of household and inflation rate as dependent variable and the growth rate of oil revenues as an independent variable.
Table 5 : Related to estimation the relationship between the difference between cost growth rate of household and inflation rate as the dependent variable and economical growth rate
significant level t value
coefficient Variable
0.0000 -6.49
-18.49 C
0.7083 -0.38
-2.73 GOIL
R2=0.37 DW=2.14
F=5.38
According to Table (5) dependent variable is differential variable between the cost growth rate of household and inflation rate . Economical growth variable which is here considered GDP has a negative sign. But it was not significant at the level of 5% , statistically . We expect that sign
is no improved in status health according to government health facilities . Dependent variable coefficient equals to 2.73 . it means that by increasing the economical growth to 1% , promotion will be increased to 2.73 in health statue .
R2 index is equal to 0.37 and it means that 37 % of changes the dependent variable has been explained by dependent variable . F value is a reason for significant the regression , totally and at significant level of 1% , null hypothesis based on null of all coefficients of model will be rejected . Durbin - Watson also suggests that there is no correlation in model because of the fact that it is more than 1.5
5. Conclusion
Present research concludes two main hypotheses which such hypothesis tested at 95% level. First hypothesis: there is a relationship between the difference of economical growth rate and difference of inflation rate and increase rate of household shares in health care costs According to results of regression estimates by using the ordinary least squares method , There is a negative sign in economic growth variable which is here considered as output growth GDP . But it was not significant at the level of 5% , statistically . We expect that sign of this variable for negative because of the fact that economical welfare will be increased by improvement the economical growth . Thus , we expect for improvement in health indexes .But it can be seen that the effect of increasing the economical growth rate is no significant in this model and it shows that there is no improved in status health according to government health facilities . Here and based on model results we can conclude that wealth caused by economic growth is no in order to improve the indicators of welfare since improvement the health statue is one of the indicators of welfare. Independent variable coefficient equals to -2.73 . it means that Dependent variable coefficient equals to 2.73 . it means that by increasing the economical growth to 1% , promotion will be increased to 2.73 in
health statue . Based on this explanation , first hypothesis of research will no approved and null hypothesis of research is acceptable. So , we can be say that :
-there is no relationship between the difference of economical growth rate and difference of inflation rate and increase rate of household shares in health care costs
R2 index is equal to 0.37 and it means that 37 % of changes the dependent variable has been explained by dependent variable . F value is a reason for significant the regression , totally and at significant level of 1% , null hypothesis based on null of all coefficients of model will be rejected . Durbin - Watson also suggests that there is no correlation in model because of the fact that it is more than 1.5
Second Hypothesis : there is a correlation between growth rate of oil revenues and difference between inflation rate and increasing cost growth rate of household . Based on Ordinary Least Squares and its results there is a negative sign between revenue oil variable caused by oil export . But it is not significant at the level of 5% . statistically . According to Table (4) and (5) , dependent variable is differential variable between the cost growth rate of household and inflation rate . Oil revenues variable has a negative sign. . We expect that sign of this variable for negative because of the fact that there are improvements in health indexes and also there are possibility increasing of government’s cost by increasing the oil revenue . But it can be seen that the effect of increasing of oil revenues is no significant in this model and it shows that status health according to government health facilities is no improved by increasing the oil revenue . Dependent variable coefficient equals to -0.21 . it means that by increasing the oil revenues to 1% , promotion will be increased to 21% in health statue . Based on the estimation of the model , second hypothesis of research will no approved. So , it can be say that :
inflation rate and increasing cost growth rate of household
R2 index is equal to 0.97 and it means that 97% of changes the independent variable has been explained by dependent variable . F value is a reason for significant the regression and at significant level of 1% l , null hypothesis based on null of all coefficients of model will be rejected . Durbin - Watson also suggests that there is no correlation in model because of the fact that it is more than 1.5 .
Recommendation for Research: Estimating the used models in the study, which performed by Ordinary least squares method leads to the following conclusions:
The results showed that pressure the health care costs in household statue of Iranian will no reduce by increasing the oil revenues , therefore , it is required to more pay attention of government in the allocation of earned revenue
of oil to the health care sector .
Also , in Iran's economy , increased wealth has not associated with indices of welfare by increasing the economical growth at least in this cases which we studied , therefore , planners and policymakers should be consider this case .
it is necessary to annual supervising of equity indices in health care ,especially, in the provision of health equity – which unfortunately , it is neglected - and it can be provide a proper approach in order to policy-making and identification the strengths and weaknesses of provided policies .
REFERENCES
1. Data of Iran Statistical Center. Iran Statistics Center site.
2. Abrishami , H & Mehr Ara .M ( 2004 ) Applied Econometrics of New approaches "Tehran University Press.
3. Bakhshi . L (2003) Measured focus in Iran cement industry. Quarterly Journal of Commerce, No. 26
4. Tash, M(2003) . Consideration the Market Structure of export goods and their impact on Iran's non-oil foreign exchange earnings. MA Thesis , Tehran University. 3.
5. Peyrovian , A (2011) .Study the Effects of competitiveness level on industry performance of insurance in Iran .MA Thesis of Public Management ( financial course ), Islamic Azad University, Shoushtar Branch. 4. 6. Hanif Zadeh , L ( 2010) . The ownership
structure and efficiency of Iranian insurance companies . Quarterly Journal of insurance industry, the twenty-fifth year, No. 2. 5.
7. Pajoeian , J. & Poor Partovi , M.T (2003) "estimation the demand for life insurance and its prediction , Quarterly Journal of insurance industry, No. 69.
8. Tajdar , R ( 3111) “ Study the Causes of the growth of life insurance in Iran "MA Thesis, Commercial Management , Management University , Tehran University . Joharian , M.V ( 3111 ) "Life Insurance" Tehran, published by Sephr .
9. The impact of inflation on insurers "translated by Hamidizadeh , M. R. Quarterly Journal of insurance industry, No. 1
10.Kasha , KH, F( 2006) . Structure and market ‘s performance, theory and its application in the industrial sector of Iran. Tehran: publication of Institute for Trade Studies and Researches , Vol. 3.
11.Kasha , KH, F( 2006) . econometrics , Theory and Application. Tehran: Samt publication ,, Vol. 1. 7. Statistical Yearbook of the insurance industry,2009 . Publication of the Central Insurance of the Islamic Republic of Iran. 8. Ghfa
economic , Quarterly Journal of Economic Researches in Iran , Eight year no. 26 .
13.No Fersti , M ( 1999) . Unit Root and co-integration in econometrics. Shahid Beheshti University. Rasa Publication .
14.Nazari , M . “ macroeconomic" . Negah Danesh Publications . Tehran 2006 .
15.A.J. Culyer and J.P. Newhouse, eds ., Handbook of Health Economics, vol. 1, Elsevier Science, Amsterdam,J. P. (2004), “Consumer-directed Health Plans and the RAND Health Insurance Experiment“, Health Affairs 23(6)
16.Bain, J.S., 1956. Barriers to new competition combridge. Mass: Harvard University Press, quoted in Clarke.
17.Cummins, L. and Weiss, W., 1993. Advertising, profits and corporate taxes Review of Economics and statistics. 51, pp. 421-30.
18.Schoen, C., R. Osborn, D. Squires, M. M. Doty, R. Pierson and S Applebaum (2010), “How Health Insurance Design Affects Access to Care and Costs, by Income, in Eleven Countries”, Health Affairs Web First, 18 November 2010
19.Gilber, R.A., 19 4. Bank market structure and competition. Journal of Money, Credit & Banking. 16 (4), pp. 450 -617.
20.Lerner, A.P., 1934. The concept of monopoly and the measurement of monopoly power. The Review of Econimic Studies, 1 (3), pp. 157-75.
21. Kasman, A.D. and Trugutlu, E.V., 2008. Competitive conditions in the Turkish None – Life Insurance Industry. Review of Middle East, Econimics and Finance, 4 (1).
22. Mugume, A.D., 2008. Market structure and performance in uganda's banking industry. Facualty of Econimecs and Management Markerere university.
23. Ross, J.N. and Panzar, J. C., 1977. Chamberlin versus robinson, an empirical test for monopoly rents. Studies in Industry