EFFECT OF WINE FLAVOR ON THE PERCEPTION OF
WINE TASTE AND PREFERENCE
Guilherme Gomes Marques Santos Vitorino
Dissertation to obtain a Master’s Degree in
Viticulture and Enology
Advisor: Manuel José de Carvalho Pimenta Malfeito Ferreira
Advisor: Mariana da Silva Gomes Mota
Júri:
Presidente: Doutor Jorge Manuel Rodrigues Ricardo da Silva, Professor Catedrático do Instituto Superior de Agronomia da Universidade de Lisboa.
Vogais: Doutor Manuel José de Carvalho Pimenta Malfeito Ferreira, Professor Auxiliar com Agregação do Instituto Superior de Agronomia da Universidade de Lisboa, orientador.
Vogais: Doutora Sofia Cristina Gomes Catarino, Professora Auxiliar Convidada do Instituto Superior de Agronomia da Universidade de Lisboa.
I
“Before a wine can be great,
it must first be true.”
II
Acknowledgments
First and foremost I offer my sincerest gratitude to my supervisor, Professor Manuel Malfeito Ferreira of Instituto Superior de Agronomia, who has supported me throughout my thesis with his patience and knowledge whilst allowing me the room to work in my own way. I attribute the level of my Masters degree to his encouragement and effort and without him this thesis, too, would not have been completed or written. One simply could not wish for a better or friendlier supervisor.
I would like to thank Doctor Mariana Mota of Instituto Superior de Agronomia, for her precious help among statistics analysis and general guiding, her endless patience and always friendly and kind approaches towards her students.
I would also like to thank the Professors Jorge Ricardo da Silva, Sofia Catarino and Carlos Lopes, for providing me with the deepest knowledge and information and for being always present to listen.
I owe my special thanks to Mrs. Helena, Mrs Manuela and Mr António for their help during the tastings, sympathy and patience.
To my friends, thank you for listening, offering me advice, and supporting me through this entire process.
Finally, I must express my very profound gratitude to my parents and my brother for providing me with unfailing support and continuous encouragement throughout my years of study and through the process of researching and writing this thesis. This accomplishment would not have been possible without them.
III
Abstract
The present work was aimed at the evaluation of the sensory and liking responses induced by dry white wine modified with increasing flavor concentrations. The tasting panel was composed by 34 trained subjects which were characterized according to gender, smoking habits, vinotype, 6-n-propylthiouracil (PROP) status, saliva flow, sodium chloride sensitivity, tartaric acid, tannic acid sensitivity and sweet liking. Tasters scored the intensity elicited by white wine spiked with different tastants (tartaric acid, sucrose or tannic acid) or increasing levels of a fruity flavor mixture together with their liking evaluation.
The wines with different flavor concentrations were perceived increasingly sweet with constant sourness and saltiness. The tasting panel showed two groups responding differently to orthonasal flavor intensity measured as the longest distance, in cm, from the glass top where the smell is sensed. High and low smell sensitivity individuals showed equal (p<0.05) response to wine sweetness and wine liking while the former group provided lower sourness and saltiness scores. In addition, tasters highly sensitive to all tastes or to sucrose in wine scored aroma intensity with higher values (p<0.05).
Given that the increasingly flavored white wines were perceived different only in their sweetness, the liking scores could only be attributed to congruent perception of fruity flavors and sweet mouthfeel. The preference for white wine was constant across all flavor concentrations, being dependent on some taster categories. Males, non-smokers, PROP medium tasters and low saliva producers yielded higher (p<0.05) liking scores than the respective counterparts. The sensitivities to sourness, sweetness or astringency did not influence preference scores. The Vinotype Sensitive individuals provided higher (p<0.05) liking scores than hypersensitives or tolerants. In conclusion, the results suggested that taste sensitivity had only a minor role on shaping the individual preferences of white wine.
IV
Resumo
O presente trabalho teve como objectivo determinar o efeito do flavor do vinho na percepção de gosto e preferência. Através de alterações de intensidade de aroma em vinho branco foi avaliado o efeito na percepção de intensidade de sabores básicos e de preferência de um painel de provadores treinados. O painel de provadores, composto por 34 elementos, foi segmentado de acordo com o género, hábitos de tabagismo, vinotype, 6-n-propylthiouracil (PROP), fluxo de saliva, sensibilidade a solução de cloreto de sódio, sensibilidade a solução de ácido tartárico, sensibilidade a solução de ácido tânico, sensibilidade e preferência a solução de sacarose. Os provadores avaliaram a intensidade de vinho branco aromatizado com diferentes soluções (ácido tartárico, ácido tânico e sacarose) e a intensidade e preferência de vinho branco aromatizado com concentrações crescentes de uma solução de compostos de aroma.
Nos vinhos aromatizados com crescentes concentrações de compostos de aroma foi demonstrado que a intensidade da doçura está relacionada com a intensidade aromática do vinho. As intensidades de acidez e salgado foram constantes face ao aumento de concentração de solução aromática, assim como a preferência. A intensidade aromática foi determinada pela medição da distância entre o nariz e o copo quando o indivíduo sente o aroma. O painel de provadores apresentou dois grupos distintos relativamente à resposta à intensidade aromática. Por um lado, o grupo composto por indivíduos com alta e baixa sensibilidade à intensidade aroma apresentou uma resposta idêntica (p<0.05) à doçura e preferência do vinho, por outro lado, outro grupo apresentou baixos valores de intensidade para acidez e salgado.
A preferência pelo vinho branco foi constante para todas as concentrações de soluções aromáticas, sendo dependente da segmentação dos provadores. Provadores homens, não fumadores, com perfil médio de PROP e baixos produtores de saliva apresentaram valores mais altos (p<0.05) de preferência que os restantes. Provadores com perfil Sensível de Vinotype exibiram valores mais altos (p<0.05) de preferência que indivíduos com perfil Hipersensitivo ou Tolerante. Em conclusão, os resultados sugeriram que a sensibilidade aos gostos apenas teve um papel parcial na determinação das preferências pelo vinho branco testado.
V
Resumo alargado
O objetivo geral deste estudo foi obter uma medida preliminar do efeito da composição volátil do vinho branco sobre alguns atributos sensoriais na boca e os gostos básicos, como o doce, ácido e salgado, bem como o efeito sobre a preferência do vinho. Em particular, os objetivos do estudo foram:
Desenvolver um método para avaliar a intensidade do aroma de um vinho branco; Avaliar o efeito do aumento da intensidade aromática no vinho branco no gosto e
valorização;
Avaliar o efeito das características do provador na avaliação sensorial e na preferência do vinho branco.
Este trabalho baseou-se no treino de um grupo de provadores que foi submetido a uma segmentação de acordo com género, hábitos de tabagismo, vinotype, 6-n-propiltiouracilo (PROP), fluxo de saliva, sensibilidade ao cloreto de sódio, sensibilidade ao ácido tartárico, sensibilidade ao ácido tânico, sensibilidade e preferência à sacarose.
Trinta e quatro indivíduos (21 mulheres e 13 homens, entre 19 e 40 anos (média 24,6 ± 5,2) foram seleccionados. O painel de provadores foi composto por 12 fumadores, 3 fumadores ocasionais e 19 não fumadores.
O Vinotype é um teste realizado online que consiste num conjunto de questões que determinam as sensibilidades e as tolerâncias de um indivíduo, combinadas com questões que identificam determinados elementos valorizados no vinho. O resultado é o gosto do Vinotype - a combinação única de sensibilidades e valores que compõem as preferências pessoais do vinho. Os possíveis resultados são: Doce, Hipersensível, Sensível e Tolerante. Os resultados do questionário online Vinotype mostraram que 9 provadores foram hipersensitivos, 21 sensíveis e 4 tolerantes.
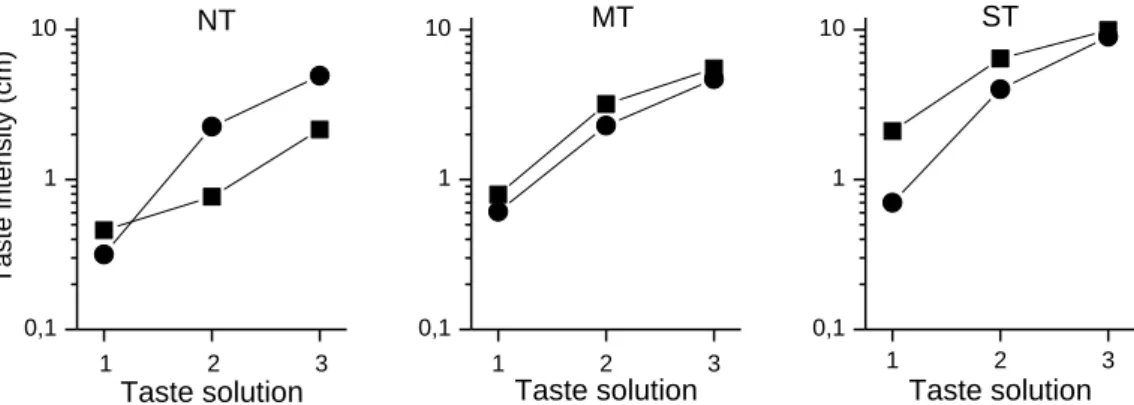
Os provadores avaliaram a intensidade de amargor de 3 soluções de 6-n-propiltiouracilo PROP (0.032, 0.32 e 3.2 mM) numa ordem crescente de concentração. A sensibilidade ao PROP separou os indivíduos em 12 não provadores e 22 provadores.
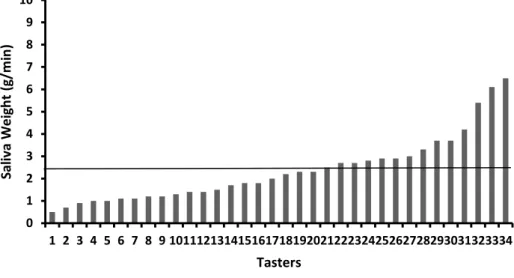
A determinação do fluxo de saliva determinou que 14 provadores são altos produtores de saliva (>2,4 g/min) enquanto os restantes 20 foram baixos produtores de saliva (<2,4 g/min).
VI Os participantes avaliaram a intensidade de três soluções de cloreto de sódio (0,01, 0,1 e 1 mM) numa ordem crescente de concentração. Os provadores avaliaram a intensidade do sabor das soluções usando a escala gLMS. O valor da resposta individual à intensidade das concentrações crescentes foi obtido a partir da média geométrica da resposta a cada concentração. Relativamente à sensibilidade ao cloreto de sódio verificou-se que 14 provadores apresentaram alta sensibilidade e os restantes 20 provadores baixa sensibilidade.
Três soluções de ácido tartárico, ácido tânico e sacarose foram preparadas e servidas por ordem crescente de concentração, de cada vez. As concentrações crescentes utilizadas foram de, 0,1, 1 e 10 g/L de ácido tartárico, 0,1, 1 e 2,5 g/L de ácido tânico e 1, 2 e 4 g/L de sacarose, respectivamente.
Os provadores avaliaram a intensidade do sabor das soluções usando a escala gLMS. O valor da resposta individual à intensidade das concentrações crescentes foi obtido a partir da média geométrica da resposta a cada concentração.
Na análise das sensibilidades ao ácido tartárico, ácido tânico e sacarose verificaram-se os seguintes resultados: a) Ácido tartárico, 15 provadores apresentaram alta sensibilidade e 19 provadores apresentaram baixa sensibilidade; b) Ácido tânico, 16 provadores apresentaram alta sensibilidade e 18 provadores apresentaram baixa sensibilidade; c) Sacarose, 14 provadores apresentaram alta sensibilidade e 20 provadores apresentaram baixa sensibilidade.
A preferência pelo gosto doce determinou que 23 provadores não gostaram de uma solução com 205 g/L de sacarose e os restantes 11 gostaram.
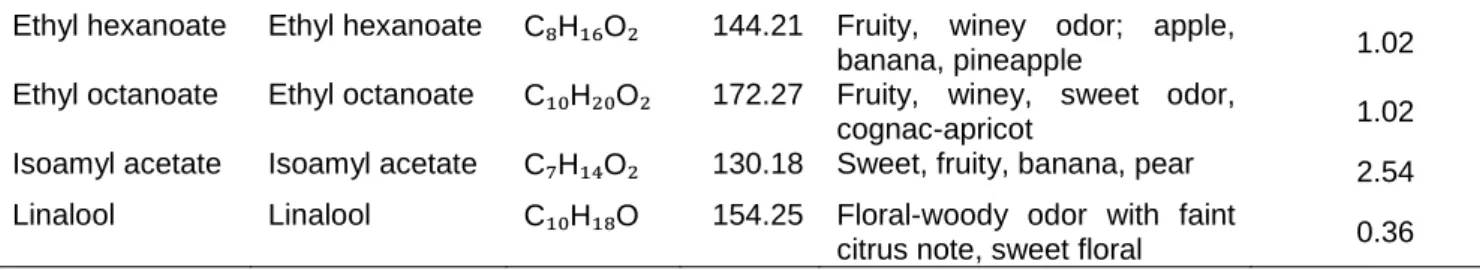
O vinho utilizado durante o estudo foi um vinho Macabeo do Instituto Superior de Agronomia produzido no ano de 2016. O vinho utilizado no estudo era seco, de acidez média a baixa e pouco aromático, com notas delicadas de flores silvestres e vegetais. O vinho foi aromatizado com concentrações crescentes de uma solução de aroma. Os compostos de aroma e suas concentrações foram escolhidos com base em pesquisas anteriores de vinhos de Gewurztraminer. A solução de aroma foi composta por butanoato de etilo, 2-metilpropan-1-ol, acetato de isoamilo, 3-metil-butan-2-metilpropan-1-ol, hexanoato de etilo, 2-fenil etanol, cis-óxido de rosa, acetaldeído, linalol, octanoato de etilo e β-damascenona.
As intensidades de sabor em vinho foram determinadas através de elaboração de cinco soluções de ácido tartárico, ácido tânico e sacarose servidas em ordem aleatória de
VII concentração. As concentrações utilizadas foram de 1 – 0,15g/L; 2 – 0,30g/L; 3 – 0,60g/L; 4 – 1,20g/L; 5 – 2,40g/L de ácido tartárico, 1 – 0,09g/L; 2 – 0,19g/L; 3 – 0,38g/L; 4 – 0,75g/L; 5 – 1,50g/L de ácido tânico e 1 – 6g/L; 2 – 12g/L; 3 – 24g/L; 4 – 48g/L; 5 – 96g/L de sacarose. Os provadores avaliaram a intensidade de cada uma das soluções utilizando uma escala gLMS. A preferência foi determinada através da utilização de uma escala gVAS, que apresenta no seu limite esquerdo a descrição “desgosto extremamente” e no seu limite direito a descrição “gosto extremamente”.
Foram preparadas 4 soluções em vinho branco, aromatizadas com concentrações crescentes de solução de aroma de Gewurztraminer. A primeira solução é de controlo (sem adição de solução aromática) e as restantes com as seguintes concentrações de solução aromáticas 0.5 ml/L, 1 ml/L e 2 ml/L, respectivamente.
Para cada uma das 4 soluções em vinho branco, aromatizadas com concentrações crescentes de solução de aroma os provadores avaliaram a intensidade aromática, intensidade de doçura, intensidade de acidez, intensidade de salgado e de preferência. A intensidade aromática foi determinada pela medição da distância entre o nariz e o copo à medida que este se aproxima do nariz. Quando o provador sente o aroma do vinho, pára de aproximar o copo e regista a distância do nariz ao copo em centímetros, com a ajuda de uma régua de 20 cm. Quanto mais longe do nariz sentir o aroma, maior a intensidade aromática do vinho. Os provadores tiveram que avaliar a intensidade do aroma de 4 soluções crescentes de vinho branco, uma solução de controlo, sem solução de aroma adicionada, e as outras três com 0,5 ml / L, 1 ml / L e 2 ml / L, respectivamente, antes de avaliar a preferência.
O método utilizado na determinação da intensidade aromática, que consiste na medição da intensidade de aroma através da distância do copo de prova ao nariz (em cm), permitiu provar que, no caso em estudo, a distância do copo de prova ao nariz aumenta de forma crescente da menor solução (testemunha) até à solução com maior concentração de aroma (2 ml/L).
Nos vinhos aromatizados com crescentes concentrações de soluções aromáticas foi demonstrado que a intensidade da doçura está relacionada com a intensidade aromática do vinho, isto é, para um aumento da concentração de solução aromática maior é percepção da doçura pelo painel de prova. As intensidades de acidez e salgado foram constantes face ao aumento de concentração de solução aromática, assim como a preferência. A intensidade aromática foi determinada pela medição da distância entre o nariz e o copo quando o
VIII indivíduo sente o aroma. O painel de provadores apresentou dois grupos distintos relativamente à resposta à intensidade aromática. Por um lado, o grupo composto por indivíduos com alta e baixa sensibilidade à intensidade aroma apresentou uma resposta idêntica (p<0.05) à doçura e preferência do vinho, por outro lado, outro grupo apresentou baixos valores de intensidade para acidez e salgado.
A preferência pelo vinho branco foi constante para todas as concentrações de soluções aromáticas, sendo dependente da segmentação dos provadores. Provadores homens, não fumadores, com perfil médio de PROP e baixos produtores de saliva apresentaram valores mais altos (p<0.05) de preferência que os restantes. Provadores com perfil Sensível de Vinotype exibiram valores mais altos (p<0.05) de preferência que indivíduos com perfil Hipersensitivo ou Tolerante. Em conclusão, os resultados sugeriram que a sensibilidade aos gostos apenas teve um papel parcial na determinação das preferências pelo vinho branco testado.
IX
List of Figures
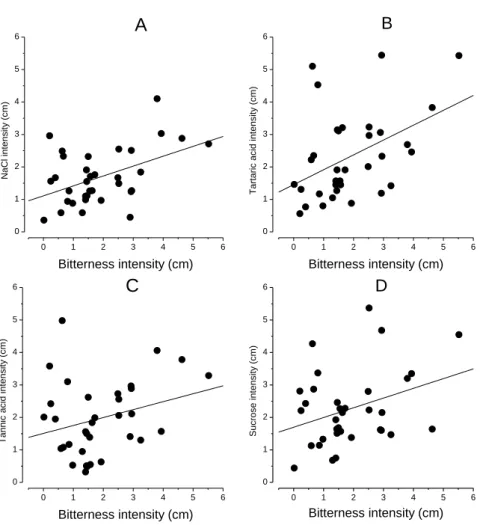
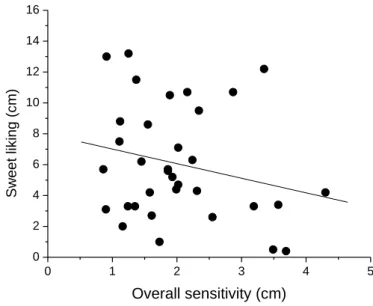
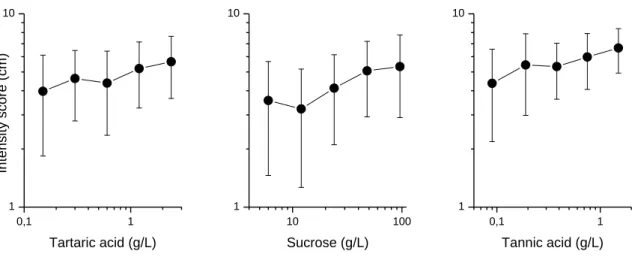
Figure 1.1. Sensory Analysis Evaluation Methods. ...15 Figure 3.1. Taste intensities of PROP(▪) (1, 0.032 mM; 2, 0.32 mM; 3, 3.2 mM) and NaCl (●) solutions (1, 0.01 M; 2, 0.1 M; 3, 1 M) according to each PROP status (NT, Non-tasters; MT, Medium-tasters; ST, Super-tasters). ...29 Figure 3.2. Saliva flow (g/min) of each taster. The horizontal line indicates the cut-off value between high and low producers (2.4 g/min). ...30 Figure 3.3. Intensity scores of tartaric acid, tannic acid and sucrose in water solutions. ...31 Figure 3.4. Distribution of intensity sensitivities to PROP (A), NaCl (B), tartaric acid (C), tannic acid (D), sucrose (E) and overall mean sensitivity (F). ...33 Figure 3.5. Relations between PROP responsiveness and mean intensity scores of NaCl (A), tartaric acid (B), tannic acid (C) and sucrose (D). ...34 Figure 3.6. Relations between PROP responsiveness and mean intensity scores for all tastes and sensations. ...34 Figure 3.7. Relation between overall sensitivity to tastes and sensations and sweet liking. ..36 Figure 3.8. Relation between sweetness intensity and sweet liking. ...36 Figure 3.9. Intensity scores induced by increasing concentrations of tartaric acid, sucrose and tannic acid in white wine. ...37 Figure 3.10. Distribution of mean sensitivities to sucrose (A), tartaric acid (B), tannic acid (C) and overall mean (D) in white wine. ...38 Figure 3.11. Relation between intensities of sucrose and tartaric acid (A), tannic acid and sucrose (B) and tannic acid and tartaric acid (C). Straight lines were obtained by linear regression. ...39 Figure 3.12. Intensity scores given by the tasters to sucrose, tartaric acid and tannic acid. ..39 Figure 3.13. Relations between PROP responsiveness and mean intensity ratings in wine of tartaric acid (A), sucrose (B), tannic acid (C) and of mean intensity of all tastants (D). ...40 Figure 3.14. Relation between the mean intensity perception of tartaric acid, tannic acid and sucrose in water solution and in wine. ...41 Figure 3.15. Distribution of mean liking scores of tartaric acid (A), tannic acid (B), sucrose (D), and overall liking (D) in white wine. ...42 Figure 3.16. Liking scores induced by increasing concentrations of tartaric acid, sucrose and tannic acid in white wine according to High (●) and Low (○) liking classes. Asterisk denotes significant differences (p<0.05) between classes. ...42
X Figure 3.17. Relation between intensity and liking scores for tartaric acid (A), sucrose (B) and tannic acid (C). Straight lines were obtained by linear regression. ...44 Figure 3.18. Relation between mean liking and mean intensity scores of all tastants. ...44 Figure 3.19. Relation between sweet liking scores and mean liking scores (A) and sucrose liking (B) for all tastants. ...45 Figure 3.20. Distribution of the geometric mean of smell intensity scores given by the tasters to all wines spiked with increasing flavor concentration. ...47 Figure 3.21. Smell intensity of white wine spiked with increasing flavor mixture concentrations (1, control wine; 2, control plus 0.5 mL/L; 3, control plus 1 mL/L; 4, control plus 2 mL/L) (A, all tasters; B, Low sensitive tasters and High sensitive tasters). Asterisks denotes significant differences (p<0.05) between High (●) and Low (○) sensitive tasters. ....47 Figure 3.22. Taste intensities (A, sweetness; B, sourness; C, saltiness) and liking (D) of white wine spiked with increasing flavor concentrations (1, control wine; 2, control plus 0.5 mL/L; 3, control plus 1 mL/L; 4, control plus 2 mL/L), according to smell sensitivity (▲, High smell sensitivity; ▼, Low smell sensitivity). Asterisks denote significant differences (p<0.05) between high and low smell sensitive tasters. ...50
XI
List of Tables
Table 1.1. Human factors affecting sensory analysis (Kemp et al., 2009). ...17
Table 2.1. Physicochemical parameters of the base white wine. ...27
Table 2.2. Aroma solution compounds and their properties (Arvisenet,et al., 2015). ...27
Table 2.3. Concentration of aromatic molecules added to wine. ...28
Table 3.1. Characterisation of the tasting panel. ...31
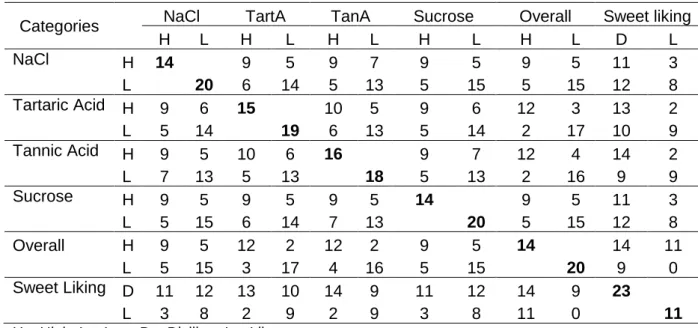
Table 3.2. Taster characterization according to tastes sensitivity and tactile sensations. ...35
Table 3.3. Taste intensity of white wine spiked with increasing concentrations of tartaric acid, tannic acid and sucrose. ...38
Table 3.4. Liking scores of white wine spiked with increasing concentrations of tartaric acid, tannic acid and sucrose. ...41
Table 3.5. Liking scores of tartaric acid, sucrose and tannic acid in white wine spiked with increasing concentrations of tartaric acid, tannic acid and sucrose, according to High and Low liking classes. ...43
Table 3.6. Smell, taste intensities and liking of white wine spiked with increasing concentrations of a flavor mixture according to smell sensitivity classes (1, control wine; 2, control plus 0.5 mL/L; 3, control plus 1 mL/L; 4, control plus 2 mL/L). ...46
Table 3.7. Smell and taste sensitivities given by high and low smell sensitive tasters to white wines spiked with increasing aroma concentrations (p<0.05). ...48
Table 3.8. Taste intensities of white wine spiked with increasing flavor concentrations (1, control wine; 2, control plus 0.5 mL/L; 3, control plus 1 mL/L; 4, control plus 2 mL/L), according to smell sensitivity classes. ...49
Table 3.9. Effect of taster categories on smell and taste intensities. ...52
Table 3.10. Effect of taster categories on liking scores. ...52
Table 3.11. Effect of sensitivity categories elicited by wine on smell and taste intensities of wine spiked with increasing flavor concentrations. ...53
Table 3.12. Effect of taster sensitivity categories on liking of white wine spiked with increasing flavor concentrations. ...54
XII
List of Annex
1. Tasting Sheets ...64
a. Evaluation of sensations ...64
b. Demographic and Saliva Flow ...66
c. Vinotype ...67
d. PROP Status, Sodium Chloride, Tartaric Acid, Tannic Acid and Sucrose Intensity (Water) ...68
e. Sweet Liking Status ...69
f. Tartaric Acid, Tannic Acid and Sucrose Intensities and Liking (Wine) ...70
g. Aroma Intensity and Liking ...73
2. Data ...78
a. Demographic ...78
b. PROP Status ...79
c. Saliva Flow ...80
d. Sodium Chloride Sensitivity ...81
e. Tartaric Acid Sensitivity (Water) ...82
f. Tannic Acid Sensitivity (Water) ...83
g. Sucrose Sensitivity (Water) ...84
h. Overall Sensitivities (Water) ...85
i. Sweet Liking ...86
j. Tartaric Acid Intensity and Preference (Wine) ...87
k. Tannic Acid Intensity and Preference (Wine) ...88
l. Sucrose Intensity and Preference (Wine) ...89
m. Aroma Intensity and Sensitivity ...90
n. Sweetness, Acidity, Saltiness and Liking Intensity ...91
XIII
Table of Contents
1. Introduction ... 1
1.1 The multisensory wine perception ... 1
1.1.1 Olfaction ... 2
1.1.2 Gustation ... 3
1.1.3 Tactile Sensations ... 5
1.2 The sensory complexity of wine ... 7
1.2.1 Diversity of wine aroma and flavor ... 7
1.2.2 Wine Flavor ...10
1.2.3 Taste-aroma interactions ...11
1.2.4 Temporal evolution of taste and mouth-feel sensations ...13
1.3 Sensory Analysis ...14
1.3.1 Sensory analysis evaluation methods ...14
1.3.2 Limitations of sensory analysis evaluation ...17
1.4 Taster segmentation ...18
1.4.1 Vinotype ...18
1.4.2 PROP ...19
1.4.3 Saliva Flow rate ...20
1.4.4 Sweet liking ...20
1.5 Objectives of the study ...21
2. Material and Methods ...23
2.1 Taster Selection and training ...23
2.2 Taster characterization...23
2.2.1 Questionnaires ...23
2.2.2 Vinotype ...23
2.2.3 PROP Status and Sodium Chloride ...24
2.2.4 Saliva flow ...25
XIV
2.2.6 Sweet liking status ...25
2.3 Determination of taste and aroma intensity in white wine ...25
2.3.1 Determination of taste intensities and liking ...25
2.3.2 Aroma intensity, taste and liking ...26
2.3.3 Taste and sensation intensity ...26
2.3.4 Liking ...26
2.4 Wine ...27
2.5 Data Analysis ...28
3. Results and Discussion ...29
3.1 Taster Characterization ...29
3.1.1 PROP status ...29
3.1.2 Saliva Flow ...30
3.1.3 Overall tasting panel characterization ...30
3.2 Intensity of prototypical tastes and sweet liking status ...31
3.3 Relation among tastes and sensations in white wine ...37
3.3.1 Intensity evaluation of tartaric acid, tannic acid and sucrose ...37
3.3.2 Prototypical taste responsiveness and taste sensitivity in wine ...39
3.4 Relation between wine liking, intensity perception and sweet liking ...41
3.4.1 Liking of white wine spiked with tartaric acid, sucrose and tannic acid ...41
3.4.2 Relation between liking and intensity perception ...43
3.4.3 Relation among liking scores ...44
3.5 Influence of white wine aroma on sensory and liking responses ...45
3.5.1 Smell and taste intensity evaluation ...45
3.5.2 Liking responses according to smell sensitivity ...50
3.5.3 Influence of taster categories on flavor sensitivity and liking ...51
3.5.4 Influence of taste sensitivity in wine on flavor sensitivity and liking ...53
4. Discussion ...55
XV
4.2 Relationships between taste sensitivities and liking ...55
4.3 The interaction between white wine smell and taste ...56
4.4 Relations among taster characteristics and wine flavour-taste responses ...56
4.5 Factors affecting wine liking ...57
5. Limitations of the study ...58
6. Conclusions and future prospects...59
1
1. Introduction
“For many producers as well as aficionados, wine is an art object, albeit a liquid one. All that
attention to detail, striving for individuality, retention of attributes from sun, soil and scion, culminate in the moment it is poured into a glass, swirled, sipped, savored and swallowed. Then it fades into memory. During that brief interlude between the wine’s ultimate alpha and omega, the consumer is exposed to a fascinating spectrum of sensations. These may provide clues to the wine’s provenance, style, varietal origin, age, complexity, and quality. Although most wines do not require, nor benefit from, intense scrutiny, fine wines do warrant and reward the effort involved. Because the consumer can never know exactly what to expect from a bottle, truncating any of the steps in a formal tasting risks missing one or more of its sensory delights, and obviate relishing in the efforts put into its production” (Jackson,
2014).
1.1 The multisensory wine perception
The act of drinking involves directly the senses of smell, taste and touch. These senses are simultaneously stimulated and so it is not easy to define how each of them influences wine perception (Small, 2012).
Aroma can be defined as “the property of certain substances, in very small concentrations, to stimulate chemical sense receptors that sample the air or water surrounding an aroma” (Illy and Viani, 2005). According to the American Society for Testing and Materials (ASTM), it is the “perception resulting from stimulating the olfactory receptors; in a broader sense, the term is sometimes used to refer to the combination of sensations resulting from stimulation of the nasal cavity” (ASTM E253-03). International Organization for Standardization (ISO) does not give a unique definition, describing it as “an odour with a pleasant connotation” or “organoleptic attribute perceptible by the olfactory organ via the back of the nose within tasting” (ISO 5496:1992).
Flavor is by far the most debated term and it varies according to the field of research. An early sensory definition was “the sensation realized when a food or a beverage is placed in the oral cavity. It is primarily dependent upon reactions to taste and olfactory receptors to the chemical stimulus. However, some flavors also involve tactile, temperature and pain receptors” (Beidler, 1958). Therefore, flavor is a multi-modal perception deriving from the activity of neurons that respond to inputs from different sensory receptors (Small, 2012). The
2 receptive field for flavor is the mouth, where smell, taste and touch are pooled and transformed into flavor percepts (Small, 2012). Visual and sound clues can also influence the percept flavor (Jackson, 2014).
The gustatory sense produces the sensations of sweet, sour, salty, bitter and savory. Taste is perceived through the oral cavity together with tactile sensations that always co-occur with taste (Small, 2012). The oral cavity also appears to be the source of olfactory stimuli, which are thus mislocalized. This perceptual illusion explains why the confusion between smell and taste is frequent and has been named as “oral referral” (Spence, 2016). This phenomenon is central to the multisensory flavor perception, being dependent on tactile capture of olfaction, the relative timing of olfactory and gustatory stimuli and gustatory capture (Spence, 2016). Oral referral of orthonasal aroma is modulated by taste intensity, while for retronasal odors, it is the congruency between the odor-taste pairing that is the key. The more congruent a particular combination of smell and taste, the more likely the component unisensory stimuli will be bound together as a flavor object (Spence, 2016).
1.1.1 Olfaction
Odor is the sensation perceived by means of the olfactory organ in sniffing certain volatile substances (ISO 5492:2008). Our ability to sense odor is dependent on two, small, seemingly insignificant patches of tissue in the upper recesses of our nasal passages. Volatile compounds reach the olfactory epithelium either directly, via the nostrils (orthonasal), or indirectly from the back of the throat (retronasal). The latter route is especially important in the generation of flavor. The term orthonasal olfaction used for when we inhale, or sniff, while retronasal olfaction occurs when volatiles are pulsed out from the back of the nose while eating and drinking. Orthonasal olfactory cues are key to setting our expectations concerning the sensory and hedonic attributes of food and drink; by contrast, retronasal olfactory cues are central to the experience of flavor (Spence, 2016).
The sense of smell is very complex. Aroma and flavor are chemical senses stimulated by the chemical properties of odor molecules which must reach the olfactory bulb to interact with olfactory cells in the olfactory mucosa. Smells are detected by breathing air that carries odor molecules. Therefore, to smell, molecules must be airborne (i.e., volatile).
The air comes in contact with the tiny smell receptors high in the nasal passages. These receptors send information to smell nerves, then the brain. The specific reaction with the odor molecule is unknown. The sensory term which we term “flavor” is a mingled experience
3 with includes sensations of vision, smell, temperature, pain, pressure and other tactile sensations (i.e. texture). By definition, flavor is based on human judgment. Thus, the study of volatile compounds by GC, HPLC and other physical and chemical means is not “flavor” research.
Factors affecting odor sensitivity include interactions with other senses such as taste and vision/color. In particular, color can lead to the perception of smell when it isn’t present, increased perceptions or distorted perceptions. Odor is subject to adaption in which one odor generally has little effect on perception or dissimilar odors, but interferes with the perception of similar ones. Other factors affecting odor include age, gender, smoking and olfactory disorders (anosmia, hyposmia, hypersomnia and dysomia.).
Generally in wines, esters are responsible for the fruity notes while some lactones and volatile phenols contribute to the woody character. These volatile compounds are present at different concentration levels and proportions, depending on the wines. A previous study showed that when woody character increases, the flavor complexity of wine decreases. Indeed, the intensity of fruity and floral notes was especially reduced. This suggested an interaction, at a perceptual level, between the fruity and woody notes of wine. Thereafter it could be hypothesized that various proportions of the same odorants in a mixture generate various sensory perceptions that may be at the origin of wine aromatic bouquet specificity (Atanasova et al. 2004).
1.1.2 Gustation
The perceptions of taste and mouth-feel are derived from two distinct sets of chemoreceptors. Taste is associated with specialized receptors primarily located in taste buds on the tongue. They generate at least five, distinct, receptor-mediated, gustatory sensations – sweet, umami, bitter, sour, salty (Jackson, 2014).
Taste, according to the International Standard Sensory Analysis Vocabulary (ISO 5492:2008), is defined as sensations perceived by the taste organ when stimulated by certain soluble substances. Taste is closely related to smell. The perception of odor and taste, combined with trigeminal sensations, results in the overall flavor. Flavor influences food acceptance and selection of food intake, and helps us to distinguish potentially harmful compounds. The taste sensation is a very complex process starting at the sensory receptor level and finishing in the central nervous system, where it is combined with information
4 coming from other senses. The sense of taste is a chemical sense due to taste stimuli falling on taste receptors located on the tongue called taste buds.
1.1.2.1 Sweet
Taste cells have G-protein-coupled receptors or GPCRs on their surfaces. When tastants of sweet substances such as sugar goes into the mouth, they bind to the GPCRs, particularly gustducin. This leads to the release of calcium ions (Ca++) and influx of sodium ions (Na+) into the cell, causing it to depolarize and release ATP. The release of ATP generate action potentials in a sensory neuron nearby.
1.1.2.2 Salty
Current research on salt sensation tells us that sodium chloride or table salt stimulates an ion-channel receptor that admits the sodium ions into the cell. When this happens, the cell undergoes depolarization. When the limit or threshold for cell depolarization occurs, action potentials are generated in a neighbouring sensory neuron.
1.1.2.3 Sour
Sour substances, mainly acids, liberate hydrogen ions or protons (H+). These protons are detected by sour receptors. Once detection of H+ occurs, potassium ion channels (K+) closes, leading to cell depolarization. Then, a neurotransmitter called serotonin is released into the synapse with a nearby neuron.
1.1.2.4 Bitter
Just like the sweet sensation, bitter sensation also includes the binding of bitter taste molecules on the GPCRs coupled to the protein gustducin. There are about 25 varying bitter receptors or T2Rs encoded in human genes.
1.1.2.5 Umami
"Umami" is a Japanese word which means "delicious", "yummy", "savory", or "pleasant taste". It is a meaty taste sensation that corresponds to the salts of glutamic acid. Umami became more popular with the use of monosodum glutamate (MSG) as a glavor enhancer in many Asian, particularly Japanese, dishes. The umami tastants bind in GPCRs, and thus, they have a signaling sequence similar to that of the bitter and sweet sensations.
Factors affecting taste sensitivity include age, smoking, viscosity of products, taste disorders (ageusia, non-tasters, hypogeusia, hypergeusia, dysgeusia) and temperature.
5 1.1.3 Tactile Sensations
Mouth-feel is activated by free nerve endings, and gives rise to the sensations of astringency, dryness, viscosity, heat, coolness, prickling, and pain. Textural perceptions, could be generated by salt crystals or sediment that are generally not present, or should not be present. The only textural aspect associated with wine is generated by the bursting of a sparkling wine’s bubbles. Their distribution throughout the oral cavity generates diffuse, poorly localized sensations. In wine, mouth-feel includes the perceptions of astringency, temperature, prickling, body, and burning. They derive from the stimulation of one or more of the (at least) four general categories of trigeminal receptors. These are mechanoreceptors (touch), thermoreceptors (heat and cold), nocireceptors (pain), and proprioreceptors (movement and position) (Jackson, 2014).
1.1.3.1 Astringency
Astringency refers to a complex of puckery, rough, dry, dust-in-the-mouth, occasionally velvety sensations, whose precise molecular origins are still in dispute. Regarding tannins, hydrolysable tannins (gallo- and ellagitannins) and condensed tannins (also known as proanthocyanidins) are the most important polyphenolic compounds present in wines that are able to interact with proteins and, therefore, the most related to astringency perception. However, other wine phenolic compounds, such as flavonols, phenolic acids or anthocyanins, can also play an important role in astringency development (Jackson, 2014). Anthocyanins can enhance the astringency induced by procyanidins, but do not directly contribute to astringency or bitterness. White wines show less astringency due to their lower phenolic concentrations. When astringency is detected in white wines, it probably arises due to high acidity. Although astringency may be confused with bitterness, both being primarily induced by related compounds, they are distinct sensations. Astringency in wine is normally ascribed to the binding and precipitation of salivary proteins and glycoproteins with phenolic compounds.
1.1.3.2 Burning
Wines high in ethanol content produce a burning mouth-feel, especially noticeable at the back of the throat. Some phenolics also produce a peppery burning sensation, as can high sugar contents. These perceptions probably result from the activation of polymodal nocireceptors on the tongue and palate. These neurons possess vanilloid receptors (TRPV1). They act as an integrator of many noxious stimuli (heat, acids), and complex bio-organics, such as capsaicin found in chili peppers. These receptors can generate either heat
6 or pain sensations. Most sapid substances, when generating intense sensations, stimulate nocireceptors (Jackson, 2014).
1.1.3.3 Temperature
The cool mouth-feel, produced by chilled sparkling or dry white wine, adds an element of interest and pleasure to these wines of subtle flavor. Cool temperatures also help extend the duration of effervescence shown by sparkling wines. In contrast, red wines typically are served at room temperature. This preference may be based on reducing the wine’s perceived bitterness and astringency, and increasing the volatility of its aromatics. Nevertheless, the preferred serving temperature of wine may reflect custom, as much as any other factor. This is suggested by the apparent nineteenth-century predilection for drinking red bordeaux cold, although it may also relate to the wines at that time resembling more rosés that red wines. The old expression for bordeaux wines was claret, from vin claret, referring to yellowish to light red wines (Jackson, 2014).
1.1.3.4 Prickling
Bubbles bursting in the mouth produce a prickling, tingling, occasionally burning/painful sensation. These are partially associated with stimulation of trigeminal nerve endings. However, there appears to be a second aspect to the sensation. An enzyme, carbonic anhydrase, present on gustatory cells, almost instantaneously converts carbon dioxide and water to bicarbonate and hydrogen ions (Jackson, 2014).
The hydrogen ions may directly activate acid-sensing receptors, contributing to the sensation generated by CO2. Alternately, conformation changes in membrane-bound carbonic anhydrase may induce activation of acid receptors. These sensations are primarily elicited by wines containing more than 3–5‰ carbon dioxide. They appear partially related to bubble size and temperature, and are more pronounced at cold temperatures. Carbon dioxide can also modify the perception of sapid compounds, enhancing sourness and suppressing sweetness, and significantly increase the perception of cold in the mouth.
1.1.3.5 Body (Weight)
Although ‘body’ is a desirable aspect in most wines, the precise origin of this perception remains largely a mystery. Sweetness often roughly correlates with a sensation of fullness in the mouth, possibly due to its influence on enhancing the perceived intensity of aromatics. Other tastants appear not to have a similar effect, including alcohol. In contrast, aromatics have little or inconsistent influence on the perception of tastants. Glycerol can increase the
7 perception of body, but only at concentrations found in some very sweet wines. The viscosity range characterizing most table wines seems, by itself, insufficient to explain perceived differences in body. Nonetheless, other constituents appear to induce perceived differences in body. In the white wines they studied, body seemed correlated with a combination of factors, including physical viscosity, osmotic potential, total extract, as well as lactic acid and magnesium contents. Aspects, such as acidity, appear to reduce the perception of body. Less recognized is the importance of grape and yeast polysaccharides. Both the main yeast polysaccharides (mannoproteins) and principal grape polysaccharides (arabinogalactanproteins and rhamnogalacturonans) increase the perception of body (fullness). Regrettably, the phenolic composition is so complex, and the exact meaning of body as illusive, that obtaining any precision in predicting their influence is nigh impossible. Another element in the perception of body almost undoubtedly involves aspects of wine fragrance, notably its intensity (Jackson, 2014).
1.1.3.6 Metallic
According to Jackson a metallic sensation is occasionally detected in dry white wines, especially sparkling wines. Its origin has not been established. It could be induced by iron and copper ions. However, concentrations required to directly produce a metallic taste are normally well above those found in wine (>20 and 2mg/liter, respectively). Smaller quantities may, however, be involved in catalyzing fatty acid oxidation.
When oxidized, lipid carbonyl by-products can generate metallic sensations, for example, oct-1-en3-one. Several reduced sulfur compounds also have a metallic attribute, for example, 2-methyltetrahydrothiophen-3-one and ethyl-3-methylthiopropionate. That metallic sensations typically disappear when the nostrils are pinched, only to reappear when they are reopened, are, in reality, misinterpreted, retronasal, olfactory sensations (Jackson, 2014).
1.2 The sensory complexity of wine
1.2.1 Diversity of wine aroma and flavorAroma is one of the most important quality attributes for wine and many other alcoholic beverages. However, the chemical composition of most alcoholic beverages is so complex that it has always been a challenge for scientists to fully understand their flavor chemistry (Qian et al., 2012).
8 Aroma compounds, as a result of their pronounced effect on the sensory organs, play a definitive role in the quality of the food and luxury products. As in the case with most food products, the aroma or "bouquet" of a wine is influenced by the action of several hundred different compounds. When dealing with wine aroma, a distinction is made among—(1) primary or grape aroma: aroma compounds as they occur in the undamaged plant cells of the grape; (2) secondary grape aroma: aroma compounds formed during the processing of the grapes (crushing, pressing, skin contact) and by chemical, enzymatic-chemical, and thermal reactions in grape must; (3) fermentation bouquet: aroma compounds formed during the alcoholic fermentation; (4) maturation bouquet: caused by chemical reactions during maturation of the wine (Rapp et al., 1995).
According to Ferreira, aroma compounds in wine are classified according to the role they can play in wine.
Impact or highly active compounds, are the compounds which can effectively transmit their specific (impact) or primary (highly active) aroma nuance to a given wine without the need of the support of more aroma chemicals. An example is linalool.
Impact groups of compounds. These are families of compounds usually having similar chemical structures (chemical homologous series) and with quite close odour properties and that can impart to the aroma of a wine the specific notes of the family. An example is the γ-lactones.
Subtle compounds or families. These are the compounds or groups of compounds which fail in transmitting their specific aroma nuances to the wine, but contribute decisively to the development in wine of some secondary-generic aroma nuance (for instance fruity, sweet) always with the necessary support of other chemicals bearing a similarity in such odour notes. Compounds in categories 1 and 2 in insufficient concentration, or even if present at high enough concentration, they co-occur with many other powerful odourants (such as happens in complex wines), may fall into this category.
Compounds forming the base of wine aroma. These are the compounds, present in all wines at concentrations above their corresponding odour thresholds which, however, are no longer perceived as single entities because their aromas are fully integrated to form the complex concept of wine aroma. Within this group different roles can be found: a. aroma enhancers; and b. aroma depressors.
Off-flavours. These are the compounds whose presence brings about a decrease in the general aroma quality of wine.
9 Wine aromas are very diverse. When we talk about wine aromas we are talking about a number of different things. While the aromas of any one wine are strongly linked to the particular grape variety/ies that made the wine, they are also influenced by where the grapes were grown, by how the wine was made (such as particular winemaking and maturation techniques) and, by bottle age. Different grapes have different primary aromas. The same grape grown in a cooler climate will have different aromas when grown in a warmer climate. For example, Chardonnay grown in a cool climate like Chablis, will have prominent green apple and citrus aromas. Chardonnay grown in a moderately warm climate such as the Macon will smell more like melon and grapefruit, while Chardonnay grown in a warm climate will show more pineapple and tropical fruit aromas. Grape aromas can be fruity and/or floral. Many white varieties such as Riesling and Viognier have very definite floral notes. Fruit aromas most associated with white wines include citrus, orchard, stone and tropical fruit. Red fruit aromas span the gamut of black and red fruits, all sorts of plums, berries and cherries. Depending on ripeness the aromas can be like freshly picked fruit, jammy, baked or even raisined or dried when ultra ripe. Beyond fruity, wine aromas can be mineral, spicy, vegetable, herbal or herbaceous. While some of these aromas can come from the primary grape, they can also come from the specific terroir, where the grapes were grown. Herbal aromas can be fresh or dried and include tarragon, mint, eucalyptus as well as the famous Garrigue aroma associated with the wines of Châteauneuf du Papes. Herbaceous aromas include grassy or asparagus notes so often found in Sauvignon Blanc. Mineral aromas can be flinty, stony, earthy or tarry. Vegetable aromas include green or black olive (think cool climate Syrah) as well as all sorts of salad, peas and beans. Finally, spicy aromas can be inherent to the grape such as black pepper in Syrah, white pepper in Gruner Veltliner or they can come from oak (Reynolds, 2010).
As well as adding spice, oak can add all sorts of wonderful aromas to a wine including cedar, toast, char, smoke, clove, licorice, baking spices, vanilla, coconut or vanilla.
Cool temperature fermentations tend to preserve and even enhance the primary fruit aromas of the grape, while warmer fermentations tend to produce wines that are more driven by structure than primary fruit. Similarly wines fermented in stainless steel tanks are typically fruitier than those vinified in cask. Techniques such as Malolactic Fermentation (MLF), which converts the harsher malic acid in a wine into a softer lactic acid can add creamy, buttery aromas to a wine.
As a wine ages either in tank, wood or in bottle it undergoes lots of internal chemical reactions. Compounds in the wine breakdown and react with each other to form new
10 compounds and new aromas. Such aromas include leather, cigar box, truffle or mushroom, fusel/petrol, brioche/cereal or honey aromas.
Off-aromas or faults can also be present in wines. These are the aromas that we do not want to find in our wine. Sometimes a teeny weeny hint of certain ones is desirable and actually adds complexity to a wine, but it is a thin tightrope and a dominant force of any of them is undeniably a fault. Such aromas include overly oxidative aromas, cork taint (TCA), vinegar, nail polish remover, rotten cabbage, sulphur, stinky barnyard or smelly sweat.
A normal table wine contains several hundreds of volatile compounds, but most of them are at concentrations well below the threshold, which means that they are not really relevant in the perception of the sensory attributes of the wine. The number of odour molecules really active in a normal wine lies between 20 and 40, and the total number of odour molecules that can be really active in the different kinds (without odour problems) of wines is around 70. The base aroma of wine is formed by chemical compounds, mainly ethanol, diacetyl, acetaldehyde, fusel alcohols, organic acids, isoacids, organic acid ethyl esters, fusel alcohol acetates and ethyl esters of isoacids (Reynolds, 2010).
The complexity of wine aroma is in accordance with its chemical complexity. As happens in complex perfumes, and far from the artificially flavored products, wine aroma is the result of complex interactions between many odour chemicals (Reynolds, 2010).
1.2.2 Wine Flavor
Flavor refers to the taste of a wine in your mouth. As well as reflecting the aromas absorbed retro-nasally, the overall flavor of a wine is also influenced by the wine's acidity, sweetness, alcohol level, tannins, astringency, body and in sparkling wines by its fizziness, as these components can accentuate or neutralize the flavors.
All grapes contain flavor compounds, some more than others. Grapes also contain flavorless compounds, which are activated through different chemical reactions that occur during winemaking and wine maturation, thereby releasing additional flavors into the wine. This is why the flavor of a wine is more complex than the flavor of grape juice, and also helps explain why the flavors of a mature wine are more complex than those of a young wine. As with aromas, wine flavors can be categorized as fruity, floral, spicy, mineral, vegetal or oaky. Fruit flavors can be fresh and lively or jammy, baked or even raisined. Apart from
11 identifying types of flavors we also consider the intensity of these flavors. More intense, concentrated flavors are typically a sign of a better wine, due perhaps to riper grapes, smaller-berries, a stricter selection of only the best grapes or longer maceration and/or extraction time during vinification.
Flavors also contribute to an overall taste sensation. Wine flavors can be bold and forward or subtle and restrained. They can be quite precise and focused or somewhat muddled and vague. They can be generous or lean, tight-knit or loose-knit. In short, they flavors be well defined or poorly defined.
As with aromas, wine flavors change as a wine matures. In a young wine, the youthful primary fruit flavors prevail. With age, these are replaced by more developed flavors of leather, earth, spice, truffle and game in red wines, or honey, nutty, fusel and toasty brioche flavors in whites.
Depending on the amount, ripeness and texture, tannin can add unctuousness and plump out a wine's flavors, or it can make a wine taste astringent and bitter. The flavors of young very tannic wines, particularly top Bordeaux or Barolo wines can be hard to appreciate until the tannins start to resolve and integrate.
Acidity brightens a wine's flavors and makes them stand out. Alcohol creates a feeling of warmth. When in balance it adds to the overall taste sensation. When high, it can give a perception of sweetness to a wine, and when too high it gives a burning sensation, and cut short wine flavor.
Finally, bubbles accentuate flavors in a wine. Tiny persistent bubbles enhance flavor and add elegance, whilst, larger coarser bubbles mask flavor with froth.
1.2.3 Taste-aroma interactions
The sensory character of a food results from the integrated perception of the multiple stimuli elicited by its chemical and physical properties. I would be inappropriate to try to understand each single perception separately as the perception of each stimulus can be affected by the presence in the food of other stimuli, assessed by other senses. Food chemists, sensory analysts and psychophysicists have tried for decades to understand the origin and mechanism of multisensory perception of flavor. In particular, retronasal aroma perception can be modulated by the presence of sapid compounds although these do not stimulate olfactory receptors. How the perception of aroma interacts with the perception of sweet taste
12 has notably been the subject of many studies. Different aroma compounds have been found to enhance sweetness perception. Reciprocally, the addition of sucrose has also been found to increase perceived aroma intensity in model solutions (Arvisenet, et al. 2015).
The mechanisms proposed to explain the mutual influence of aroma and taste when perceived together can occur at physicochemical, physiological or psychological levels.
1. Physico-chemical interactions: can occur between aroma and taste compounds in the matrix, changing the concentration of the stimulus before it activates the receptors. Such interactions between sweet compounds and odorant volatile compounds can induce either the retention or the release of the volatile compounds, depending on the nature of the volatile and saccharide molecules.
2. Neurophysiological level: Unlike taste-taste and odor-odor interactions, it seems utterly improbable that taste-aroma interactions would occur at the level of the olfactory or gustative receptors. However, the olfactory and gustatory signals have been shown to converge in the same areas of the orbitofrontal cortex. The activation of certain brain areas by an odor-taste pair is correlated with the congruence of the two stimuli.
3. Psychological interactions: Some authors consider flavor as a “distinct sense” cognitively constructed from separate sensory systems, primarily olfaction and gustation. A prior experience of the occurrence of a gustative and an olfactory stimulus in the mouth results in the acquisition of a flavor memory, which can later be reactivated when one of its components is experienced alone (Arvisenet, et al. 2015). It has been widely accepted that interactions can, and do, occur within stimuli (aroma, taste, appearance or mouth feel). These interactions may result from physicochemical interactions (structure and binding effects) in the product itself, interactions at the receptor level or cognitive interactions. Many studies have shown that odors can suppress, enhance or have no effect on tastes.
According to the work of Saenz-Navajas et al. (2010) the sweetness of dry wine is closely related to fruity aroma, and that, as sweetness most likely affects the perceptions of astringency and bitterness, these two last percepts are also inversely related to fruity aroma.
13 1.2.4 Temporal evolution of taste and mouth-feel sensations
To distinguish between the various taste and mouthfeel sensations, tasters often concentrate sequentially on the expression, intensity and duration of each attribute. Their temporal response curve is a useful feature in identifying taste sensations. The perceived localization of the sensations in the mouth and on the tongue further aids in affirming taste characterization. Balance is a summary perception, derived from the interaction of sapid and mouth-feel sensations (Jackson, 2014).
Sweetness is usually the most rapidly detected taste attribute. Sensitivity to sweetness occurs optimally at the tip of the tongue. It also tends to be the first taste sensation to show adaptation. The intensity of its perception is reduced in relation to a wine’s acidic or tannic content (Jackson, 2014).
Sourness is also detected rapidly. The rate of adaptation to sourness may be slower, and often generating a lingering aftertaste when pronounced. Acid detection is commonly strongest along the sides of the tongue. This varies considerably among individuals, with some people detecting sourness more distinctly on the back of the lips, or inside of the cheeks. Strongly acidic wines can induce astringency, giving the teeth a rough feel. Both the sour and astringent aspects of markedly acidic wine may be decreased by sweetness and perceptible viscosity (Jackson, 2014).
The detection of bitterness usually follows any perception of sweetness or sourness. It typically takes several seconds to express. Peak intensity may not be reached for 10–15s. After expectoration, the sensation gradually diminishes, but may linger for several minutes. Most bitter-tasting compounds in wine, primarily phenolics, are perceived at the back-central portion of the tongue. In contrast, bitter alkaloids are perceived primarily on the soft palate, and at the front of the tongue. The bitterness of a wine is more difficult to assess accurately when the wine is also distinctly astringent. High levels of astringency may partially mask the perception of bitterness. High sugar contents also reduce the perception of bitterness, a phenomenon well known to those who cannot suffer coffee black (Jackson, 2014).
Following Jackson (2014) astringency is often the last sensation detected. It can take 15 or more seconds for its perceived intensity to develop fully. After expectoration, the sensation slowly declines over a period of several minutes. Astringency is poorly localized, because of the dispersed distribution of free nerve endings throughout the mouth. Because both the perceived intensity and duration of astringency increase with repeat samplings, some judges recommend that astringency be assessed with the first taste. This would give a perception
14 more closely approximating the astringency detected on consumption with food. Others consider that the assessment of astringency should occur only after several samplings, when the mollifying effects of saliva have diminished. Both have justifiable rationales, depending on the intention of the assessment.
The increase in perceived astringency, that can occur when tasting a series of wines, could seriously affect the validity of a wine’s assessment. This is especially true with red wines, for which the first wine in a series often appears the smoothest. Variability in alcohol content can also result in sequence error effects. A similar situation could occur in a series of dry white wines, as well as making a sweeter wine appear overly sweet. These influences are sufficiently well known that tastings are organized to avoid the joint sampling of wines of markedly different character. However, design errors can still have significant effects on well-conceived comparative tastings. The effect of sequence error may be partially offset, in group tasting, by arranging that all tasters sample the wines in random order. In addition, lingering taste effects can be minimized by assuring that adequate palate cleansing occurs between samples (Jackson, 2014).
Although the number of in-mouth sensations is limited, they are particularly important to consumer acceptance. Unlike professionals, consumers seldom dote on the wine’s fragrance. Thus, in-mouth sensations are far more important to their overall impression of wines. Nevertheless, even for connoisseurs, one of the ultimate tests of greatness is the holistic impression of mouth-feel and balance. These are phenomena principally associated with joint gustatory and tactile sensations. Producing a wine with a fine, complex, and interesting fragrance is often a significant challenge for the winemaker. Assuring that the wine also possesses a rich, full and balanced in-mouth sensation is the ultimate achievement (Jackson, 2014).
1.3 Sensory Analysis
1.3.1 Sensory analysis evaluation methods
Sensory evaluation methods may be divided into two broad classes: affective and analytical methods (IFT, 1981) (Fig.1.1). The most common analytical methods of sensory evaluation used in the wine industry are discrimination (or difference) and descriptive methods. Discrimination tests can be used to determine if products are different, if a given wine characteristic is different among samples, or if one product has more of a selected characteristic than another. Experienced panelists can complete discrimination tests.
15
Figure 1.1. Sensory Analysis Evaluation Methods.
1.3.1.1 Discrimination (Difference) Tests
Difference testing is used to determine if different winemaking processing techniques or operations have a sensory impact. As such, difference testing methods generally provide the winemaker with the practical information needed. They are the most feasible for use in a winery environment, and are simple and robust.
The most common for use in the wine industry are the triangle difference test and the duo-trio difference test:
triangle: “Is a particular lot made with rot-compromised fruit different from other lots?” duo-trio: “Is there a sensory difference among wines fermented with different yeasts?” paired comparison: “Does the high VA in this wine impact it sensorially?”
Triangle tests are useful as a multi-purpose test. The taster is required to select the sample which is different. Triangle tests are often preferred, as they require fewer tasters, and there is a greater likelihood that a result will be genuine and not due to a chance effect.
Duo-trio tests are sometimes used instead of triangle tests to compare unknown differences between wines. Tasters are presented with a reference wine, and then two test wines; one
Se
n
sor
y
An
aly
sis E
valu
at
ion
M
et
h
od
s
Affective Methods
Paired Preference
Test
Ranking Test
Hedonic Test
Analytical
Methods
Discrimination
Methods
Triangle Test
Duo-trio Test
Paired Comparison
Test
Same/Different
Test
Descriptive
Methods
16 wine is the same as the reference, and the other is the wine to be tested. Evaluators are asked to identify the sample that is the same as the reference wine.
Paired comparison tests can be used when there is a known difference in chemical composition of the wines (a simple difference test), which requires a sensory assessment. For example, a higher VA is present. But does the wine have a spoilage character? Is the wine more volatile?
A same/different test is similar to the paired comparison test, however, it is used when the difference between two wines is unknown. Evaluators are asked to identify whether they think the two samples presented are the same or different. These tests are easy to set up, but more panel members are required, and evaluators must perform the test at least twice, receiving a different randomized serving order each time (Zoecklein, 1999).
1.3.1.2 Descriptive Tests
Frequently, it is important to know how a wine changes with a new vineyard site, how intense a characteristic is, etc. Discrimination testing, which is easy to use, easy to interpret, and easy for panelists to complete, is initially used to determine that a difference does exist. Such methods cannot provide information about the description of those differences, though. Descriptive evaluation methods are more difficult to complete and interpret, but provide much more information. They provide a quantitative measure of wine characteristics that allows for comparison of intensity between products, and a means of interpretation of these results. Examples of descriptive test methods include quantitative descriptive analysis (QDA®), flavor profile analysis, timeintensity descriptive analysis, and free-choice profiling (Hootman, 1992; Meilgaard et al., 1991; Stone and Sidel, 1985). QDA® is frequently used because it requires less training time than several of the other methods.
1.3.1.3 Affective methods
Commonly-used affective methods include a paired preference test, a preference ranking test, and the hedonic test method (Meilgaard et al., 1991; Stone and Sidel, 1985). The test method must be simple and easy to understand, so the consumers making up the panel will know how to respond.
1. Paired Preference Test: Once a significant difference has been established between two wines, a preference test can be performed. This is useful in determining which wine blend or which yeast fermentation is preferred, for example.
17 2. Ranking Test: If more than two samples are evaluated, a preference ranking test may be completed. Usually three to five samples are the most that can be efficiently ranked by a consumer. This test asks the consumer to order the samples based on preference, with a ranking of “1” meaning most preferred.
3. Hedonic Test: The hedonic scale may be used to determine degree of acceptability of one or more products. This scale is a category-type scale with an odd number (five to nine) categories ranging from “dislike extremely” to “like extremely.” A neutral midpoint (neither like nor dislike) is included. Consumers rate the product on the scale based on their response.
1.3.2 Limitations of sensory analysis evaluation
Control of the human aspect of sensory evaluation is one of the more difficult factors of sensory evaluation. This may be accomplished best by carefully selecting the people that will be participating in the test. Important qualities in a sensory panelist include availability, dependability, interest, objectivity, stability, and acute senses of smell and taste (Hootman, 1992; Meilgaard et al., 1991; Stone and Sidel, 1985).
Unlike instruments, human judgements can easily be affected by psychological or physiological factors. The sensory professional must be aware of these factors and ensure that the chosen procedure and experimental design eliminate or reduce such bias (Kemp et al., 2009).
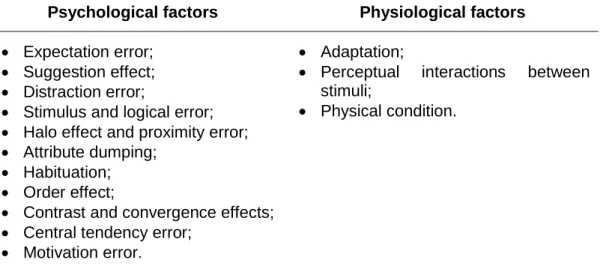
Table 1.1. Human factors affecting sensory analysis (Kemp et al., 2009).
Psychological factors Physiological factors
Expectation error; Suggestion effect; Distraction error;
Stimulus and logical error; Halo effect and proximity error; Attribute dumping;
Habituation; Order effect;
Contrast and convergence effects; Central tendency error;
Motivation error.
Adaptation;
Perceptual interactions between stimuli;
18 When working with assessors from different cultures or geographical location, the sensory professional needs to be aware of the impact that cultural effects can have on sensory data. In some cultures, particular product codes may have significant connotations.
In addition, wine with more than 1000 identified sensory active compounds, has several particular limitations. Our limited understanding lies with the features below, with the multifaceted interactions that occur among the numerous chemical components, and the effect of these interactions on perception:
Adaptation
Individual variability Carry-over effects
Difficulty in distinguishing some sensory components Non-standardized language
Expectations/bias
Differences between “expert” opinion and consumer preferences
1.4 Taster segmentation
The understanding of individual differences in orosensation is of great interest for the wine industry, these differences may represent opportunities for developing new products based on the different responses of individuals.
Special attention should be given when it comes to create consumer/taster segments, as through this procedure we receive information about taste sensitivity and preferences as well (Francis et al., 2015). The most common distinctions are based on different categories linked with demographic, physiological, psychological and taste sensitivities. The segmentation can be achieved usually by simple demographic questionnaires (e.g. with questions aiming to know the gender, age, origin, educational and cultural background etc.) as well as by tests and measurements of the taste functions. However, the most important factor in perception of oral stimuli is genetic variation (Pickering et al., 2008).
1.4.1 Vinotype
The vinotype test is an online wine personalization test (www.vinotype.com) which is principally based on the preferences of the individuals, launched in 2011 (Hanni, 2012). The