Development of a
Synechocystis
chassis: evaluation
of its tolerance to
salinity and
characterization of
an oxygen
consuming device
Pedro Filipe Gonçalves Ferreira
Mestrado em Biologia Celular e Molecular
Departamento de Biologia 2013
Orientador
Paula Tamagnini, Professora Associada, Faculdade de Ciências da
Universidade do Porto
Co-orientador
Catarina Pacheco, Bolseira de Pós-doutoramento, IBMC – Instituto
de Biologia Molecular e Celular
Agradecimentos
Queria agradecer à Professora Paula Tamagnini pela sua orientação neste trabalho, pela disponibilidade apresentada durante todo o processo de escrita e correção desta dissertação e pelas oportunidades que me proporcionou ao longo deste ano. À Catarina Pacheco, minha coorientadora, agradeço por tudo que me ensinou, pelo apoio nos momentos mais difíceis, pela paciência e pela boa disposição que sempre apresentou. E aos elementos do grupo BSM, agradeço pelo bom ambiente de trabalho que me proporcionaram, com uma menção especial para o Paulo Oliveira pela ajuda prestada e conhecimentos transmitidos.
Agradeço também aos meus colegas de mestrado com quem partilhei as aventuras deste ano: ao Francisco, senhor das plantas, à querida Tânia que depois de dois copos já não se lembra do meu nome, à Baldaia por ser uma tótó, à Inês por ter feito de mim o seu Pedro preferido e ao Nuno pelas discussões com Impacto. Sem a vossa amizade este ano não tinha sido a mesma coisa. Um obrigado também para os amigos com quem, infelizmente, nem sempre foi possível passar o tempo que gostaria: os restantes colegas de mestrado, Gnus e amigos de velha data. Pode não ser muito, mas o tempo partilhado convosco é sempre precioso (salta-me à lembrança a semana da queima). E, claro, não podia deixar de agradecer à Mafalda. Por tudo. Um dia sem ti não é um dia de jeito.
Por fim, agradeço aos meus pais e irmão pelo amor, apoio incondicional e por terem feito de mim aquele que sou hoje. Se tiver metade da força de vontade do meu Pai e trabalhar com metade do brio com que sempre vi a minha Mãe fazer as coisas, então não terei dificuldade nenhuma em ultrapassar todos os obstáculos que a vida atravessar no meu caminho.
Abstract
Since water shortage is already a major problem affecting worldwide agricultural productivity, the development of biotechnological applications based on mass cultivation in saline waters is very desirable. Synechocystis sp. PCC 6803 is an attractive phototrophic microorganism to produce hydrogen using electrons derived from water via photosynthesis. However, oxygen naturally released during the oxidation of water dramatically inhibits the activity of hydrogenases. Thus, the design and characterization of novel devices that can modulate the Synechocystis chassis intracellular oxygen levels is of great importance, likewise the characterization and improvement of Synechocystis robustness against adverse salinity conditions.
In this work, Synechocystis salinity tolerance was characterized under four conditions: 12 h light/12 h dark, autotrophic; 12 h light/12 h dark, mixotrophic; 24 h light, autotrophic; and 24 h light, mixotrophic; and the viability of using cells acclimated to salt or supplementing the growing medium with the compatible solute glycine betaine as strategies to further enhance Synechocystis natural tolerance to salinity were tested. Furthermore, an oxygen consuming device based on a laccase protein was introduced into a Synechocystis chassis and its functionality was assessed.
The results showed that the Synechocystis growth rate decreases as the concentration of NaCl in the growth medium increases, being 6% (w/v) NaCl the tolerated NaCl limit, and that the salinity adverse effects on cell growth were more severe with continuous light regimen than under a light / dark regimen. Regarding the strategies to further enhance Synechocystis natural tolerance to salinity, cells acclimated to salt could withstand higher NaCl concentrations, but supplementing the growth medium with glycine betaine did not had any evident effect on the growth of Synechocystis cells. It was also shown that the laccase device was transcribed but no protein activity could be detected using a spectrophotometric assay or a Clark-type O2 electrode. Two new laccase constructs were generated, cloned in a replicative plasmid and introduced into Synechocystis to ascertain the reasons for the absence of activity of the original laccase device.
Keywords: Synechocystis, NaCl, glycine betaine, Oxygen Consuming Device, laccase.
Resumo
Atualmente, um problema que afeta a produtividade agrícola a nível mundial é a escassez de água potável , logo o desenvolvimento de aplicações biotecnológicas que utilizem água salgada é altamente desejável. Synechocystis sp. PCC 6803 é uma bactéria fotoautotrófica que pode ser utilizada para a produção de hidrogénio, usando água como dador de eletrões. No entanto, o oxigénio naturalmente libertado durante a oxidação da água inibe dramaticamente a atividade das hidrogenases. Deste modo, é importante desenhar e caracterizar novos dispositivos moleculares capazes de modular os níveis intracelulares de oxigénio em Synechocystis, assim como caracterizar e melhorar a robustez deste organismo em condições adversas de salinidade.
Neste trabalho, a tolerância de Synechocystis a diferentes concentrações de NaCl foi avaliada em quatro condições: 12 h luz/12 h obscuridade, em autotrofia; 12 h luz/12 h obscuridade, em mixotrofia; luz contínua, em autotrofia; e luz contínua, em mixotrofia. Foi também testada a possibilidade de usar células aclimatadas a uma concentração de sal ou de suplementar o meio de cultura com um soluto compatível -glicina betaína- como estratégias para melhorar a tolerância natural de Synechocystis a condições de salinidade elevada. Para além disso, um módulo sintético de consumo de oxigénio, baseado numa lacase foi introduzido em Synechocystis e a sua funcionalidade foi avaliada.
Os resultados obtidos mostram que o crescimento de Synechocystis diminui à medida que a concentração de NaCl no meio de cultura aumenta, sendo 6% (p/v) NaCl o limite de tolerância apresentado, e que os efeitos provocados pela presença de NaCl são mais nefastos para células em regime de luz contínua do que para células em regime de luz /obscuridade. Em relação às estratégias para melhorar a tolerância natural ao sal apresentada por Synechocystis, verificou-se que células aclimatadas eram capazes de suportar concentrações de NaCl mais altas, mas que a suplementação do meio com glicina betaína não produziu qualquer efeito evidente. Foi, também, mostrado que apesar de o módulo de consumo de oxigénio baseado na lacase ser transcrito, não se detetou nenhuma atividade enzimática (usando tanto um método espectrofotométrico como um elétrodo de oxigénio). Duas novas construções baseadas na lacase foram geradas, clonadas num plasmídeo replicativo e introduzidas em Synechocystis com o objetivo de identificar as razões pelas quais não foi detetada qualquer actividade.
Palavras-chave: Synechocystis, NaCl, glicina betaína, Módulo de Consumo de Oxigénio, Lacase.
Table of Contents
AGRADECIMENTOS ... III ABSTRACT ... IV RESUMO ... V TABLE OF CONTENTS ... VI LIST OF TABLES AND FIGURES ... VIII LIST OF ABBREVIATIONS ... X
1. INTRODUCTION ... 1
1.1 Biofuels and cyanobacteria ... 1
1.2 Synthetic Biology ... 2
1.3 Synechocystis as a photoautotrophic chassis ... 2
1.4 Oxygen Consuming Device: Laccase ... 3
1.5 Cyanobacteria salinity acclimation mechanisms... 4
1.6 Objectives ... 6
2. MATERIALS AND METHODS ... 8
2.1 Organisms and standard growth conditions ... 8
2.2 Plasmids used in this work ... 8
2.3 DNA extraction ... 8
2.4 Agarose gel electrophoresis ... 9
2.5 Ligation reactions, E. coli DH5α Transformation and DNA recovery ... 9
2.6 RNA extraction ... 9
2.7 Transcription analysis by PCR ... 10
2.8 Natural transformation of Synechocystis sp. PCC 6803 with pSNnKPn-Lac plasmids ... 10
2.9 Confirmation of SNnKPn-Lac mutants segregation ... 11
2.10 Protein extraction and SDS-PAGE ... 12
2.11 Laccase Activity assays ... 12
2.12 Cloning strategy – pAWG1.1-Lac and pAWG1.1-LacHist ... 12
2.13 Synechocystis conjugation ... 13
2.14 Salinity tolerance growth experiments ... 14
2.15 Salinity acclimation growth experiments ... 14
2.16 Glycine betaine supplemented growth experiments ... 15
2.17 Different medium growth experiments ... 15
3. RESULTS ... 17
3.1 Characterization of Synechocystis tolerance to salinity ... 17
3.1.1 Synechocystis growth in different media ... 17
3.1.2 Synechocystis growth under different NaCl concentrations ... 18
3.1.3 Growth of Synechocystis cells acclimated to salt ... 20
3.1.4 Synechocystis growth in the presence of the compatible solute glycine betaine ... 21
3.2 Characterization of an Oxygen Consuming Device based on Laccase ... 22
3.2.1 Mutants generation ... 22
3.2.2 Laccase activity assays ... 24
3.2.3 Transcriptional analysis of the laccase device ... 26
4. DISCUSSION AND FUTURE PROSPECTIVES ... 29
4.1 Synechocystis tolerance to salinity ... 29
4.2 Characterization of an Oxygen Consuming Device based on Laccase ... 31
5. CONCLUSIONS ... 34
List of Tables and Figures
Table 1 – Plasmids used in this work ... 8 Table 2 – Oligonucleotide primers used in this work ... 11
Figure 1 – Schematic view on dynamics of salt acclimation in Synechocystis (Hagemann, 2011). ... 5 Figure 2 – Growth curves of Synechocystis in different media. Cultures were grown with a 12 h light (25 µE m−2 s−1)/12 h dark regimen, in an orbital shaker at 100 r.p.m., at 30 ºC. Cell
growth was determined by monitoring the optical density of the culture at 730 nm. Mean ± S.D., n=3. ... 17 Figure 3 – Growth curves of Synechocystis under different salinity conditions. Cultures were grown in BG11 medium with a 12 h light (25 µE m−2 s−1)/12h dark regimen, in an orbital
shaker at 100 r.p.m., at 30 ºC. Cell growth was determined by monitoring the optical density of the culture at 730 nm. Mean ± S.D., n=3. ... 18 Figure 4 – Growth curves of Synechocystis under different salinity conditions. Cultures were grown in BG11 medium, under continuous light (25 µE m−2 s−1) regimen, in an orbital shaker
at 100 r.p.m., at 30 ºC. Cell growth was determined by monitoring the optical density of the culture at 730 nm. Mean ± S.D., n=3. ... 19 Figure 5 – Growth curves of Synechocystis under different salinity conditions. Cultures were grown in BG11 medium supplemented with glucose 5 mM, with a 12 h light (25 µE m−2 s−1)/12
h dark regimen (A) or with a 24h light (25 µE m−2 s−1) regimen (B), in an orbital shaker at 100
r.p.m., at 30 ºC. Cell growth was determined by monitoring the optical density of the culture at 730 nm. Mean ± S.D., n=3. ... 20 Figure 6 – Growth curves of Synechocystis acclimated (dashed lines: AC) and non-acclimated (full lines: NC) cells under different salinity conditions. Cultures were grown in BG11 medium with a 12 h light (25 µE m−2 s−1)/12 h dark regimen, in an orbital shaker at 100 r.p.m., at 30
ºC. Cell growth was determined by monitoring the optical density of the culture at 730 nm. Mean ± S.D., n=3. ... 21 Figure 7 – Growth curves of Synechocystis in the presence of glycine betaine. Cultures were grown in BG11 supplemented with 5% (w/v) NaCl, with a 12 h light (25 µE m−2 s−1)/12 h dark regimen, in an orbital shaker at 100 r.p.m., at 30 ºC. Cell growth was determined by monitoring the optical density of the culture at 730 nm. Mean ± S.D., n=2. ... 22 Figure 8 - Strategy to insert the synthetic Laccase device into the integrative vector. (A) Representation of pSNnK plasmid showing the most relevant components (KmR - gene
conferring Kanamycin resistance; AmpR - gene conferring ampicillin resistance; TT –
transcription double terminator); (B) Representation of the synthetic Laccase device; (C) Resultant vector after the insertion of the Laccase device into a pSNnK plasmid. ... 23 Figure 9 - Schematic representation of the double homologous recombination event. KmR -
gene conferring Kanamycin resistance; ; AmpR - gene conferring ampicillin resistance; TT –
transcription double terminator; ... 23 Figure 10 – DNA electrophoresis of PCR products confirming the full segregation of
Synechocystis SNnKPn-Lac mutants. The PCR reactions were performed using primers
external to each neutral site (A) and with primers within the ORF corresponding to each neutral site (B). Negative controls were included (-, absence of template). The expected sizes of the PCR products are shown below the figures; M1 - Molecular weight marker, GeneRulerTM 1 kb DNA Ladder(Fermentas); M2 – Molecular weight marker, GeneRuler™
DNA Ladder Mix (Fermentas); M3 - Molecular weight marker, GeneRulerTM 50 bp DNA
Ladder (Fermentas). ... 24 Figure 11 – 10% (w/v) SDS-PAGE gel stained with Coomassie blue. SDS-PAGE protein analysis from Synechocystis SN5KP6-LAC #1 mutant and E. coli transformed with pSB1A3-F2620-LAC. Equal amounts of proteins (20 µg) were applied in each lane. The arrow points the overexpressed Laccase protein; M - Precision Plus Protein™ All Blue Standards (Bio Rad). ... 25 Figure 12 – Oxygen measurements using a Clark-type O2 electrode. A) Negative control without
protein; B) Oxygen consumption after addition of 100 µL of Synechocystis proteins extracted from cells collected at OD730~5; The green arrow indicates the addition of the Synechocystis
protein extract and the blue arrow indicates the addition of ABTS. ... 25 Figure 13 – Electrophoresis gel showing the amplification by PCR of Laccase cDNA. Negative control (-, absence of template) and positive control (+, pSB1A3-F2620-LAC) are indicated. M – Molecular weight marker, GeneRuler™ DNA Ladder Mix (Fermentas); ... 26
List of Abbreviations
ABTS - 2,2’-azinobis(3-ethylbenzthiazolinesulfonic acid Amp - Ampicillin
AmpR - Resistance to ampicillin BCA - Bicinchoninic acid
bp - Base pairs
cDNA - Complementary DNA CDS - Coding DNA sequence Cm - Chloramphenicol
CmR - Resistance to chloramphenicol CRP - cAMP receptor protein
DNA - Deoxyribonucleic acid
dNTP - Deoxyribonucleotide triphosphate EDTA - Ethylenediaminetetraacetic acid GG - Glucosyl glycerol
gTME - Global transcription machinery engineering kb - Kilobase pairs
kDa - Kilodaltons Km - Kanamycin
KmR - Resistance to kanamycin LB - Lysogeny broth
mRNA - Messenger RNA
OCD - Oxygen consuming device OD - Optical densety
ON - Overnight
ORF - Open reading frame PCC - Pasteur culture collection PCR - Polymerase chain reaction RBS - Ribossome binding site RNA - Ribonucleic acid
r.p.m. - Revolutions per minute RT - Room temperature
RT-PCR - Reverse transcriptase PCR S.D. - Standard deviation
TAE - Buffer solution containing a mixture of Tris base, acetic acide and EDTA TT - Double transcriptional terminator
UV - Ultraviolet WT - Wild-type
1. Introduction
1.1 Biofuels and cyanobacteria
Depletion of the oil stocks combined with the increasing worldwide energy demand and the escalating price of petroleum have generated an interest toward biofuels. Biofuels are fuels generated from biological material using energy from carbon fixation (Lee & Lavoie, 2013) First-generation biofuels are produced directly from biomass. Mostly only sugarcane or corn are used for the production of first-generation bioethanol and soybean is the major feedstock for the production of first-generation biodiesel. The majority of first-generation biofuels are produced directly from food crops and thus have to compete with agriculture for arable land, fresh water and fertilizers. This gave rise to the second-generation biofuels which are made mostly from lignocellulosic biomass. However, converting the woody biomass into fermentable sugars requires costly technologies, meaning that second-generation biofuels cannot yet be produced economically on a large scale. Therefore, there is a need to develop third-generation biofuel devoid of the major drawbacks associated with first and second generation biofuel. The third-generation biofuels are derived from photosynthetic microorganisms and are considered to be a viable alternative energy resource (Dragone et al., 2010, Lee & Lavoie, 2013). Thus, although in an early development stage, the use of photosynthetic organisms offers an alternative approach to efficiently convert solar energy into energy carriers in a process that captures CO2 from the atmosphere, which is of great interest due to the advent of global warming (Ducat et al., 2011). Furthermore, in 2011, the International Energy Agency assert that the development of affordable, inexhaustible and clean solar energy technologies will increase countries energy security, enhance sustainability, reduce pollution, lower the costs of mitigating climate change, and keep fossil fuel prices lower than otherwise. Hence the additional costs of the incentives for early deployment should be considered learning investments (International Energy Agency, 2011).
Cyanobacteria are prokaryotic photosynthetic microorganisms, unicellular or filamentous, present in a vast range of environments with significant fluctuations in temperature, salinity and pH. Cyanobacteria are capable of converting solar energy into biomass at efficiencies that generally exceed terrestrial plants (Dismukes et al., 2008), have faster growth rates (compared to plants), are relatively easy to genetically engineer (compared to algae and plants) (Angermayr et al., 2009) and can be manipulated to produce transportable fuel products like alcohols (ethanol and isobutanol), alkanes, biodiesel or hydrogen (Ducat et al., 2011). Altogether these
characteristics make cyanobacteria stand out from all other organisms that can be used in biotechnological applications to produce third-generation biofuels.
Biohydrogen is one of the most promising biofuels since hydrogen is easily converted to electricity in fuel cells, releases a large amount of energy per unit mass, and generates no air pollutants (Yu & Takahashi, 2007). Hydrogen evolution can be achieved under light irradiation by phototrophic organisms like cyanobacteria. However, using wild-type strains, H2 can only be evolved at levels that are not sufficient for its commercial use as a competitive energy carrier. One of the several bottlenecks that have been identified is the fact that the enzymes responsible for the H2 evolution (nitrogenase and/or hydrogenase) are highly sensitive to O2 (Tamagnini et al., 2007). Being cyanobacteria oxygen phototrophic organisms, they release significant amounts of molecular oxygen during photosynthesis. Consequently, it is important to obtain novel devices that can operate in a cyanobacteria cell factory and modulate its intracellular oxygen levels.
1.2 Synthetic Biology
Recently, novel strategies in molecular biology have been developed, namely: the design and construction of new biological parts, devices, and systems that do not exist in nature, as well as the redesign of existing biological systems for useful purposes. This is the motto of synthetic biology (http://syntheticbiology.org). Basic principles of synthetic biology are the use of standardized and well-characterized building blocks, hierarchical design of nature-inspired, artificial genetic circuits and proteins in silico, and use of chemical DNA synthesis which allows production of DNA sequences that are not found in nature (Huang et al., 2010). In this way, synthetic biology aims at shaping biology into a predictable discipline, where design principles govern rational engineering projects (Endy, 2005). Cyanobacterial synthetic biology community has the goal to build up a repository of standard genetic parts that can speed up successful genetic engineering of cyanobacterial strains for the sustainable production of valuable products (Lindblad et al., 2012).
1.3 Synechocystis as a photoautotrophic chassis
The synthetic parts/devices must be integrated into an organism – the chassis – to perform the designated task they were design to accomplish. Synechocystis sp. PCC 6803 (henceforth referred to as Synechocystis) is the most well studied cyanobacteria, is unicellular, has simple nutritional requirements, has a medium size and completely sequenced genome, is naturally transformable, with many molecular tools for its
manipulation available (Angermayr et al., 2009). Moreover, genome-scale metabolic models for this organism are also available, constituting important tools to predict systems responses to changes (e.g. Montagud et al., 2011). These characteristics make this strain the preferential chassis to be used in synthetic biology photoautotrophic applications.
In order to genetically engineer a Synechocystis chassis one can make use of the fact that this cyanobacteria is naturally transformable with exogenous DNA. The incorporation of the DNA into the genome occurs by means of double homologous recombination, being the single integrative crossover a phenomenon with very low frequency, rarely occurring in Synechocystis (Williams, 1988). This allows the generation of deletion/disruption mutants or the integration of synthetic devices into the chassis, since a heterologous DNA fragment, flanked on both sites by DNA sequences homologous to the chromosome, can be introduced into a particular genome site (Williams, 1988). Since Synechocystis has various copies of the chromosome per cell, mutants have to be subjected to consecutive increments of the selection pressure (antibiotic), which is a time consuming task. Only in this way one can guarantee that all copies of the chromosome are mutated and that full segregation has been achieved. The genome site selected can be a gene sequence that would be disrupted or deleted, or a neutral site that would allow the integration of a synthetic device without disrupting cell viability/fitness. Previously in the research group where this project took place, the Synechocystis genome was screened for the identification of neutral sites. Based on this analysis, plasmids for the integration of synthetic devices into the Synechocystis genomic neutral sites were constructed and neutral site functionality was assessed (Pinto, 2013).
1.4 Oxygen Consuming Device: Laccase
The development of synthetic oxygen consuming devices is highly desirable in applications where low intracellular oxygen concentration is required, as is the case of hydrogen production in a cyanobacterial cell factory. These devices can be based on existing proteins, such as phenoloxidases, that couple the oxidation of the substrate with the reduction of oxygen to water. Laccase (EC 1.10.3.2) is one of those proteins: It belongs to the multicopper oxidase family that couples the four-electron reduction of dioxygen to water with the oxidation of substrates (Solomon et al., 1996). Among the identified laccase proteins, Escherichia coli CueO, a bacterial laccase involved in copper tolerance (Sharma et al., 2007), is a strong candidate to be used as a biological oxygen consuming device due to its characterization (Kim et al., 2001).
In order to produce an oxygen consuming device, a set of biological parts must be characterized in the host organism of choice since their function outside the organism of original use may differ significantly. For that reason, Huang et al. (2010) developed and characterized a set of constitutive and repressible/inducible promoters specific to the cyanobacterium Synechocystis. Thus, the developed and characterized biological parts by Huang et al. (2010) are the best option to be used in synthetic biology applications, like the oxygen consuming device, that are intended to be incorporated in a Synechocystis chassis.
1.5 Cyanobacteria salinity acclimation mechanisms
The development of biotechnological applications based on mass cultivation in saline waters is very desirable, since water shortage is already a major problem affecting worldwide agricultural productivity (Pandhal et al., 2008). However, mass cultivation in saline waters can be a challenge since the presence of high NaCl concentrations can impair the growth and metabolism of the chosen biological chassis. For that reason, there is a need for, firstly, characterize a chassis in regard to its tolerance to salinity, and, secondly, develop strategies to further improve its natural robustness. Only this way it will be possible to develop a chassis with a stable, consistent, controllable and predictable performance and capable of being mass cultivated in saline waters.
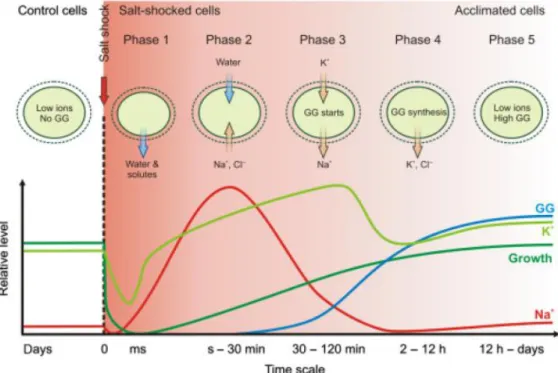
It is know that the basic mechanisms of Synechocystis salt acclimation involves the active extrusion of inorganic ions by Na+ exports and Cl- exporters and the accumulation of compatible solutes (Hagemann, 2011). After a sudden salt stress, the cells immediately shrink because they lose water and many solutes from the cytoplasm (Blumwald et al., 1983). The shrinkage is reversed once the low osmotic potential of the cytoplasm is increased via the passive influx of external salt, such as Na+ and Cl -(Reed et al., 1985). This process lasts for several minutes and, when completed, the cell volume is restored, but the high internal salt load inhibits cellular metabolism. At this point, occurs an exchange of the toxic Na+ for K+ during approximately an hour (Reed et al., 1985). This exchange is mainly caused by the activation of pre-existing ion-transporters. Since this newly established ion composition is more compatible with cellular metabolism, photosynthesis is reactivated as well as gene expression. The compatible solute glucosyl glycerol (GG) synthesis starts at this point. Compatible solutes are a functional group of low molecular mass, organic compounds that do not disturb cellular metabolism at the high molar concentrations necessary to equilibrate osmotic conditions (Brown, 1976). The simultaneous exchange of inorganic ions by
compatible solutes leads to cells where ion concentrations return almost to the initial levels, and the compatible solute pool is mainly responsible for maintenance of the osmotic potential and turgor pressure. This allows a reorganization of the gene expression and activity pattern of the whole cell, which is necessary in order to the cells cope with the higher salinities in the long run. Depending on the amount of salt, this phase can last 3-8 h (Hagemann & Erdmann, 1994, Marin et al., 2004). After 24h or more of salt exposure, cells are fully salt-acclimated. This cells are characterized by low internal inorganic ion concentrations and high levels of GG, according to the demands of the external salt concentrations. Depending on the amount of salt, the rates of growth and photosynthesis are somewhat lower (Hagemann, 2011). The dynamics of salt acclimation in Synechocystis are represented in Figure 1.
Figure 1 – Schematic view on dynamics of salt acclimation in Synechocystis (Hagemann, 2011).
In general terms, cyanobacteria synthetize different compatible solutes depending on their environment. Freshwater strains synthetize mainly sucrose and/or trehalose, marine strains synthetize mainly glucosylglycerol and/or glucosylglycerate and the hypersaline strains synthetize mainly glycine betaine (Klähn & Hagemann, 2011). Among cyanobacteria, Aphanothece halophytica possesses the ability to grow at high external NaCl concentrations, up to 3 M NaCl (Takabe et al., 1988). To withstand such extreme salinities, this cyanobacteria synthetizes the compatible solute glycine betaine (Hagemann, 2011). The synthesis is catalyzed by two N-Methyltransferases (ApGSMT and ApDMT) and use glycine as substrate (Waditee et al., 2003). The co-expression of the two enzymes conferred salt tolerance to the freshwater Synechococcus sp. PCC
7942 sufficient for it to be able to grow in seawater (Waditee et al., 2005) and conferred improved growth and more tolerance to salinity to Anabaena sp. PCC 7120 (Waditee-Sirisattha et al., 2012).
1.6 Objectives
The goals of this work were: (i) to evaluate Synechocystis tolerance to salinity, obtaining valuable data that will constitute the starting point for the engineering of synthetic devices that will be used to improve the robustness of a Synechocystis chassis towards salinity; (ii) to test the viability of using acclimated to salt cells or supplementing the growing medium with the compatible solute glycine betaine as strategies to further enhance Synechocystis natural tolerance to salinity (iii) characterize an oxygen consuming device designed to modulate the oxygen intracellular levels of Synechocystis. The device was based on the E. coli cueO gene and biological parts characterized by Huang et al. (2010).
2. Materials and Methods
2.1 Organisms and standard growth conditions
Cyanobacterium Synechocystis sp. PCC 6803 (obtained from the Pasteur Culture Collection, Paris, France)was maintained in BG11 medium(Stanier et al., 1971) in an orbital shaker at 100 r.p.m, at 30 °C, and in a 12 h light (25 µE m−2 s−1) /12 h dark cycles, or in continuous light. Cosine-corrected irradiance was measured by using a quantum metre (Dual Solar/Electric Quantum Meter, Spectrum Tecnologies, Inc.). SNnKPn-Lac mutants were maintained in liquid BG11 medium supplemented with kanamycin (Km, 50 µg mL-1). SRLac and SRLac-Histag mutants were maintained in both liquid and solid BG11 medium supplemented with chloramphenicol (Cm, 15 µg mL-1). For solid medium, BG11 was supplemented with 1.5% (w/v) Noble agar (Difco). E. coli DH5α (Stratagene) and E. coli HB101 were used for cloning and conjugation purposes. E. coli transformants were cultivated at 37 ºC in Lysogenic-Broth (LB) medium (Bertani, 1951) or LB-Agar medium (LB with 1.5% (w/v) agar; Cultimed) supplemented with 100 µg ampicillin mL-1 or 34 µg chloramphenicol mL-1 when required.
2.2 Plasmids used in this work
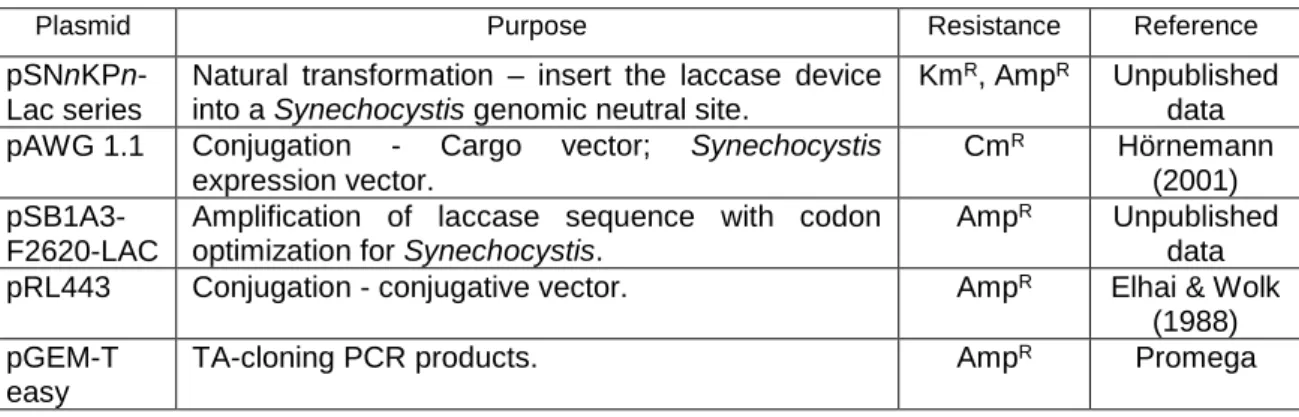
Table 1 – Plasmids used in this work
Plasmid Purpose Resistance Reference
pSNnKPn-Lac series
Natural transformation – insert the laccase device into a Synechocystis genomic neutral site.
KmR, AmpR Unpublished
data pAWG 1.1 Conjugation - Cargo vector; Synechocystis
expression vector.
CmR Hörnemann
(2001)
pSB1A3-F2620-LAC
Amplification of laccase sequence with codon optimization for Synechocystis.
AmpR Unpublished
data pRL443 Conjugation - conjugative vector. AmpR Elhai & Wolk
(1988) pGEM-T
easy
TA-cloning PCR products. AmpR Promega
2.3 DNA extraction
Cyanobacterial genomic DNA was extracted using the phenol/chloroform method (Tamagnini et al., 1997). Briefly, Synechocystis cells were resuspended in 50 mM Tris-HCl, pH 8.0, with 10 mM EDTA and disrupted by adding 0.3 g of 0.6-mm-diameter glass beads, 25 µl of 10% (w/v) sodium dodecyl sulfate (SDS), and 500 µl of phenol (pH 7.0) - chloroform (1:1 (v/v)) and vortexing at a high speed. The liquid phases were separated by centrifugation at 13000 g for 10 min, and the upper aqueous phase was extracted twice with an equal volume of chloroform. The DNA was precipitated with
1/10 vol of 3 M sodium acetate (pH 5.2) and 2.5 vol of ice cold 100% (v/v) ethanol at -80 °C for 1 hour before being washed with ice cold 70% (v/v) ethanol, dried, and resuspended in water. The extracted DNA was quantified using a Nanodrop ND-1000 Spectrophotometer (Nanodrop Technologies) and checked by agarose gel electrophoresis (see section 2.4).
2.4 Agarose gel electrophoresis
Nucleic acids were separated by 1% (w/v) agarose (Pronadisa) gel electrophoresis in 1x TAE buffer (Sambrook et al., 2001) supplemented with 0.5 μg mL-1 ethidium bromide to allow visualization of the DNA bands under UV light. The GeneRuler™ DNA Ladder Mix (Fermentas), GeneRulerTM 1 kb DNA Ladder or GeneRulerTM 50 bp DNA Ladder (Fermentas) were used as molecular markers.
2.5 Ligation reactions, E. coli DH5α transformation and DNA
recovery
The ligation reaction (10 μL) was carried out using the T4 DNA Ligase (Fermentas). The vector:insert ratio used was 1:3, and the reaction was incubated overnight (ON) at room temperature (RT), using a reaction without the insert as a negative control. 50 μL of DH5α chemically competent cells were mixed with half the volume of a ligation reaction (5 μL). After a 30 min incubation on ice, the mixture of competent bacteria and DNA was heat-shocked at 42 °C for 90 s, and placed back on ice for 2 min.800 µL of LB medium was added to the mixture and the cells were left to recover for 30 min at 37 ºC. The cell suspensions were then centrifuged at 13000 g for 1 min at RT, and the supernatants were removed. The cells were resuspended in the remainder volume, and were plated onto LB-agar supplemented with 100 μg of ampicillin mL-1 to select the transformants. The plates were incubated ON at 37 ºC. To recover the DNA, single isolated colonies were picked to inoculate 5 mL of LB medium supplemented with 100 μg of ampicillin mL-1. Cultures were grown ON at 37 ºC with vigorous shaking (200 r.p.m.). Plasmid DNA was isolated using the GenEluteTM Plasmid miniprep Kit (Sigma), starting with 3 mL of culture and following the manufacturer’s instructions.
2.6 RNA extraction
For RNA extraction, the TRIzol® Reagent (Ambion) was used in combination with the PurelinkTM RNA Mini Kit (Ambion). Briefly, the cells were disrupted in TRIzol containing 0.2 g of 0.2 mm-diameter glass beads (acid washed, Sigma) using a
FastPrep®-24 (MP Biomedicals) (2 × 60 s at a setting of 4.0 m s-1) and the following extraction steps were performed according to the manufacturer’s instructions. The RNA samples were treated with On-column PureLink® DNase for 1.5 h at 25 ºC, following the manufacturer’s instructions. RNA was quantified on a NanoDrop ND-1000 spectrophotometer (NanoDrop Technologies, Inc.) and the integrity was checked by electrophoresis (see section 2.4). The absence of genomic DNA contamination was checked by PCR, in 20 µL reaction mixtures containing: 0.5 U of GoTaq DNA Polymerase (Promega), 1 x GoTaq buffer, 50 µM of each deoxyribonucleotide triphosphate (dNTP), 1 µM of each rnpB primer (Table 2), and 2 µL total RNA. The PCR profile was: 3 min at 95 ºC followed by 25 cycles of 15 s at 95 ºC, 20 s at 56 ºC and 20 s at 72 ºC, and a final extension at 72 ºC for 5 min. Amplification products were run on agarose gel electrophoresis (see section 2.4).
2.7 Transcription analysis by PCR
For cDNA synthesis, 1 µg of total RNA was transcribed with the iScriptTM Reverse Transcription Supermix for RT-qPCR (Bio-Rad) in a final volume of 20 µL, following the manufacturer’s instructions. A control PCR using the rnpB primers was performed using 2 µL of cDNA as template and the same reaction composition and PCR program described in section 2.6. The PCRs reactions with the RT_Lac primers (Table 2) contained 0.5 U of GoTaq DNA Polymerase (Promega), 1 x GoTaq buffer, 50 µM of each dNTP, 0.5 µM of primer, and 2 µL of template cDNA. The PCR profile was: 3 min at 95 ºC followed by 30 cycles of 15 s at 95 ºC, 20 s at 56 ºC and 20 s at 72 ºC and a final extension at 72 ºC for 5 min. Negative controls (no template cDNA) and positive control (pSB1A3-F2620-LAC plasmid) were included. Amplification products were run on agarose gel electrophoresis (see section 2.4).
2.8 Natural transformation of Synechocystis sp. PCC 6803 with
pSNnKPn-Lac plasmids
Synechocystis was transformed using a method based on a procedure described by Williams (1988). Briefly, cultures were grown in BG11 medium at 30 °C, under continuous light (25 µE m−2 s−1), to OD730~0.5. Cells were harvested by centrifugation at 1500 g for 8 min and resuspended in 1/5 vol of BG11 medium. A 500 µL aliquot of these cells was incubated with 10 µg of pSNnKPn-Lac plasmid for 5 h, in light at 25 ºC. Cells were then spread onto Immobilon-NC membranes (0.45 µm pore size, 82 mm, Millipore) resting on solid BG11 plates, at 25 °C in a 16 h light / 8 h dark regimen, and after 24 h were transferred to selective plates containing 10 µg kanamycin mL−1.
Transformants were observed after 1–2 weeks. For complete segregation, Km-resistant colonies were grown at increasing Km concentrations (25 and 50 µg mL−1) and then transferred to liquid medium and subjected to increasing Km concentrations up to 200 µg mL−1.
2.9 Confirmation of SNnKPn-Lac mutants segregation
SNnKPn-Lac mutants genomic DNA was extracted as described in 2.3 and complete segregation was confirmed by PCR using two sets of primers (Table 2): a set of external primers (N5.5O and N5.3O or N16.5O and N16.3O) that bind in the respective flanking regions used for the double homologous recombination; and another set of internal primers (N5F and N5R or N16F and N16R) that bind to an internal region of the respective neutral site. The PCR reaction mixtures contained: 0.5 U of GoTaq DNA Polymerase (Promega), 1 x GoTaq buffer, 50 µM of each dNTP, 1 µM of each primer, and 10 ng of genomic DNA. The PCR profile with the external primers was 5 min at 95 ºC followed by 30 cycles of 1 min at 95 ºC, 1 min at 53 ºC and 5 min at 72 ºC, and a final extension at 72 ºC for 10 min. The PCR profile with the internal primers was 5 min at 95 ºC followed by 30 cycles of 30 s at 95 ºC, 30 s at 50 ºC and 20 s at 72 ºC, and a final extension at 72 ºC for 7 min. The amplification products were checked by agarose gel electrophoresis (see section 2.4).
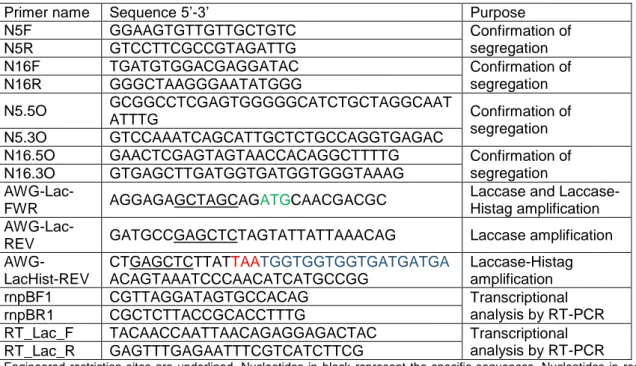
Table 2: Oligonucleotide primers used in this work
Primer name Sequence 5’-3’ Purpose N5F GGAAGTGTTGTTGCTGTC Confirmation of segregation N5R GTCCTTCGCCGTAGATTG N16F TGATGTGGACGAGGATAC Confirmation of segregation N16R GGGCTAAGGGAATATGGG N5.5O GCGGCCTCGAGTGGGGGCATCTGCTAGGCAAT ATTTG Confirmation of segregation N5.3O GTCCAAATCAGCATTGCTCTGCCAGGTGAGAC
N16.5O GAACTCGAGTAGTAACCACAGGCTTTTG Confirmation of segregation N16.3O GTGAGCTTGATGGTGATGGTGGGTAAAG
AWG-Lac-FWR AGGAGAGCTAGCAGATGCAACGACGC
Laccase and Laccase-Histag amplification
AWG-Lac-REV GATGCCGAGCTCTAGTATTATTAAACAG Laccase amplification
AWG-LacHist-REV
CTGAGCTCTTATTAATGGTGGTGGTGATGATGA ACAGTAAATCCCAACATCATGCCGG Laccase-Histag amplification rnpBF1 CGTTAGGATAGTGCCACAG Transcriptional analysis by RT-PCR rnpBR1 CGCTCTTACCGCACCTTTG
RT_Lac_F TACAACCAATTAACAGAGGAGACTAC Transcriptional analysis by RT-PCR RT_Lac_R GAGTTTGAGAATTTCGTCATCTTCG
Engineered restriction sites are underlined. Nucleotides in black represent the specific sequences. Nucleotides in red mark the stop codon. Nucleotides in green mark the start codon. Nucleotides in blue mark the Histidine-tag sequence.
2.10 Protein extraction and SDS-PAGE
Cells were collected by centrifugation at 3850 g for 10 min at RT, resuspended in 50 mM potassium phosphate buffer (pH 7.0) supplemented with a cocktail of protease inhibitors (cOmplete Mini, EDTA free, Roche) in a 1:20 ratio, and mixed with 0.3 g of 0.6-mm-diameter glass beads. The cells were then disrupted using a FastPrep® -24 (MP Biomedicals) (3 × 60 s at a setting of 4.0 m s-1). The cell debris were centrifuged for 10 min at 16000 g and 4 ºC and stored at -20 ºC. Total protein content was determined using the BCA Protein Assay kit (Thermo Scientific) according to manufacturer’s instructions. Protein samples were denaturated upon heating at 90 ºC and were separated by SDS-PAGE with a 10% (w/v) running gel and a 3% (w/v) stacking gel following a standard protocol (Laemmli, 1970). After electrophoresis, proteins were visualized with colloidal Coomassie blue staining (Sigma).
2.11 Laccase Activity assays
Laccase activity was assessed spectrophotometrically and by measuring oxygen consumption (Kim et al., 2001). The spectrometric assay was carried out by monitoring the absorbance increase from oxidation of 2,2’-azinobis(3-ethylbenzthiazolinesulfonic acid) (ABTS) at 420 nm using a Shimadzu UVmini-1240 spectrophotometer. Assays were typically carried out at 30 ºC in a 500 µL solution of acetate buffer (50 mM, pH 5), ABTS (3 mM) and protein extract with a copper (1 mM) overload. The amount of protein used was adjusted to obtain a linear kinetics. The oxygen consumption assay was carried out using a Clark-type O2 electrode (Oxygraph Plus System, Hansatech-Instruments). The oxidase activity was measured using ABTS as the electron donor. Activity assays were typically carried out for 5 min at 30 ºC, in a solution of 1 mL with the composition described above.
2.12 Cloning strategy – pAWG1.1-Lac and pAWG1.1-LacHist
pSB1A3-F2620-LAC plasmid was used as template to amplify, through PCR, the laccase coding sequence, in order to generate two constructs: one containing the laccase CDS, the other containing laccase cds plus a hexa histidine-tag sequence at the C-terminus of the protein. The PCRs were performed using the primers AWG-Lac-FWR, AWG-Lac-REV, AWG-LacHist-REV listed in Table 2. The PCR reactions were composed by: 0.5 U of GoTaq DNA Polymerase (Promega), 1 x GoTaq buffer, 50µ
M of each dNTP, 1 µM of each primer and 1 µL of template. The PCR programs were: one cycle of 95 ºC for 3 min, 30 cycles of 30 s at 95 ºC, 30 s at either 61 ºC (Laccase) or 53 ºC (Laccase His-tag) and 1 min and 40 s, followed by an extension at 72 ºC for 5min. The amplification products were separated by agarose gel electrophoresis (see section 2.4) and purified using the NZY Gelpure Kit (NZY tech), according to the manufacturer’s instructions. The purified products were then TA-cloned in pGEM-T easy (Promega). Chemically competent E. coli DH5α cells were transformed with the ligation reaction and restriction analysis was performed with Eco RI (Fermentas) for positive clones confirmation. In each case, two positive clones were chosen to be sequenced (STAB Vida) with universal M13 primers, to check for the absence of errors in the inserts nucleotide sequence. Analysis of sequence homology was performed using the multiple sequence alignment program Clustal Omega (Goujon et al., 2010, Sievers et al., 2011). For each construct, one error-free pGEM + Lac plasmid was double digested with SacI (Fermentas) and NheI (Fermentas) to excise the respective laccase fragment. The restriction reactions were carried out for 3 h at 37 ºC before heat-inactivating the enzymes at 65 °C for 20 min. The digested products were quantified using a Nanodrop ND-1000 Spectrophotometer (Thermo Scientific) and checked by agarose gel electrophoresis (see section 2.4). The purified laccase fragments were then directional cloned in the pAWG 1.1 (also digested with SacI and
NheI as described above) downstream of
the inducible copper-responsive petE
promoter
and E. coli DH5α cells were transformed with the ligation products. For each construct, single isolated colonies were picked to inoculate 5 mL of LB medium supplemented with 34 μg of chloramphenicol mL-1. Restriction analyses were performed with EcoRI (Fermentas) for positive clones confirmation. One positive clone of each construct was chosen to transform Synechocystis through conjugation (see section 2.13). All ligation reactions, E. coli DH5α transformations and DNA recoveries were done as described in 2.5.2.13 Synechocystis conjugation
This procedure was based in Elhai & Wolk (1988). For each Synechocystis conjugation three cell cultures were used: an E. coli DH5α culture with cargo plasmid (either pAWG-Lac or pAWG-LacHist, CmR); an E. coli HB101 culture with conjugative plasmid (pRL443, AmpR); and a Synechocystis thick culture. Both E. coli cultures were at OD600 = 1.0. 100 mL of E. coli cultures were centrifuged at 1350 g for 10 min at RT and the cell pellets resuspended in 50 mL fresh LB medium without antibiotics. Then both E. coli cultures were mixed and centrifuged again at 1350 g for 10 min at RT and the cell pellets resuspended in 400 µL LB medium. 50 mL of Synechocystis culture were centrifuged at 3850 g for 10 min at RT, the supernatant discarded and the cell pellet was resuspended in the remaining volume and transferred to an Eppendorf tube,
which was then centrifuged at 7000 g for 2 min at RT. The supernatant was discarded and the cell pellet was then resuspended in 400 µL fresh BG11 medium. Then, 200 µL of the Synechocystis culture were added to 400 µL of the E. coli mix culture in an Eppendorf tube and left resting for 1 h before plating on a BG11 plate. The plates were incubated for 2 days at 25 ºC with light. Then, the conjugation plates were washed with BG11 to remove the cells, which were then plated in solid BG11 medium supplemented with 15 μg chloramphenicol mL-1. After 2-3 weeks, colonies started to be visible. For each conjugation, three colonies were picked and maintained in both solid and liquid BG11 medium supplemented with 15 μg of chloramphenicol mL-1. The resulting mutants were designated SRLac and SRLac-Hist.
2.14 Salinity tolerance growth experiments
Pre-cultures of Synechocystis wild-type were grown in an orbital shaker at 100 r.p.m, at 30 ºC and under continuous light (25 μE m-2 s-1) or 12 h light (25 μE m-2 s-1) / 12 h dark regimen, until they reached an OD730~1.8. Then the cultures were diluted, in fresh BG11 medium with or without 5 mM glucose (added from a stock solution of 1 M glucose), to a final OD730~0.2. 50 mL of that dilution were transferred to 100 mL Erlenmeyer flasks (previously sterilized) containing a given salt quantity. The salt present provided that the cultures were supplemented with NaCl in the following final concentrations: 0, 1%, 2%, 3%, 4%, 5%, 6% and 7% (w/v). These cultures were maintained in the same conditions as the pre-culture and their growth was evaluated measuring the optical density at 730 nm using a Shimadzu UVmini-1240 spectrophotometer. Each experiment was performed in triplicate and under aseptic conditions.
2.15 Salinity acclimation growth experiments
Cultures of Synechocystis wild-type were grown as described in 2.14 and then diluted in fresh BG11 medium supplemented with 3% (w/v) NaCl, to a final OD730~0.2 and grown until an OD730~1.0 was reached. Then they were diluted again in fresh BG11 medium with or without 5 mM glucose, to a final OD730~0.2. 50 mL of that dilution were transferred to 100 mL Erlenmeyer flasks containing NaCl, to obtain culture with final NaCl concentrations of 0.6%, 3%, 5% and 7% (w/v). The growth evaluation was performed as described in 2.14. For each experiment three biological replicates were used.
2.16 Glycine betaine supplemented growth experiments
Cultures of Synechocystis wild-type were grown in an orbital shaker at 100 r.p.m., at 30 ºC in a 12 h light (25 μE m-2 s-1) / 12 h dark regimen, until they reached a OD730~1.8. Then the cultures were diluted in fresh BG11 medium to a final OD730~0.2 and 25 mL of that dilution were transferred to 50 mL Erlenmeyer flasks containing NaCl to obtain a final culture with 0, 3%, 5% and 7% (w/v). These cultures were then supplemented with 0, 2, 4 or 6 mM glycine betaine (Sigma) from a stock solution of 500 mM. The growth evaluation was performed as described in 2.14. For each experiment two biological replicates were used.
2.17 Different medium growth experiments
Cultures of Synechocystis wild-type were grown as described in 2.14 and diluted in fresh BG11 medium, BG11 medium supplemented with 3% (w/v) NaCl, ASN-III medium (Rippka et al., 1979) or MN medium (Rippka, 1988) to a final OD730 ~ 0.2. 25 mL of that dilution were transferred to 50 mL Erlenmeyer’s flasks. The growth evaluation was performed as described in 2.14. For each experiment three biological replicates were used.
3. Results
3.1 Characterization of Synechocystis tolerance to salinity
3.1.1 Synechocystis growth in different media
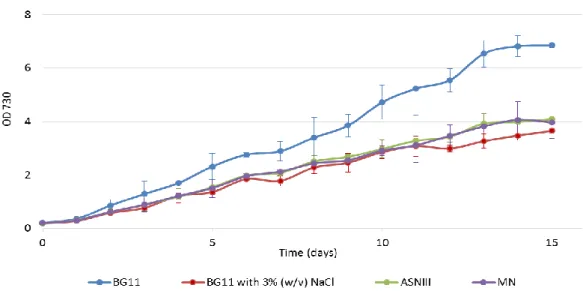
To test the effects of seawater in Synechocystis cells, the cells were grown in media commonly used to simulate seawater conditions: ASN-III (Rippka et al., 1979) and MN (Rippka, 1988). ASN-III possesses in its composition 2.5% (w/v) NaCl and MN is made with filtered seawater. The cells were also grown in BG11 medium (as a control) and in BG11 with 3% (w/v) NaCl, since that is, in average, the percentage of NaCl present in seawater (Takagi & Yoshida, 2006). Synechocystis cells were cultivated under continuous light or in a 12 h light/ 12 h dark regimen. For practical reasons it was decided that a period of 15-20 days was representative and enough to assess the Synechocystis growth curves in the chosen conditions.
The 12 h light/ 12 h dark regimen growth curves are shown in Figure 2. Cells grown under continuous light show the same pattern (data not shown).
Figure 2 – Growth curves of Synechocystis in different media. Cultures were grown under a 12 h light (25 µE m−2 s−1)/
12h dark regimen, in an orbital shaker at 100 r.p.m., at 30 ºC. Cell growth was determined by monitoring the optical density of the culture at 730 nm. Mean ± S.D., n=3.
These results indicate that Synechocystis cells can grow in the range of seawater salt concentration. Furthermore, since the differences between the growth curves of cells cultivated in seawater based media – ASN-III and MN – and BG11 with 3% (w/v) NaCl are not significant, BG11 medium was chosen to be used in further studies to characterize Synechocystis tolerance to salinity.
3.1.2 Synechocystis growth under different NaCl concentrations
The effects of salinity on Synechocystis growth was determined by subjecting the cells to different NaCl concentrations and assume that an increase in the salinity adverse effects would correlate with an increase in the impairment of the culture growth. Thus, cell cultures of Synechocystis were supplemented with NaCl and grown under continuous light or in a 12 h light/12 h dark regimen, in autotrophic or mixotrophic (medium supplemented with 5 mM glucose) conditions.
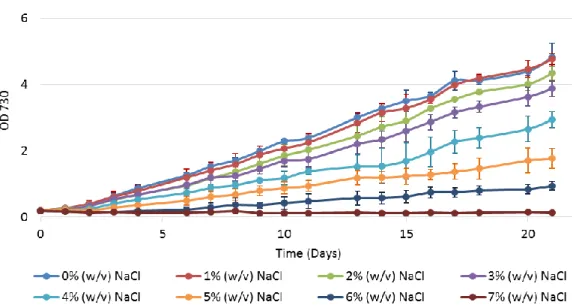
The effects of different salt concentrations on Synechocystis cells growth with a 12h light/ 12h dark cycles autotrophic regimen are shown in Figure 3.
Figure 3 – Growth curves of Synechocystis under different salinity conditions. Cultures were grown in BG11 medium under a 12 h light (25 µE m−2 s−1)/12 h dark regimen, in an orbital shaker at 100 r.p.m., at 30 ºC. Cell growth was
determined by monitoring the optical density of the culture at 730 nm. Mean ± S.D., n=3.
It is visible that an increase in salinity concentration has as consequence a decrease in the growth rate, except for the 1% (w/v) NaCl concentration, being that effect more noticeable at NaCl concentrations above 4% (w/v). Furthermore, it is clear that 6% (w/v) NaCl is the tolerated limit by this cyanobacterium since that there is no growth observed in the 7% (w/v) NaCl treatment.
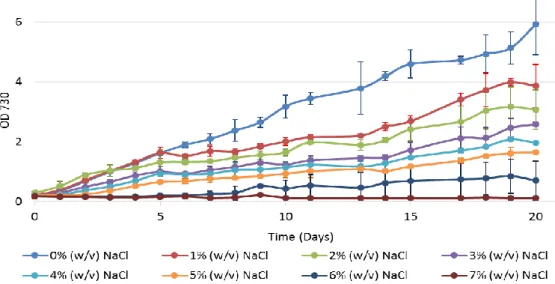
Under the continuous light regimen, the salinity effect on cell growth is more severe, as is shown in Figure 4.
Figure 4 – Growth curves of Synechocystis under different salinity conditions. Cultures were grown in BG11 medium, under continuous light (25 µE m−2 s−1) regimen, in an orbital shaker at 100 r.p.m., at 30 ºC. Cell growth was determined by monitoring the optical density of the culture at 730 nm. Mean ± S.D., n=3.
In continuous light, after 5 days there is a shift in the growth curves of cultures supplemented with NaCl, being visible larger differences between them and the control treatment.
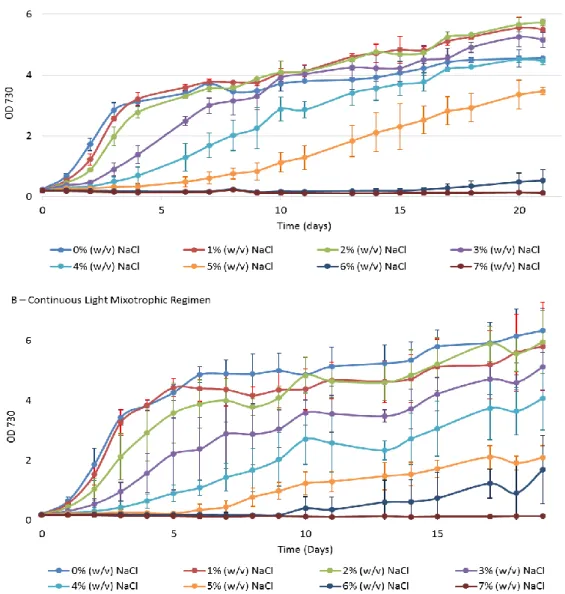
When the cells where grown under mixotrophic conditions, a faster growth than in autotrophic conditions is noticeable. The growth curves are shown in Figure 5.
The results show a decrease of growth as salinity increase, similar to what was observed for autotrophic conditions. However, in the 12 h light/ 12 h dark regimen that effect is more visible in the first days of culture. The growth curves under a continuous light mixotrophic regimen have the particularity to have standard deviations bars bigger than any other tested regimen.
Figure 5 – Growth curves of Synechocystis under different salinity conditions. Cultures were grown in BG11 medium supplemented with glucose 5 mM, under a 12 h light (25 µE m−2 s−1)/ 12 h dark regimen (A) or under a 24 h light (25 µE m−2 s−1) regimen (B), in an orbital shaker at 100 r.p.m., at 30 ºC. Cell growth was determined by monitoring the optical density of the culture at 730 nm. Mean ± S.D., n=3.
3.1.3 Growth of Synechocystis cells acclimated to salt
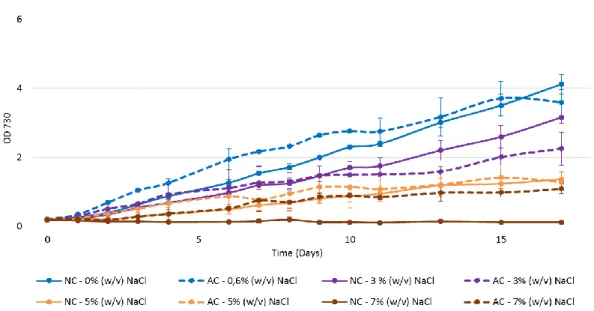
Subsequently, it was tested if the inoculation of cells previously acclimated to salt could result in less damage compared to the damage caused in non-acclimated cells. The same conditions and light regimens used in the previous experiment were tested.
Synechocystis cells were grown with 3% (w/v) NaCl until reach an OD730~1.0 and then
transferred to medium supplemented with different NaCl concentrations. Since it was not desirable to subject the cells to an extra stress, they were not centrifuged and washed before the re-inoculation. The comparison of the growth curves between acclimated and non-acclimated Synechocystis cells with a 12 h light/ 12 h dark regimen are shown in Figure 6.
Figure 6 – Growth curves of Synechocystis acclimated (dashed lines: AC) and non-acclimated (full lines: NC) cells under different salinity conditions. Cultures were grown in BG11 medium under a 12 h light (25 µE m−2 s−1)/ 12 h dark regimen, in an orbital shaker at 100 r.p.m., at 30 ºC. Cell growth was determined by monitoring the optical density of the culture at 730 nm. Mean ± S.D., n=3.
The given hypothesis that acclimated cells suffer less salinity damage seems true, since that acclimated cells can grow in 7% (w/v) NaCl overcoming the tolerance limit of non-acclimated cells. The same results were obtained in all conditions and light regimens tested (data not shown).
3.1.4 Synechocystis growth in the presence of the compatible solute
glycine betaine
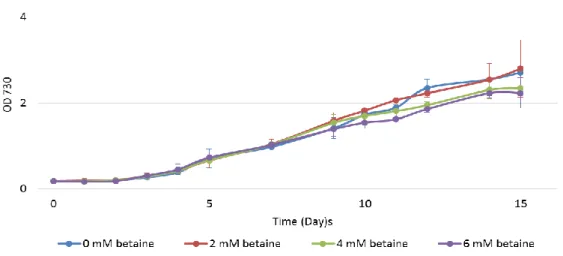
A compatible solute is a substance compatible with the cellular metabolism that accumulates in the cytoplasm to balance external osmotic pressure. One of the most important mechanisms that cells use to cope with high salinity conditions is the accumulation of compatible solutes, being glycine betaine one of them (Hagemann, 2011). Thus, the design of synthetic devices capable of modulate the production of compatible solutes can be a good approach to further enhance Synechocystis robustness against adverse salinity conditions. To test this hypothesis, Synechocystis cells were grown in BG11 with 0, 3%, 5% or 7% NaCl, and in the presence of glycine betaine at different molar concentrations (0 to 6 mM).
As representative results, the growth curves obtained in BG11 with 5% (w/v) NaCl are shown in Figure 7. All other tested conditions showed similar results (data not shown).
Figure 7 – Growth curves of Synechocystis in the presence of glycine betaine. Cultures were grown in BG11 supplemented with 5% (w/v) NaCl, with a 12 h light (25 µE m−2 s−1)/12 h dark regimen, in an orbital shaker at 100 r.p.m., at 30 ºC. Cell growth was determined by monitoring the optical density of the culture at 730 nm. Mean ± S.D., n=2.
The obtained results showed that supplementing the growth medium with this particular concentrations of glycine betaine did not have any evident effect on the growth of Synechocystis cells in the conditions tested.
3.2 Characterization of an Oxygen Consuming Device based on
Laccase
3.2.1 Mutants generation
Previous to this work, an oxygen consuming device (OCD) based on E. coli CueO, a bacterial laccase, was constructed using the BiobrickTM part F2620 (http://parts.igem.org/Part:BBa_F2620), a RBS site, the cueO sequence with codon optimization for Synechocystis and a double terminator. The device was cloned in the high copy number pSB1A3 plasmid, the obtained pSB1A3-F2620-LAC plasmid was introduced in E. coli and the device functionality was assessed. The results showed that the device is functional in the model organism E. coli (Pacheco et al., unpublished data).
In order to make the laccase device functional into a Synechocystis chassis, the synthetic cueO sequence was placed under the regulation of three Synechocystis promoters characterized by Huang et al. (2010): the PrnpB (P5), PrbcL2A (P6) and PrbcL1C (P7). They are constitutive promoters based on the Ribonuclease P and the large subunit of Rubisco native promoters and their relative intensities (strength) are: P6>P7>P5.
The newly generated laccase devices were then cloned in integrative vectors constructed by Pinto (2013). These vectors (pSN5K and pSN16K) contain a kanamycin
resistance cassette flanked by two regions required for double homologous recombination targeting the neutral sites N5 and N16 in Synechocystis genome. The strategy to insert the laccase devices into the integrative vectors is depicted in Figure 8.
Figure 8 - Strategy to insert the synthetic laccase device into the integrative vector. (A) Representation of pSNnK plasmid showing the most relevant components (KmR - gene conferring Kanamycin resistance; AmpR - gene conferring
ampicillin resistance; TT – transcription double terminator); (B) Representation of the synthetic laccase device; (C) Resultant vector after the insertion of the laccase device into a pSNnK plasmid.
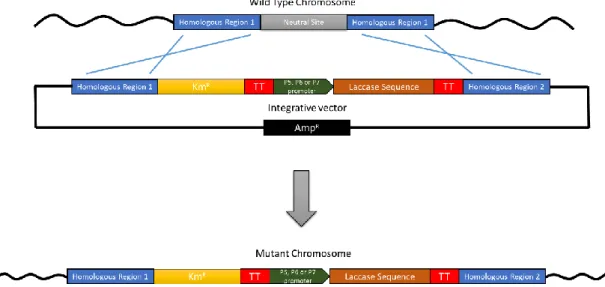
In this work, plasmids pSN5KP5-Lac, pSN5KP6-Lac, pSN5KP7-Lac, pSN16KP5-Lac, pSN16KP6-Lac and pSN16KP7-Lac were introduced in Synechocystis through natural transformation. The event of double homologous recombination is represented in Figure 9.
Figure 9 - Schematic representation of the double homologous recombination event. KmR - gene conferring Kanamycin
resistance; ; AmpR - gene conferring ampicillin resistance; TT – transcription double terminator;
The segregation was carried out by subjecting the mutants to increasing Km concentrations and full segregation was confirmed by two PCRs: one with primers that bind to the neutral site flanking regions (external PCR) and other with primers that bind to a region within the neutral site ORF (internal PCR). In the external PCR, a larger
PCR product is expected for the mutants, compared to the wild type. The difference in size is due to the presence of the laccase device plus the kanamycin (Km) resistance cassette. In the internal PCR no product amplification is expected in the mutant chromosome since the neutral site ORF was replaced by the laccase device and the Km resistance cassette. Segregation of one SN5KP5-LAC clone, five SN5KP6-LAC clones, one SN5KP7-LAC clone, two SN16KP5-LAC clones and three SN16KP7-LAC clones was accessed by PCR (Figure 10). The full segregation will be confirmed by Southern blot.
Figure 10 – DNA electrophoresis of PCR products confirming the full segregation of Synechocystis SNnKPn-Lac mutants. The PCR reactions were performed using primers external to each neutral site (A) and with primers within the ORF corresponding to each neutral site (B). Negative controls were included (-, absence of template). The expected sizes of the PCR products are shown below the figures; M1 - Molecular weight marker, GeneRulerTM 1 kb DNA
Ladder(Fermentas); M2 – Molecular weight marker, GeneRuler™ DNA Ladder Mix (Fermentas); M3 - Molecular weight marker, GeneRulerTM 50 bp DNA Ladder (Fermentas).
3.2.2 Laccase activity assays
For the in vitro characterization of the OCD, a total protein extraction was performed using SN5KP6-Lac #1 cells collected at different optical densities (730 nm): 1, 2, 5, and 7. Total protein extract of Synechocystis wild type (OD730~1.0) and E. coli DH5α transformed with pSB1A3-F2620-LAC were collected as well, to serve as negative and positive control respectively. The protein samples were run in a SDS-PAGE. The results are shown in Figure 11 and it is not possible to identify the laccase protein band (~55 kDa) in any protein extract except the one from E. coli.
Figure 11 – 10% (w/v) SDS-PAGE gel stained with Coomassie blue. SDS-PAGE protein analysis from Synechocystis SN5KP6-LAC #1 mutant and E. coli transformed with pSB1A3-F2620-LAC. Equal amounts of proteins (20 µg) were applied in each lane. The arrow points the overexpressed laccase protein; M - Precision Plus Protein™ All Blue Standards (Bio Rad).
The laccase in vitro activity was assessed spectrophotometrically. The spectrophotometric assay was carried out by monitoring the absorbance increase from oxidation of the substract ABTS (Kim et al., 2001). As the oxidation of ABTS occurs, a green product is formed and its absorbance can be detected at 420 nm. The assays were performed with the total protein extracts referred above and no increase in absorbance at 420 nm was detected apart from the positive control (data not shown), meaning that no laccase activity was detected in the SN5KP6-Lac #1 mutant protein extracts.
However, the presence of green photosynthetic pigments in the Synechocystis protein extracts could be interfering with the spectrophotometric method. Thus, to confirm the obtained results, a Clark-type O2 electrode was used to measure the oxygen that is consumed in the same reaction. The raw data withdraw from the electrode is showed in Figure 12.
Figure 12 – Oxygen measurements using a Clark-type O2 electrode. A) Negative control without protein; B) Oxygen
consumption after addition of 100 µL of Synechocystis proteins extracted from cells collected at OD730~5; The green
arrow indicates the addition of the Synechocystis protein extract and the blue arrow indicates the addition of ABTS.
No oxygen consumption was detected in any Synechocystis extract, confirming the results obtained in the spectrophotometric assay. In Figure 12B, the Synechocystis proteins extracted from cells collected at OD750 ~5 is shown as representative of the results obtained with all Synechocystis protein extracts.
3.2.3 Transcriptional analysis of the laccase device
To ascertain why no laccase activity was being detected, a transcriptional analysis was performed. RT-PCRs were done using laccase specific primers and RNA extracted from Synechocystis wild type and SN5KP6-Lac mutants #1, #2 and #3 cells collected at three different growth phases: OD730~0.5, 1 and 2. The results are shown in Figure 13 and revealed amplicons for all SN5KP6-Lac clones tested at all growth time points in which the samples were collected.
Figure 13 – Electrophoresis gel showing the amplification by PCR of laccase cDNA. Negative control (-, absence of template) and positive control (+, pSB1A3-F2620-LAC) are indicated. M – Molecular weight marker, GeneRuler™ DNA Ladder Mix (Fermentas);
3.2.4 Generation of Synechocystis mutants transformed with
replicative plasmids
To ascertain why the laccase device is being transcribed but no protein activity is being detected more information had to be gathered at the protein translation level. However, since antibodies against the laccase protein were not available, the expression levels could not be assessed. To solve this problem, two laccase constructs were generated and cloned in the Synechocystis pAWG1.1 replicative plasmid under the control of the inducible copper-responsive petE promoter. One of the constructs contains the laccase coding sequence and the second contains the Laccase coding sequence plus a hexa histidine-tag sequence at the C-terminus of the protein. The hexa histidine-tag will be used as an antigen to a standard anti-histidine antibody in a western blot assay to ascertain if the laccase mRNA is being translated. The other
construct will be used to test if laccase in vitro activity can be detected when the laccase sequence is regulated by a different promoter and RBS site.
Synechocystis cells were then transformed with the two newly generated laccase constructions – pAWG1.1_Lac and pAWG1.1_LacHist – through conjugation. Positive clones were selected using the chloramphenicol resistance conferred by the presence of the replicative plasmid. The generated mutants will be characterized in the near future.