Effect of mixing method on the mini-slump spread
of Portland cement pastes
Efeito do método de mistura sobre o espalhamento
mini-slump de pastas de cimento Portland
a InterCement Brazil S.A., São Paulo, SP, Brazil;
b Polytechnic School of the University of Sao Paulo, Department of Civil Engineering, São Paulo, SP, Brazil.
Received: 25 Oct 2016 • Accepted: 21 Jul 2017 • Available Online: 9 Apr 2018
J. S. RAUCCI a b
julia.raucci@lme.pcc.usp.br
R. T. CECEL b
rafael.cecel@lme.pcc.usp.br
R. C. O. ROMANO b
rcorjau@gmail.com
R. G. PILEGGI b
rafael.pileggi@lme.pcc.usp.br
V. M. JOHN b
vmjohn@usp.br
Abstract
Resumo
The current compressive strength test for cement classification is performed under a fixed water to cement ratio according to the Brazilian and European standards, regardless the consistency obtained. However, under practical conditions the amount of water required is related to the rheological need to obtain and maintain a desired workability. Intrinsic cement characteristics influence the water demand such as the cement particle’s granulometry, specific surface area, density, the presence or not of water reducing admixtures, chemical and mineralogical nature of raw materials, etc., influence particles agglomeration state. Because water demand influences the mechanical properties of cement based products, the compressive strength class under a fixed water to solids ratio specified by the standards may not be representative for the user. The present work investigates the influence of mixing conditions on mini-slump spread results, a test that has been used for many years but never standard
-ized. Cement paste samples were produced with varied mixing conditions (time and rotation speed) using a conventional stirrer and subjected to slump spread test immediately after mixing and at fixed hydration times. Results show that mixing and hydration time do influence on mini-slump spread. At lower rotation speeds, results variability increases. Under fixed time after first contact with water, increasing rotation speed leads
in a reduction of results variability and increase the test’s repeatability on cement pastes.
Keywords: Portland cement, mini-slump spread, mixing.
O ensaio de resistência do cimento, segundo às normas brasileiras e europeia atuais, é realizado com uma relação água/cimento fixa em massa, independente da consistência obtida. No entanto em condições normais de uso, a quantidade de água é uma variável definida com a finalidade de manutenção da consistência dos materiais cimentícios para obter trabalhabilidade adequada. Características intrínsecas dos ligantes, como distribuição de tamanho de partículas, área superficial especifica, densidade e natureza química ou mineralógica, ou extrínsecas, como presença de aditivos, temperatura ambiente e da água, tempo e energia de processamento, etc., podem afetar de forma distinta o estado de aglomeração e, consequentemente, a necessidade de líquido para a mistura. Como a demanda de água influencia a resistência mecânica dos produtos, a utilização da relação água/cimento fixa torna, em termos práticos, a classificação do cimento pela resistência pouco significativa para o usuário. Neste trabalho foi investigada a influência das condições de mistura na repetibilidade do ensaio de mini-slump, bastante usado para avaliação da quantidade de água nas composições, mas não normatizado. Pastas de uma mesma amostra de cimento foram misturadas por diferentes tempos e/ou rotações, usando um agitador mecânico convencional, e submetidas ao ensaio de mini-slump imediatamente após o ensaio ou após o mesmo tempo de contato com a água. Observou-se influência significativa nos resultados: quanto maior a rotação ou a manutenção do tempo de mistura, menor a variabilidade do espalhamento mini-slump sendo que a influência é mais sensível para diferenças de rotação.
1. Introduction
Water demand impacts directly on the mechanical strength of
ce-ment based products. The water excess increases the amount of capillary pores hence microstructural defects. Still, standardized
testing methods to determine compressive strength of cement
ac-cording to both Brazilian (ABNT, NBR 7215) and European (EN 197-1) standards are performed with a fixed water to cement mass ratio.
As cement substitution increases by supplementary cementitious
materials, which may be very different in terms of chemistry, miner
-alogical and physical characteristics, the amount of water to obtain the necessary workability in the use of these cements differs just as much. The standardized tests based on a fixed water to ce
-ment ratio may not reflect users’ perception. In self-consolidating concrete mix design, for instance, water content is adjusted follow
-ing slump flow tests. Therefore, cements in the same compressive strength class may reflect in very different performances in use. Testing methods such as flow table, Marsh-cone and Kantro’s mini-slump cone are quite simple to run and implement as quality
control methods even considering that these methods are not the
most recommended for scientific research. Rotational Rheometry,
on the other hand, is the type of testing method that demands more
practice to run and analyze, but defines water demand based on
rheological parameters such as viscosity and yield stress. In
addi-tion, it allows an evaluation of cement properties simulating differ -ent shear conditions and is a tool to explain the behavior observed on more simple tests or single-point tests.
However, one of the main issues on rheological testing methods
is mixing energy. It is a common sense that mixing energy has a huge impact on rheological behavior of cement products hence on
water demand as it affects particles dispersion (ROMANO et al., 2009; WILLIAMS; SAAK; JENNINGS, 1999; YANG; JENNINGS,
1995). Regardless of the water content determined by each testing method, sample preparation will always play and important role on the result. Thus, repeatability, reproductivity and efficiency of any testing method for water demand evaluation depends on a suitable
mixing method.
This work is the first step of a study to develop a standard
mini-slump testing protocol for cement pastes. Repeatability of results
were analyzed as a function of mixing conditions. Also, tests were performed to correlate mini-slump results with Rotational Rheom -etry and evaluate the impact of mixing conditions in cement hydra-tion by Isothermal Calorimetry.
2. Background
Immediately after water is mixed with cement, clusters of particles
start to form due to Van Der Waals forces capillary actions (Figure 2.1). As these clusters are randomly formed, they alter the real
par-ticle size distribution and water gets trapped in their within which modifies the rheology of the system. Clusters are a source of vari -ability in a consistency testing method. The more homogeneous
and dispersed are the cement particles in solution, the lower will be the variability of the following testing method.
Different mixing conditions will create fluids with different rheologi
-cal behavior. The rheologi-cal profile measurement by Rotational
Rheometry in cement pastes, mortars or concretes is the most
complete method to evaluate the mixture behavior under differ
-ent types of stresses that they can be subjected to. Under various
shear rates a mixture response can be composed by basic
rheo-logical profiles (Newtonian, pseudoplastic, dilatant, Bingham etc.) (BANFILL, 2006; PANDOLFELLI et al., 2000). Unfortunately, Rhe
-ometers are expensive equipment and proper training is a must for testing and adequate data analysis.
Figure 2.1
Other simpler techniques for water demand evaluation, even
though are considered single point tests (BANFILL, 2006), are rel-evant in the absence of a more complete testing method. These
techniques include the flow table test performed in mortar as an al
-ternative method. The current ASTM standard stands that cements with higher substitution rates should have their water content for strength testing determined by a flow table test (ASTM C109). Be -cause it is conducted in mortar and a large amount of material is
used, this test can be overwhelming to be implemented as a pro
-cess control test, but it is an alternative for water demand estima
-tion as a water content correc-tion as a func-tion of mortar spreading (SANYTSKY; KROPYVNYTSKA; RUSYN, 2015).
The Marsh cone and mini-slump cone are techniques that can be applied in cement paste. It is possible to find many refer -ences naming these testing methods as supplementary testing as results can be correlated to rheological parameters. Time to
flow, for instance, from the Marsh cone test is related to apparent viscosity when modeled with cement’s characteristics. The mini-slump spread is related to yield stress (BANFILL, 2006; GAO; FOURIE, 2015). These are techniques of fast execution and rapid implementation techniques, yet both need proper mixing methods
to be repetitive.
Therefore, a mixing method with enough energy to separate
agglomerated particles formed by attractive forces (PANDOL-FELLI et al., 2000) are a pre-condition to rheological testing
methods of pastes, mortars and concretes. Previous works that evaluated mixing energy effect on rheological behavior showed
that the higher the mixing energy, the higher the
deagglomera-tion of particles (WILLIAMS; SAAK; JENNINGS, 1999; YANG; JENNINGS, 1995).
In Figure 2.2 bellow is presented plastic viscosity results mea -sured by Rotational Rheometry in cement pastes subjected to
different mixing methods. The results show the smaller plastic
viscosity for the higher the mixing energy. In the same study the
hysteresis loop area from continuous flow measurements and the results show a bigger hysteresis loop the smaller the ener
-gy, which indicates that the not well mixed pastes go through a deagglomeration process during testing (WILLIAMS; SAAK; JEN
-NINGS, 1999). Therefore, testing of pastes from higher mixing energy methods would be more repetitive.
Mixing conditions can also influence the hydration heat hence the microstructure of the hardened paste. Studies show that reaction kinetics increases as mixing energy increases which is due to the higher contact area between the cement grains and water as well as the shock energy and friction between particles (BERO
-DIER; SCRIVENER, 2015; DOLLIMORE; MANGABHAI, 1985; JUILLAND et al., 2012; TAKAHASHI; BIER; WESTPHAL, 2011; YANG; JENNINGS, 1995).
3. Experimental program
3.1 Materials
Cement pastes were produced from a CEM II/B-L 32,5N (Portland-limestone cement) according to EN-197 standard and a water to cement ratio of 0,45. The amount of water was determined by pre
-liminary tests to evaluate the minimum water content necessary for
the mini-slump test.
The cement had a BET specific surface area of 2,96 g/cm³, initial
setting time of 335 minutes, Blaine surface area of 6150 cm²/g
and 75 um fineness of 1,3%. The particle size distribution (mea
-sured in a Malvern Mastersizer 2000 in ethanol) is shown in Fig-ure 3.1. Chemical composition (Table 3.1) was obtained following
guidelines from Portland composite cements specification from NBR11578:1991 (ABNT, 1991). Mineralogical analysis by semi-quantitative XRD (obtained from Rigaku Windmax 1000 and X-Pert HighScore Plus 4.1 software from Panalytical) is illustrated
in Table 3.2.
Figure 2.2
3.2 Methods
3.2.1 Mixing conditions
Cement pastes were mixed in a metallic cocktail shaker using a mechanical stirrer IKA RW20 attacked to a naval helix of 35 mm diameter. Mixing conditions varied as a function of:
n mixing time (60, 90, 180, 210 to 300 seconds), n rotation speed (320 to 2550 rpm) and
n time of testing (immediately after mixing or 340 seconds after
water contact).
Hydration time was considered as a possible variable; hence some testing was conducted after waiting for all pastes to reach the same time after the first contact with water with 10 seconds of remixing
time. A scheme of the mixing plan is presented in Figure 3.2.
Figure 3.1
Cement particle size distribution
Table 3.1
Cement chemical composition (%)
PF SiO2 Al2O3 Fe2O3 CaO MgO SO3 Na2O K2O CaO-l RI CO2
13,2 15,6 3,62 2,42 59,9 1,77 2,25 0,08 0,73 1,15 1,94 11,4
Table 3.2
Semi-quantitative XRD composition (%)
Phase C3S C2S C3A C4AF Dolomite Calcite Bassanite Anhydrate-II Quartz
PDFs 00-013-0272
01-086-0398
01-070-0839
96-900-3349
01-075-1711
01-086-0174
01-083-0438
01-072-0916 46-1045
% 42,7 13,1 3,8 5,7 1,1 30,4 1,8 0,4 0,9
Figure 3.2
Room temperature was monitored to be around 23 ± 2°C.
3.2.2 Mini-slump
After mixing, cement pastes were inserted in a Kantro’s mini-slump
acrylic cone of 6 cm high, 4 cm diameter smaller base and 2 cm diameter bigger base (Figure 3.3). Five strokes with a glass stirring
rod to avoid the formation of air bubbles within the cone, and the excess of paste on the top was removed. The mold is lifted rapidly
and the spreading recorded.
3.2.3 Rotational rheometry
Rotational Rheometry testing were performed in a Haake MARS 60 (Thermo Scientific), with parallel plate geometry of 25 mm diameter. The testing programed was conducted with shear rate from 0 to 50
s-1 and to 0 again as illustrated in Figure 3.4. Temperature was set
Figure 3.3
Acrylic mini-slump cone
Figure 3.4
Rotational rheometry testing program (left); Haake MARS 60 paste rheometer (right)
Figure 3.5
to 23°C. The result of the test are plots of shear strain (σ in Pa) or apparent viscosity (η em Pa.s) as a function of shear stress applied
(γ em s-1).
3.2.4 Isothermal calorimetry
Hydration heat was measured by a TAM Air (TA Instruments)
calorimeter (Figure 3.5) for 48 hours at constant temperature
of 23°C.
4. Results and discussion
Initially the rotation speed setting was evaluated with mini-slump
results for a fixed mixing time. Secondly, three different mix
-ing times in three different rotation speeds consider-ing the pos
-sibility of the testing to be influenced by hydration time. Thirdly, mini-slump cone tests were performed in parallel with Rotational Rheometry to analyze the possible correlation of yield stress and spread. Lastly, the effect of mixing on hydration heat was tested combining the shorter and longest mixing times with the smallest
and highest rotation speed.
The statistical significance of the results was obtained by variance analysis and one sample t-student tests two by two considering two tailed distributions, unequal sample sizes and significance level of 5%. The statistical analysis is presented for the first step of the study and only described for the following.
Figure 4.1
Average results (black line) and amplitudes (red lines) of mini-slump repetitions as a function of rotation
speed (30 seconds of initial wetting and 90 seconds mixing)
Table 4.1
Variance analysis of the results presented in Figure 4.1
Table 4.2
T-student tests matrices of results presented in Figure 4.1
Source of variation SS df MS F P-value F crit
Among groups 1,77 4 0,44 25,56 4,69E-06 3,18
In the same group 0,23 13 0,02 – – –
Total 2,00 17 – – – –
Groups 320 1400 2000 2200 2500
320 – 25,3% 3,4% 1,0% 0,1%
1400 25,3% – 9,8% 1,6% 0,0%
2000 3,4% 9,8% – 15,8% 0,1%
2200 1,0% 1,6% 15,8% – 1,0%
4.1 Influence of rotation speed on paste spread
The first part of the tests consisted in producing pastes with 30 seconds initial wetting time and 90 seconds of rotation speed vari
-ation (320 to 2550 rpm). Four repetitions were conducted for each
condition. The results presented in Figure 4.1 follow the expected trend. Parameters obtained from variance analysis and t-student test are presented on Table 4.1 and Table 4.2 respectively.
Variance analysis shows that there are distinct populations in the re -sults (F>Fcrit). T-student test illustrate that rotations of 320 to 1400, 1400 to 2000 and 2000 to 2200 do not reject the null hypothesis
(> 5%). But other conditions are statistically different allowing the analysis of the influence of rotation speed on mini-slump spread.
The variation of results of the same mixing condition is smaller as shear time increases due to the increase in repetitiveness. The
coef-ficient of variation goes from 4% in smaller rotations, to 2,6% in 2200
and 2550 rpm. Spreading increases as rotation speed increases in-dicating a reduction on yield stress (BANFILL, 2006; FERRARIS;
OBLA; HILL, 2001; GAO; FOURIE, 2015; WILLIAMS; SAAK; JEN
-NINGS, 1999; YANG; JEN-NINGS, 1995). This is expected due to
the highest deagglomeration of particles result of the higher mixing energy (PANDOLFELLI et al., 2000).
4.2 Impact of mixing time
To evaluate not only mixing speed, but also the setting of differ
-ent mixing times, the second evaluation performed in this work consisted in varying the mixing time in fixed rotation speeds (320,
1400 and 2550 rpm).
On the first group of mini-slump tests, spreading was recorded im -mediately after mixing (Figure 4.2) and analysis of variance showed
that there were different populations. However, a possible inconsis
-tency for the three rotation setting at 90 seconds of mixing was ob
-served on all groups. After repetitions, temperature changes were
discarded as a source of variation because the heat from mixing was irrelevant for all samples and room temperature was controlled. So,
this variation may be related to initial hydration reactions.
Following, the hydration time (time after the first contact with wa
-ter) was fixed on the second group of tests in 340 seconds. To reduce re-agglomeration effect during waiting time, pastes were
subjected to remixing of 10 seconds prior to testing. This time
was revealed sufficient in exploratory testing. Results are pre -sented in Figure 4.3.
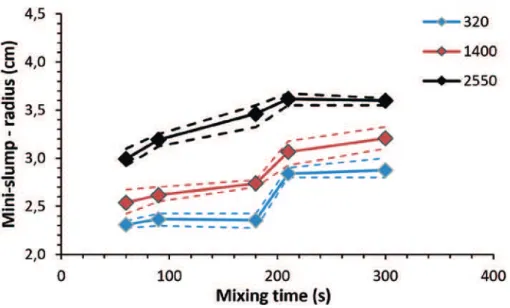
Analysis of variance proved that there are statistically different groups within the tests. T-student tests show that mixtures at 320 rpm are
the same for the three mixing times (60, 90 and 180 seconds). For
1400 rpm the samples of first two mixing times are statistically the
same. Lastly mixtures at 2550 rpm, all groups of three mixing times
are distinct. At all mixing speeds, the last two set of mixing times (210 and 300 seconds) do not presented results with statistical difference. Moreover, results performed in the same hydration time do not dis -play the inconsistency seen before at 90 seconds of mixing time. In this case is more evident the trend of bigger spread as mixing time increases specially at 2550 rpm. After this time, the longest mixture did not produce results of considerable spread increase. Therefore, the biggest spreading as obtained by a mixture of 210 seconds at 2550 rpm.
Comparing the results two by two in the same mixing conditions and different testing time, it is shown that cement pastes are dif
-ferent with exception of samples mixed for 300 seconds and at
320 rpm for 60 seconds. The last one presented very small spread results. These results indicate that hydration time impacted on the cement pastes rheological behavior.
4,3 Rotational rheometry
To verify if there is a correlation between mini-slump and yield stress measured by Rotational Rheometry, tests were conducted
Figure 4.2
in pastes mixed at 1400 rpm and 2500 rpm for 210 and 300
sec-onds. Samples were tested immediately after mixing and 340 sec
-onds from initial contact with water preceded by 10 sec-onds remix -ing time (same procedures used before).
Figure 4.4 illustrates typical results obtained from Rotational
Rhe-ometry which measures the necessary strain for each shear rate. In this case, pastes were accelerated from absolute resting to 50 s-1
and back to resting. Yield stress is obtained as the point with 1 s-1
shear rate (smallest with still good precision) on deceleration step.
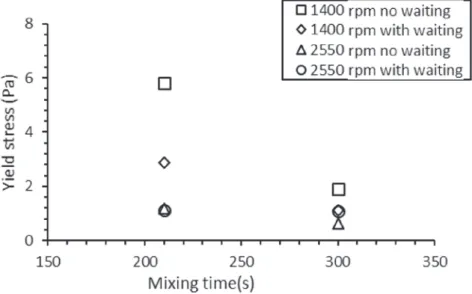
Results of yield stress as a function of rotation speed are presented in Figure 4.5. Apparently, the higher the rotation speed, the smaller are the yield stress results. It can also be observed that increasing mixing to 2550 rpm has little impact on yield stress that remains
very low. In this rotation speed, it was not possible to notice the effect of re-agglomeration after waiting time. The effect of mixing in apparent viscosity was relatively small. Even though only one test was performed for each mixing condition, the conclusions match with the ones presented before.
As reported by references (GAO; FOURIE, 2015), there is a fair correlation between mini-slump spread and yield stress obtained
by Rotational Rheometry (Figure 4.6). On the other hand, Rota-tional Rheometry is much more sensible test than mini-slump:
while yield stress varies between ~0,5 and 6 Pa (12 times), mini-slump varies from 3 to 4 cm (1,3 times). There was not a corre
-lation between spread and apparent viscosity. The estimation of viscosity requires the measurement of time to flow during testing.
Figure 4.3
Results from mini-slump with different rotation speeds (testing performed after 340 seconds of hydration
time with 10 seconds of remixing before testing). Dashed lines represent the amplitude of results
Figure 4.4
4.4 Influence of mixing on hydration kinetics
References point that an increase in mixing induces a fastest
hy-dration kinetics (BERODIER; SCRIVENER, 2015; JUILLAND et al., 2012; TAKAHASHI; BIER; WESTPHAL, 2011). This kinetics
can be measured by isothermal calorimetry through heat libera-tion (J/s) during acceleralibera-tion period. This impacts not only on initial strength, but also on the microstructure development of the
ce-mentitious material (YANG; JENNINGS, 1995).
Hydration heat was evaluated for cement pastes mixed for 60 and
340 seconds at 320 and 2550 rpm, conditions considered as
bor-ders of others so their variation would contain the others.
Figure 4.7 shows that rotation speed during mixing has influence
on hydration kinetics while time of mixing does not. Mixing at 2550
rpm has more energy applied than at 320 rpm. Time of mixing
im-pacts on the probability of chocks which, in the same mixing en
-ergy, to not change heat of hydration. These results agree with
the ones found on references (BERODIER; SCRIVENER, 2015;
JUILLAND et al., 2012; TAKAHASHI; BIER; WESTPHAL, 2011). Setting time determined by isothermal calorimetry (ASTM C1679)
reduced from 460 min (320 rpm) to 400 min (2550 rpm).
Not only hydration profile, but cumulated heat was also altered. The total heat measured after 48 hours was of 220 and 210 J/g
for samples mixed at 320 rpm for 60 and 340 seconds respec-tively. But at 2550 rpm the total heat increased to 240 and 235 J/g.
Although there seems to be a slight difference in samples mixed
Figure 4.5
Yield stress as a function of mixing time for rotation speeds of 1400 and 2550 rpm on testing performed
immediately after mixing and after 340 seconds of hydration tim
Figure 4.6
in the same speed, produced heat increases as rotation speed in-creases. According to the references this is a result of the higher mixing energy that contributes to a higher reactivity due to shear-ing of particles (BERODIER; SCRIVENER, 2015).
5. Conclusions
Mixing energy, as presented in this study as time of mixing and rotation speed, furthermore the time following initial contact with water and testing time exerted relevant influence on results of
mini-slump spread.
At higher mixing speeds that provide higher kinetic energy to par
-ticles and increase the chance of chocks that deagglomerate solu -tion, results in general had smaller variation.
Mini-slump revealed to be a low cost tool, simple and sensitive to
record changes on yield stress, an important parameter for
rheo-logical behavior evaluation. However, there is no information re
-lated to paste behavior under different shear rates due to the fact
that mini-slump is a single point test.
Mixing influenced hydration heat as well: higher rotation speeds increased acceleration period rate. In practice, this effect will have major impact on initial strengths. On testing configuration, the most adequate mixing setting was the one of higher rotation speed,
2550 rpm, at 210 seconds of mixing time. It is probable that even
higher mixing speeds, possible with other equipment, continue to
drop results variability.
6. References
[1] AMERICAN SOCIETY FOR TESTING AND MATERI
-ALS. ASTM C109: Standard Test Method for Compressive Strength of Hydraulic Cement Mortars (Using 2-in. or [50-mm] Cube Specimens). ASTM International, 2016.
[2] AMERICAN SOCIETY FOR TESTING AND MATERIALS. ASTM C1679: Standard Practice for Measuring Hydration
Kinetics of Hydraulic Cementitious Mixtures Using Isother
-mal Calorimetry. ASTM International, 2014.
[3] ASSOCIAÇÃO BRASILEIRA DE NORMAS TÉCNICAS. NBR 7215:1996 Versão corrigida 1997 – Cimento Portland – Determinação da resistência à compressão. Rio de Janeiro,
1997. 8p
[4] ASSOCIAÇÃO BRASILEIRA DE NORMAS TÉCNICAS. NBR 11578:1991 Versão corrigida 1997 – Cimento Portland Composto – Especificação. Rio de Janeiro, 1997. 8p [5] BANFILL, P. F. G. Rheology Of Fresh Cement And Concrete.
In: Rheology Reviews 2006. London: The British Society of
Rheology, 2006. p. 61–130.
[6] BERODIER, E.; SCRIVENER, K. L. Filler effect at early hy -dration. ICCC, International congress on the Chemistry of Cement, 2015.
[7] DAMINELI, B. L. et al. Viscosity prediction of cement-filler
suspensions using interference model: A route for binder
ef-ficiency enhancement. Cement and Concrete Research, v.
84, p. 8–19, jun. 2016.
[8] DOLLIMORE, D.; MANGABHAI, R. J. Effect of mixing time
on heat evolution pattern of cement pastes. Thermochimica Acta, v. 85, p. 223–226, 1 abr. 1985.
[9] EUROPEAN COMMITTEE FOR STANDARDIZATION. EN 197-1: Cement – Part 1: Composition, specifications and
conformity criteria for common cements. Brussels, 2012.
[10] FERRARIS, C. F.; OBLA, K. H.; HILL, R. The influence of
mineral admixtures on the rheology of cement paste and concrete. Cement and Concrete Research, v. 31, n. 2, p. 245–255, fev. 2001.
[11] GAO, J.; FOURIE, A. Spread is better: An investigation of the mini-slump test. Minerals Engineering, v. 71, p. 120–132,
fev. 2015.
[12] JUILLAND, P. et al. Effect of mixing on the early hydration of
alite and OPC systems. Cement and Concrete Research, v. 42, n. 9, p. 1175–1188, set. 2012.
Figure 4.7
[13] PANDOLFELLI, V. C. et al. Dispersão e empacotamento de partículas - princípios e aplicações em processamento cerâmico. São Paulo: Fazendo Arte, 2000.
[14] ROMANO, R. C. O. et al. Impacto do tipo de misturador e do
tempo de mistura nas propriedades de argamassas
indus-trializadas. Ambiente Construído, Porto Alegre, v. 9, n. 4, p.
109–118, 2009.
[15] SANYTSKY, M.; KROPYVNYTSKA, T.; RUSYN, B. Sus
-tainable green engineered composites containing ultrafine
supplementary cementitious materials. ICCC, International congress on the Chemistry of Cement, 2015.
[16] TAKAHASHI, K.; BIER, T. A.; WESTPHAL, T. Effects of mix
-ing energy on technological properties and hydration kinetics
of grouting mortars. Cement and Concrete Research, v. 41, n. 11, p. 1167–1176, nov. 2011.
[17] WEDDING, P.; KANTRO, D. Influence of Water-Reducing Admixtures on Properties of Cement Paste—A Miniature
Slump Test. Cement, Concrete and Aggregates, v. 2, n. 2, p. 95, 1980.
[18] WILLIAMS, D. A.; SAAK, A. W.; JENNINGS, H. M. The influ -ence of mixing on the rheology of fresh cement paste. Ce-ment and Concrete Research, v. 29, n. 9, p. 1491–1496, set. 1999.
[19] YANG, M.; JENNINGS, H. M. Influences of mixing methods
on the microstructure and rheological behavior of cement
paste. Advanced Cement Based Materials, v. 2, n. 2, p. 70–