The Effect of Mixing Energy and Shear Rate on the Thickening Time of
Cement Slurry
Stephen O. KWELLE and Samuel S. MOFUNLEWI
Department of Petroleum Engineering, University of Port Harcourt, Nigeria
E-mail(s): [email protected], and [email protected]
Abstract
Achieving optimum cement slurry design involves being able to simulate
actual field experience in the laboratory. This work is on how mixing energy
and shear rate affect the thickening time of cement slurry.
Using conventional pressurized consistometer, fitted with a variable speed
motor, a comparative thickening time test was obtained. This device allows
for simulation of shear rate, temperature and pressure found in the well bore
during pumping. The API procedure was used to evaluate the mixing energy
applied to the slurry.
Results obtained show that for mixing energy, the principal thing is
deflocculation. Once the slurry is deflocculated, then no other effect of mixing
energy is felt on the thickening time and it is not a function of the geometry of
wellbore. Results also show that the temperature profile and geometry of the
well from surface to bottom is an important consideration in modeling the
influence of shear on how long the cement slurry will remain pumpable.
Modeling along this line will lead to optimum slurry quality and design.
Keywords
Introduction
Cementation is important in the petroleum industry. Its uses range basically from
zonal isolation and protecting and supporting casing (main objective) to abandoning a section
of the wellbore. Cement slurry is formed by mixing powdered cement with water. This is a
hydration process. The particles of cement consist of agglomerates/aggregates held together
by different inter-particles forces (van der Waals attractive force).
The mixing process involves:
i. Mixing (wetting)
ii. Deflocculating of agglomerate and aggregates
iii. Stabilization of the resulting suspension (paste)
Wetting requires replacing the air between each particle by water. To do this we must
first deflocculate (breakdown of cement agglomerates and aggregates.) This is achieved by
mixing the mixture at high speed so as to achieve a proper mixture forming the slurry. Mixing
conditions are known to affect the consistency of cement slurry [1].
Cement slurry is placed by pumping to desired location in the well using hydraulic
displacement mechanism. After pumping, the slurry becomes set (hardened), giving favorable
strength. A good advantage of cement slurry is that it is pumpable and hardens readily even in
under-water environment.
The drilling engineer must meet certain requirements for a good job to be achieved.
This requirement is in line with achieving the best cement composition and the best placement
technique.
Requirement for a good cement job include:
1. Composition and placement technique must be chosen so that the cement always achieves
an adequate strength soon after placement in desired location.
2. Cement must remain pumpable long enough to allow placement to desired location.
3. Design must be such that, the length and density of the unset column result in sufficient
pressure to control the movement of pore fluid while not damaging or fracturing the
formation, etc.
In meeting the above requirements, certain tests have to be carried out to determine if
important role in achieving this goal. Some of these parameters are thickening time, rheology,
fluid loss, and setting time [2].
From the foregoing, a lot of requirements have to be met in order to achieve a good
cement job. An important aspect is that the cement slurry must remain pumpable long enough
to allow placement to desired location. To achieve this, we consider the consistency of the
slurry. By this, we are looking at the thickening time of the slurry. The thickening time is the
amount of time that it takes the cement slurry to remain pump-able under downhole condition.
The apparatus used to measure the thickening time is called the consistometer.
Two important factors that affect thickening time are:
1. Shear rate (velocity gradient)
2. Mixing energy.
The definitions of these factors are as follows:
Shear Rate
A fluid traveling between two plates will exhibit a velocity gradient. This velocity
gradient is called shear rate.
γ = (sec ) L
V −1
(1)
For circular object,
γ = (sec ) r
V =ω −1
(2)
where:γ=shear rate, sec-1, L=distance between the two plates, cm, V = velocity of the fluid,
cm/s, r = radius, cm.
Shear rate is influenced by the temperature ranges downhole.
Mixing Energy
As earlier mentioned, cement slurry is a mixture of cement, water and additives. The
mixing process is exothermic and the energy required to do this is called Mixing energy.
Mixing energy can be mathematically expressed as [3, 4]:
V t k m
E = ω2t
where:
÷ E=Mixing energy (kJ)
÷ k=6.1 × 10⁻⁸m5/s (found experimentally)
÷ t=Mixing time (s)
÷ ω=Rotational speed (radian/sec) ÷ m=Mass of the slurry (kg)
÷ V=Volume of slurry in the slurry cup (L)
From the above, it is seen that mixing time and rotational speed are the two parameters
that can affect the mixing energy of any given cement slurry.
Apparatus
Electronic balance:-This is used for weighing dry cement, water and additives used in
preparing the slurry.
Electronic blender:-This is a mixing device used in preparing the slurry. It is a two-speed
propeller type mixer. Normally 600 ml of slurry is prepared. The mixer is operated at 4000
rpm for 15 sec during which the dry cement is added to water. This is followed by 35 sec at 12000 rpm.
Pressurized Consistometer:-This apparatus, which is also called a thickening time tester, is
used to measure the thickening time of the slurry under simulated temperatures and pressures.
It measures the thickening time of the slurry in API consistency [5] unit designated by Bc.
Atmospheric Consistometer:-This is a consistometer that is designed to be used for low
temperature cement system. But today, it is used for conditioning slurries before rheology and
fluid loss tests.
Rotational Viscometer:-This is used to determine the viscometer of the slurry. Most times
this is done after conditioning the slurry in the atmospheric consistometer.
Experimental Procedures
According to API specification [6], the water and cement are measured using the
electronic balance. The water is then poured into the mixing device. The blender is allowed to
rotate for 15 sec at 4000 rpm during the period the cement is added to it. And then is allowed to mix for different duration of time at a rotational speed of 12000 rpm.
Thickening time test
This test is designed to determine how long the cement slurry will remain in a fluid
state under simulated downhole condition without any shutdown periods. After preparing the
slurry in the blender, it is poured into an API slurry cup. The volume of the API slurry cup is
600ml. The slurry cup is then placed inside the consistometer. The temperature and pressure
are set on the machine and then the test is allowed to run. The consistometer used is a high
pressure high temperature (HPHT) consistometer. The heating medium is an oily fluid. The
time it takes to reach a consistency of 100Bc is regarded as the thickening time of the slurry. The shear rate-thickening time data are obtained by using a special consistometer with a
variable speed stepping motor installed in it.
Rheology Measurement
The slurry was prepared in the same way as the slurry used for the thickening time
experiment, applying the same mixing energy for each experiment. The slurry is then taken to
the rotational viscometer where the viscosity is determined. The dial readings at different
rotational speed were obtained giving the slurry behavior at surface condition. After this, the
slurry is poured into a slurry cup designed for an atmospheric consistometer and placed inside
the atmospheric consistometer. This helps to simulate downhole conditions. A heating fluid
supplies the heat after conditioning for 20 min, at simulated downhole temperature of 52°C (125.6°F).
After conditioning, the slurry is now taken back to the viscometer to take the dial
reading again. This gives rheological parameters at downhole condition.
Precautions
1. The slurry must not be kept too long in order to prevent the slurry from caking.
2. Slurry cup must be washed after each experiment.
3. The bob and rotor of the viscometer must be washed in other to remove cement from its
body.
4. Care must be taken in regulating the pressure in the consistometer.
Data Presentation and Analysis
The aim of the experiment is to investigate the effect of mixing energy and shear rate
on the thickening time of cement slurry. In carrying out this experimental research, additives
were not used.
Table-1 shows parameters used for the mixing energy and thickening time experiment:
Table 1. Parameters for the Experiment
Mass of cement 749g
Mass of water 392g
Initial pressure 1000psi
Final pressure 5160psi
Temperature 52oC (125.6oF) Time to temperature / pressure 28 mins
Mixing energy calculation
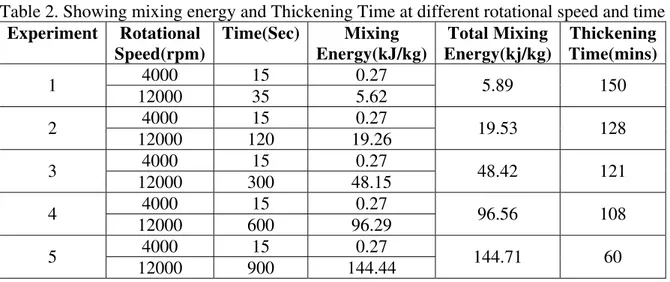
Five experiments were carried out and reported in Table 2 below. The mathematical
expression in equation (3) above was used in computing the mixing energy. The thickening
time data for the different mixing energy are read directly from charts. These charts are
presented in Figure 1–5.
Table 2. Showing mixing energy and Thickening Time at different rotational speed and time
Experiment Rotational Speed(rpm)
Time(Sec) Mixing
Energy(kJ/kg)
Total Mixing Energy(kj/kg)
Thickening Time(mins)
4000 15 0.27 1
12000 35 5.62 5.89 150
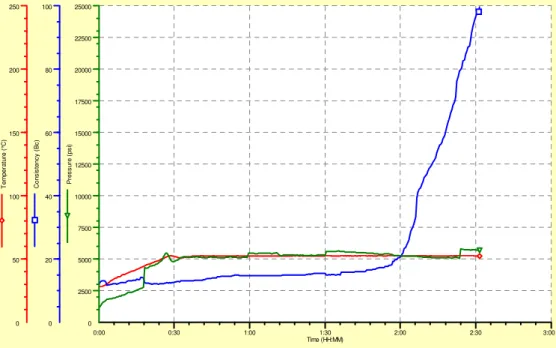
4000 15 0.27 2
12000 120 19.26 19.53 128
4000 15 0.27 3
12000 300 48.15 48.42 121
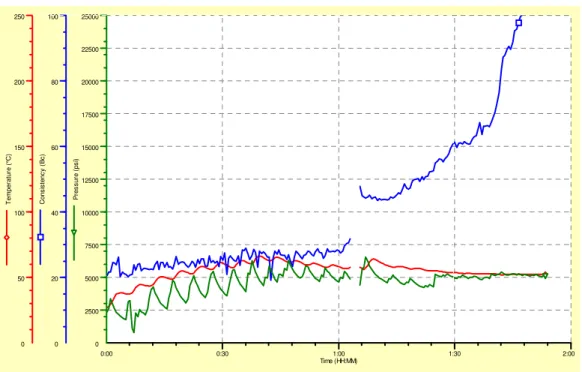
4000 15 0.27 4
12000 600 96.29 96.56 108
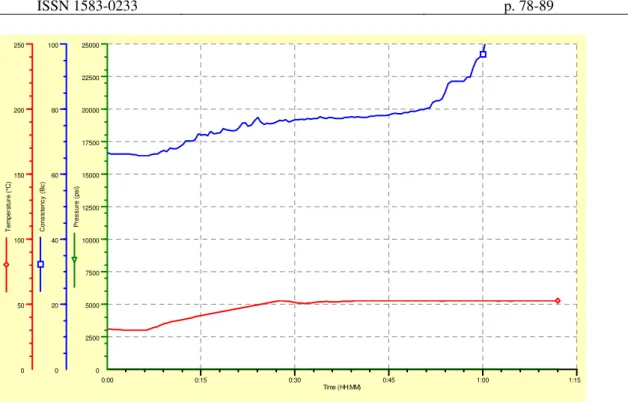
4000 15 0.27 5
Table-2 shows that as mixing time is increased, the mixing energy increases.
0:00 0:30 1:00 1:30 2:00 2:30 3:00
Time (HH:MM) 0 50 100 150 200 250 T em per at ur e ( °C ) 0 20 40 60 80 100 C o n si s te n cy ( B c) 0 2500 5000 7500 10000 12500 15000 17500 20000 22500 25000 P re s s u re (p si )
Figure1. Thickening time chart for experiment 1
0:00 0:30 1:00 1:30 2:00 2:30
Time (HH:MM) 0 20 40 60 80 100 120 140 160 180 200 220 240 T emper at ur e ( °C ) 0 20 40 60 80 100 C ons is tenc y ( B c ) 0 3000 6000 9000 12000 15000 18000 21000 24000 P re s s u re (p s i)
0:00 0:30 1:00 1:30 2:00 2:30 Time (HH:MM) 0 50 100 150 200 250 T em per a tur e ( °C ) 0 20 40 60 80 100 C o n si s te n c y ( B c) 0 2500 5000 7500 10000 12500 15000 17500 20000 22500 25000 P re ssu re ( p si )
Figure 3. Thickening time chart for experiment 3
0:00 0:30 1:00 1:30 2:00
Time (HH:MM) 0 50 100 150 200 250 T e m per atu re ( °C ) 0 20 40 60 80 100 C o n si st e n cy ( B c) 0 2500 5000 7500 10000 12500 15000 17500 20000 22500 25000 P re s su re (p s i)
0:00 0:15 0:30 0:45 1:00 1:15 Time (HH:MM) 0 50 100 150 200 250 T e mp er at ur e ( °C ) 0 20 40 60 80 100 C o ns is te nc y ( B c ) 0 2500 5000 7500 10000 12500 15000 17500 20000 22500 25000 P re s s u re (p s i)
Figure 5. Thickening time chart for experiment 5
Figure 6 is a plot of thickening time against mixing energy. From the graph, it is
evident that as mixing energy increases, the thickening time reduces.
0 20 40 60 80 100 120 140 160
0 50 100 150 200
Mixing Energy (KJ/Kg)
Thickeni
ng Time (Mins)
Figure 6. A plot of thickening time against mixing energy
Shear rate estimation
Using class G cement and additives the shear rate history of the well was analyzed and
the results are presented below. The shear rate was estimated at different temperature as we
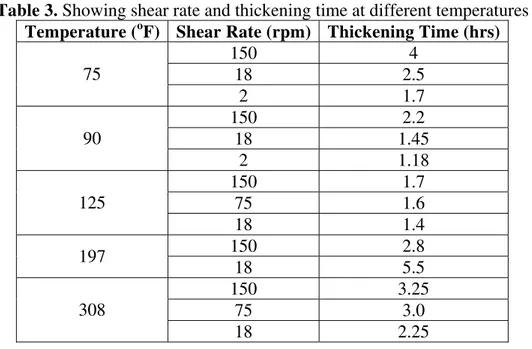
Table 3. Showing shear rate and thickening time at different temperatures
Temperature (oF) Shear Rate (rpm) Thickening Time (hrs)
150 4 18 2.5 75
2 1.7 150 2.2
18 1.45 90
2 1.18 150 1.7
75 1.6 125
18 1.4 150 2.8 197
18 5.5 150 3.25
75 3.0 308
18 2.25
Plotting a graph of shear rate versus thickening time at the different temperatures in
the table above, we have:
0 20 40 60 80 100 120 140 160
0 1 2 3 4 5 6
Thickening Time (hrs)
Shear Rate
(rpm)
75oF 90oF 125oF 197oF 308oF
Figure 7. Shear rate (rpm) versus thickening time (hrs)
From figure 7, it is seen that thickening time in actual field cases is a function of shear
Conclusions
Based on the experiment carried out and research made on the effect of mixing energy
and shear rate on thickening time of cement slurry, the following conclusions are reached:
1. As soon as hydration is initiated, the cement begins to set. This affects the mixing energy
because while mixing, the cement is setting.
2. The critical step in mixing process is deflocculation.
3. As mixing energy increases, thickening time reduces.
4. If the slurry is deflocculated, any further alteration of the mixing energy will have little or
no effect on thickening time.
5. Mixing time is a critical parameter in the mixing process.
6. Low mixing time reduces the yield of the slurry.
7. Long mixing time increases the yield of the slurry.
8. Proper application of mixing energy improves thickening time.
9. Shear rate as gotten from field experience is not represented in the thickening time
experiment in the laboratory. This leads to long waiting-on-cement (WOC).
10.The temperature experienced downhole is important in shear rate-thickening time
derivatives.
Nomenclature
Bc=Bearden unit
References
1. Roy D. M., and Asaga K., Rheological properties of Cement Mixes. III: The Effects of Mixing Procedures on Viscometer Properties of Mixes Containing Superplasticizers, Cement & Concrete Res., Vol. 9, pp. 731-739, 1979.
3. Vidick B., Critical Mixing Parameters for Control of Cement Slurry Quality, paper SPE 18895, pp. 1-4, 1990.
4. Orban J. A., Parcevaux P.A., and Guilot D. J., Specific Mixing Energy: A key Factor for Cement Slurry Quality, SPE 15578, pp. 1-5, 1986.
5. Adams N. J., Drilling Engineering, Pennwell Publishing Company, Tulsa, Oklahoma, p. 290, 1985.