Escola de Ciências
Ana Isabel Carvalho Amorim de Sousa
Impact of Defocus in the Measurement of Light
Distortion: Simulation and Experimental
Measurements
Dissertação de Mestrado
Mestrado em Optometria Avançada
Trabalho efetuado sob a orientação de:
Professor Doutor José Manuel González-Méijome Professor Doutor António Manuel Queirós Pereira
“Life is a series of experiences, each one of which make us bigger, even though sometimes it is hard to realize this. For the world was built to develop character, and we must learn that the seatbacks and grieves which we endure help us in our marching onward.” - Henry Ford
AKNOWLEDGEMENTS
Aos meus pais Amélia e Fernando Jorge, e também aos meus irmãos que mesmo não sendo possível estar sempre juntos, deram-me todo o apoio, força, ânimo e confiança. São a minha grande força e orgulho.
Ao meu amigo e namorado, Vítor, por todo o carinho e apoio em todos os momentos e também a todos os meus amigos que me acompanharam nesta fase e me ajudaram a descontrair quando a minha preocupação e tensão se transformavam extremas, especialmente à Catarina, à Rita e à Marta.
Aos meus colegas de mestrado com quem partilhei diversos momentos caricatos ao longo destes dois anos; pelas experiências e conhecimentos partilhados e pelos dois dias por semana. Foram os melhores dias de toda a vida académica simplesmente pela descontração.
A todos os colegas que fazem parte do Laboratório de Investigação em Optometria Clínica e Experimental (CEORLab). Em especial, à Rute por toda a ajuda e paciência para me ajudar na composição desta dissertação e nas consultas, e pelos conselhos e partilha de opiniões, sempre com a melhor disposição possível. Mesmo quando achava que não havia forma, animava-me sempre. Um muito obrigado também ao Miguel pela ajuda na última fase de simulações e pelas pequenas noções programáticas.
Um especial agradecimento aos meus orientadores, Professor Doutor José Manuel González-Méijome e Professor Doutor António Queirós Pereira, por toda a disponibilidade, partilha de conhecimento e experiências em todas as fases de realização da presente dissertação, e pelo apoio constante em todas as situações bem como no auxílio no tratamento de dados.
A todos os voluntários que disponibilizaram parte do seu tempo para participar neste projeto, um obrigado pela paciência, simpatia e vontade de ajudar.
ABSTRACT
Currently it has been given more clinical relevance to visual disturbances that affect the performance of people in everyday activities, especially in low lighting conditions. In fact, vision quality is related with the resulting intraocular straylight from light scattering on optical means, the intrinsic aberrations of each subject and un-corrected refractive errors. All this can degrade the vision quality by perceiving dysphotopsias around light sources. There are several photic phenomena (like halos and starburst) associated to light distortion limiting the visual performance, especially in low luminance conditions, such as night driving. The association between intraocular light scattering and high-order aberration with visual quality and performance is well known and it is already taken into account in clinical practice for pathological situations, surgical and other visual treatments. It is known how defocus can influence the visual performance related to visual acuity, contrast sensitivity, reading and shapes and patterns recognition. However the increase on light distortion with defocus and its differences between myopes and hyperopes has not been yet studied. Therefore, it is relevant to study the impact of defocus in light distortion measures and how it is perceived, and any additional factors that may influence the visual quality along with the blur caused by non-corrected refractive errors as well, namely the action of accommodation, corneal surface regularity and symmetry and pupil size.
In this cross-sectional study involving 20 healthy subjects the size and irregularity of light distortion surrounding a bright source of light against a dark background were evaluated with the Light Distortion Analyzer (LDA) under low luminance levels with positive and negative induced defocus of 1.00D, before and after the instillation of a cycloplegic drug. From this study we observed that there was a relevant increase on light distortion with both types of defocus (positive and negative) and both types of induced defocus produced similar values of light distortion in size and irregularity. The spherical-like HOA was the ocular aberration that most influenced light distortion measures, mainly its size, but the pupil by itself did not show to have a significant influence. Besides, the topographic indexes SRI and SAI showed to be predictors of visual quality by being positively related with light distortion size. The same it was not verified for the simulated PSF with the psychophysical measure from LDA in both positive and negative induced defocus.
Given the results, we verified that despite the neural capacity of the binocular system to attenuate the monocular effects, the importance and need to correct low refractive errors should not be dismissed, not only for a matter of improvement of visual acuity but also visual quality under dim light conditions.
RESUMO
Atualmente a importância clínica dos distúrbios visuais que afetam a performance das pessoas em atividades do quotidiano, nomeadamente em condições de baixa iluminação, tem merecido relevo pela comunidade científica. De facto, a qualidade visual está relacionada com a dispersão da luz nos meios óticos, as aberrações oculares intrínsecas de cada sujeito e de erros refrativos não corrigidos. Tudo isto pode degradar a qualidade visual através da perceção distorcida de fenómenos luminosos (como halos e estrelas à volta das luzes) que limitam a performance visual dos sujeitos, nomeadamente em condições de baixa iluminação, como é o caso da condução noturna. A relação das aberrações oculares e da dispersão da luz intraocular com a qualidade e performance visual é já bem conhecida e tida em conta na prática clínica em situações patológicas, cirúrgicas e outros tratamentos. Sabe-se de que forma o desfocado pode influenciar a performance visual em termos de acuidade visual, sensibilidade ao contraste, velocidade de leitura, reconhecimento de formas e padrões. No entanto, não se conhece de que forma o desfocado aumenta a distorção luminosa e se difere ou não entre míopes e hipermétropes. Assim, torna-se relevante conhecer de que forma o desfocado tem impacto em medidas de distorção luminosa e como é percebida, bem como quais os fatores adicionais que poderão influenciar a qualidade visual juntamente com o desfocado provocado pela não correção de erros refrativos.
Neste estudo transversal utilizou-se o Light Distortion Analyzer (LDA) para medidas do tamanho e irregularidade da distorção luminosa em situações de baixa iluminação aquando da simulação de desfocado positivo e negativo de 1,00D, após a atuação de um fármaco cicloplégico. Este estudo mostrou haver um aumento relevante da distorção luminosa perante a presença dos dois tipos de desfocado, sendo que ambos desfocados hipermetrópico e miópico produziram valores semelhantes de distorção, tanto em tamanho como irregularidade. A aberração esférica de alta ordem foi a aberração que mais influenciou as medidas de distorção, mas a pupila por si só não mostrou ter influência. Além disso, os índices topográficos SRI e SAI mostraram ser preditores de qualidade ótica ao relacionarem-se positivamente com o tamanho da distorção. O mesmo não se verificou entre a simulação da PSF e a medida psicofísica do LDA para ambos os desfocados positivos e negativo.
Face aos resultados, verificamos que apesar da capacidade psicofísica do sistema binocular de atenuar os efeitos monoculares, não se deve descartar a importância e a necessidade de corrigir os baixos erros refrativos, não só por uma questão de melhoria da acuidade visual mas também de qualidade visual.
INDEX
AKNOWLEDGEMENTS ... v
ABSTRACT ... vii
RESUMO ... ix
ABBREVIATIONS AND ACRONYMS ... xiii
INDEX OF FIGURES...xv
INDEX OF TABLES ... xvii
1. LITERATURE REVIEW ... 19
1.1 Characteristics of optical and retinal image quality of the human eye ... 19
1.1.1 Retinal Image Quality ... 19
1.1.1.1 Ocular Scattering ... 19
1.1.1.2 Wavefront Aberrations... 20
1.1.2 Metrics and Methods for Evaluating the Visual Quality ... 23
1.1.3 Influence of Luminance and Pupil Size ... 26
1.2 Light Distortion and Night Visual Disturbances ... 28
1.2.1 Photic phenomena (starburst, halos and glare) ... 29
1.2.2 Disturbing factors and complaints ... 31
1.2.3 Methods of evaluating Light Distortion ... 33
1.3 Impact of defocus on visual quality ... 35
1.3.1 Defocus and wavefront aberrations... 35
1.3.2 Impact of defocus in Visual Acuity and contrast sensitivity ... 36
1.3.3 Impact of Defocus on light distortion ... 38
2. HYPOTHESIS AND OBJECTIVES OF THE STUDY ... 41
2.1 Problem formulation ... 41
2.2 Hypothesis ... 41
2.3 Objectives ... 41
3. MATERIAL AND METHODS ... 42
3.1 Study design... 42
3.2 Participants and Sample Size ... 42
3.3 Experimental Procedure ... 43
3.3.3 Topography ... 44 3.3.4 Cycloplegia ... 44 3.3.5 Aberrometry... 45 3.3.6 Light Distortion ... 45 3.3.7 PSF Simulation ... 47 3.4 Statistical Analysis ... 47 4. RESULTS ... 49 4.1 Sample Characteristics ... 50 4.2 Visual Acuity ... 50
4.3 High Order Aberrations ... 53
4.4 Light Distortion Analysis ... 54
4.4.1 Comparison between monocular and binocular measures ... 54
4.4.2 Comparison between non-cycloplegic and cycloplegic measures ... 56
4.4.3 Impact of defocus on Light Distortion measures ... 57
4.5 Impact of High Order Aberration on Light Distortion ... 59
4.6 Light Distortion and Topographic quality parameters ... 65
4.7 Relationship between Light Distortion and Visual Acuity... 66
4.8 Light distortion size and PSF ... 68
5. DISCUSSION ... 69
5.1 Visual Acuity ... 69
5.2 High Order Aberrations ... 71
5.3 Light Distortion Analysis ... 72
5.3.1 Comparison between monocular and binocular measures ... 72
5.3.2 Impact of defocus on light distortion ... 73
5.3.3 Comparison between non-cycloplegic and cycloplegic measures ... 75
5.4 Impact of High-Order Aberration on Light Distortion ... 75
5.5 Light Distortion and Topographic quality parameters ... 76
5.6 Relationship of Visual Acuity with Light Distortion ... 78
5.7 Light distortion size and PSF ... 78
6. CONCLUSIONS ... 79
7. FUTURE WORK ... 80
8. BIBLIOGRAPHY ... 81
ABBREVIATIONS AND ACRONYMS
BFCIrreg: Best fit circle irregularity
BFCIrregSD: Best fit circle irregularity standard deviation BFCRad: Best fit circle radius
CSF: Contrast sensitivity function
ETDRS: Early Treatment of Diabetic Retinopathy Study HCDVA: High contrast distance visual acuity
HOA: High Order Aberrations IOLs: Intraocular lenses
LCDVA: Low contrast distance visual acuity
LCDVA+1D: Low contrast visual acuity with +1.00D of induced defocus LCDVA-1D: Low contrast visual acuity with -1.00D of induced defocus LDA: Light Distortion Analyzer
LDI: Light distortion index LE: Left Eye
LOA: Low Order Aberrations
LogMAR: Units of measurement of visual acuity by the Logarithm of the Minimum Angle of Resolution MTF: Modulation Transfer function
p: Statistical significance PSF: Point Spread function Q: corneal asphericity value RE: Right Eye
RMS: Root mean square SAI: Surface Asymmetry Index SD: Standard deviation SRI: Surface Regularity Index VA: Visual Acuity
INDEX OF FIGURES
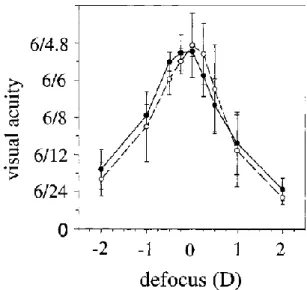
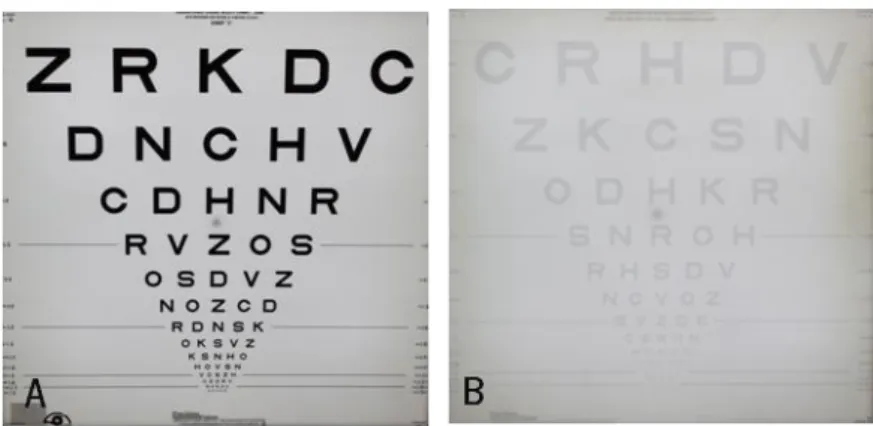
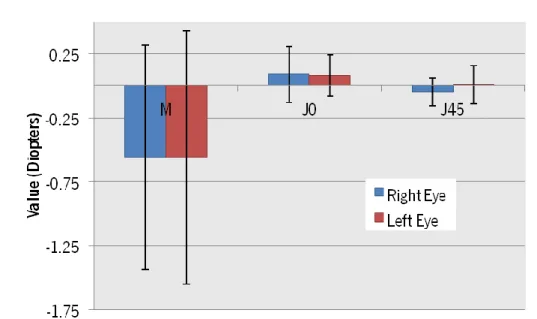
Figure 1.1 Zernike polynomials pyramid up to the 6th order with the correspondent order, frequency and name. Image reproduced from Specialistica, L. (2010).[36] ... 21 Figure 1.2 Simulation of an image distorted by coma-like (A) and spherical-like (B) HOA. Image reproduced from Maeda (2009). [30] ... 22 Figure 1.3 Simulation of a PSF obtained by the effect of spherical-like HOA. Image reproduced from Mello et al. (2012).[60] ... 24 Figure 1.4 Changes in Total HOA RMS magnitude as function of age for different pupil diameters fitted with an exponential function. Image reproduced from Applegate et al. (2007). [48] ... 27 Figure 1.5 PSF as function of pupil diameter in an aberrated eye. As the pupil increase the higher the effect of HOA in PSF, but for smaller pupils the effect of diffraction increases. Image reproduced from Mello et al. (2012). [60] ... 28 Figure 1.6 Pictures from the Quality of Vision (QoV) questionnaire of the night visual symptoms and photic phenomena. Image reproduced from McAlinden et al. (2010). [91] ... 30 Figure 1.7 Visual acuity as function of defocus for 3mm (black circles) and 5mm (white circles) pupil diameter with cycloplegia. Image reproduced from Villegas et al. (2002). [149] ... 37 Figure 1.8 Double-pass images (PSF) for different types and levels of defocus obtained with a 3mm pupil. Image reproduced from Villegas et al. (2002). [149] ... 39 Figure 1.9 Changes in LDI, a size parameter of light distortion from LDA, with positive induced defocus without cycloplegia. Image reproduced from Amorim-de-Sousa et al. (2015). [156] ... 40 Figure 3.1 ETDRS chart for HCVA (A) and LCVA (B) measurement. ... 44 Figure 4.1 Magnitude of the refractive components (M, J0 and J45) from the right and left eyes. ... 49 Figure 4.2 Distribution of high order aberrations (spherical-like, coma-like and total RSM up to 6th order) for the two pupil sizes considered when measured and analyzed the light distortion. Mesopic natural pupil refers to the average pupil size of the sample (5.64±0.65mm). ... 53 Figure 4.3 Mean±SD light distortion size (barplots A and B) and irregularity (barplots C and D) monocular and binocular measures. Statistical differences were found between the monocular and binocular measures for all conditions on light distortion size parameters (LDI and BFCRad). ... 55
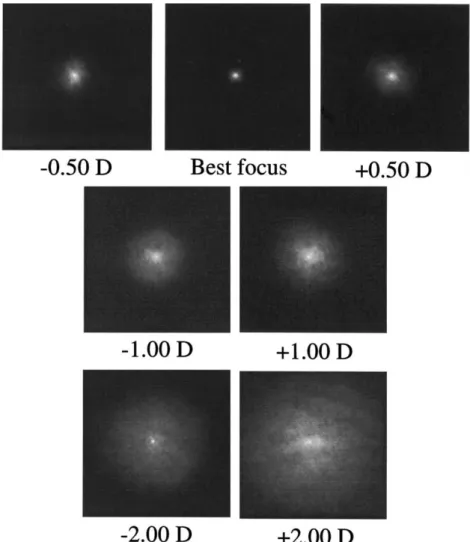
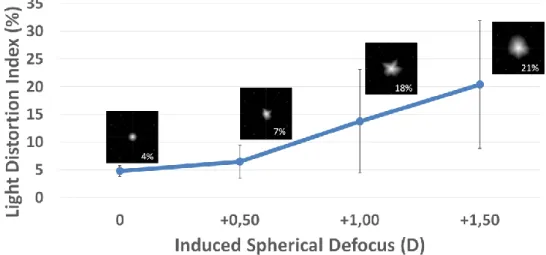
Figure 4.4 Comparison between monocular and binocular light distortion size (barplots A and B) and irregularity (barplots C and D) between non-cycloplegic and cycloplegic measures. ... 56 Figure 4.5 Comparison between monocular and binocular LDA size (A and B) and irregularity (C and D) values (Mean±SD) represented in barplots for negative, zero and positive (-1.00D, 0.00D and +1.00D, respectively) induced spherical defocus in cycloplegic conditions for a 5mm pupil. ... 58 Figure 4.6 Correlations of spherical-like high order aberration with light distortion index (LDI) and best fit circle radius (BFCRad) (graph A and B, respectively) without cycloplegia. ... 60 Figure 4.7 Correlations of total and coma high order aberrations with best fit circle irregularity standard deviation (graph A and B, respectively) with cycloplegia. ... 61 Figure 4.8 Correlation graphs between spherical high order aberration magnitude and the change on LDI (A) and BFCRad (B) when induced a negative defocus under cycloplegia. Aberrations report to the naked eye and not the combination of the inherent aberrations of the eye and defocus induced. ... 63 Figure 4.9 Correlation graphs of the BFCRad with SRI (A) and with SAI (B). The equation of the linear adjusted line is presented, as well the coefficient of correlation and its significance. ... 65 Figure 4.10 Correlation of the changes on LCDVA with the changes on LDI with the positive (green) and negative (red) induced defocus. The results show poor and non-significant correlations. ... 67 Figure 4.11 Correlation between the radius of the best fit circle adjusted (BFCRad (mm)) to light distortion and the simulated projection of the PSF (arcmin) with positive (A) and negative (B) induced defocus of 1.00D in cycloplegia conditions. ... 68 Figure 5.1 Representation of simulated PSFs for different levels of defocus (from +1.50D to -1.50D) in three different cycloplegic situations. ... 74
INDEX OF TABLES
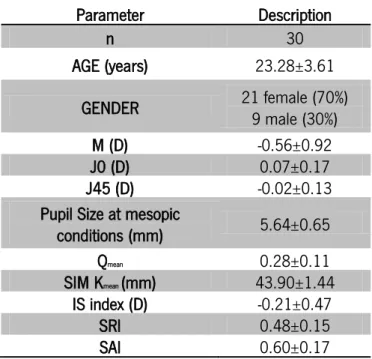
Table 4.1 Demographic characteristics of the sample expressed in Mean±SD. ... 50 Table 4.2 Monocular and binocular LogMAR visual acuity (Mean±SD) measured in non-cycloplegic and non-cycloplegic conditions for four different conditions. ... 51 Table 4.3 Monocular and binocular differences (Mean±SD) between the four conditions tested (LogMAR scale) measured without and with cycloplegia. ... 52 Table 4.4 Total HOA, Spherical and Coma RMS aberrations (Mean±SD) under non-cycloplegic and cycloplegic conditions with the respective pupil size during the measurements. ... 53 Table 4.5 Differences in Total HOA, Spherical-like and Coma-like RMS aberrations (Mean±SD) between non-cycloplegic and cycloplegic measures for the respective pupil sizes. ... 54 Table 4.6 Correlations between the high order aberrations (for a 5mm pupil) and the changes on light distortion parameters with cycloplegia. The changes in light distortion parameters are between no induced defocus and positive induced defocus, and no induced defocus and negative induced defocus. Statistically significant correlations are highlighted in bold. ... 62 Table 4.7 Correlations between the changes on high order aberrations and the changes on light distortion parameters. The changes are between non-cycloplegic values and cycloplegic values. No statistically significant correlations were found. ... 64 Table 4.8 Monocular differences on LCDVA and light distortion parameters in their own units with the positive and negative defocus, in cycloplegic conditions. ... 66 Table 9.1 Differences and correlations between the right and left eyes for all the measurements. ... 96 Table 9.2 Differences and correlations between the monocular and binocular light distortion parameters. Statistical significant differences and correlations are highlighted... 98 Table 9.3 Differences between light distortion parameters without and with cycloplegia in monocular and binocular conditions, with the best distance correction. Statistical significant differences and correlations are highlighted. ... 99 Table 9.4 Differences and correlations between light distortion parameters in monocular and binocular conditions between the different levels of induced spherical defocus, always with the best distance correction. Difference values refer to “second condition – first condition”. Statistical significant differences and correlations are highlighted. ... 100
Table 9.5 Correlations between light distortion parameters in monocular conditions with the three types of high order aberrations evaluated (Total, Spherical and Coma HOA). Statistical significant correlations are highlighted. ... 101 Table 9.6 Correlations between topographic parameters of corneal quality and light distortion measures at different conditions of measurement of the light distortion. The highlighted values respect the significant correlations found. ... 102 Table 9.7 Correlations between the variation on monocular LCDVA with a positive and negative defocus and the variation on monocular light distortion parameters in cycloplegic condition with positive and negative defocus. No statistically correlations were found. ... 103
1. LITERATURE REVIEW
The human eye is a complex and imperfect optical system. Nowadays, the evaluation of visual quality goes beyond the measurement of visual acuity and the compensation of the refractive error. The image quality of the human eye is affected not only by the uncorrected refractive error and caused diffraction, but also by optical wavefront aberrations and light scattering that may produce a decrease on visual quality. Halos, starburst and scattering are some phenomena produced by the ocular wavefront aberrations, uncorrected refractive errors and other factors that degrade the optical eye quality when observing a bright light source, resulting on a distorted light image. The Light Distortion Analyzer (LDA) is a device that measures and quantifies the size and shape of this light distortion. In this literature review we will address topics and issues related to visual quality, since the characteristics of the retinal image quality, the factors that contribute for its degradation and how defocus may influence the light distortion and degrade de visual quality.
1.1 Characteristics of optical and retinal image quality of the human eye
1.1.1 Retinal Image Quality
The quality of the retinal image depends on the intraocular scattering, low- and high-order wavefront aberrations and uncorrected refractive errors. These phenomena are the main responsible for the degradation of optical quality and each one of them has its contribution on retinal image formation. [1-7] In this chapter it will be described which components are most important and have impact on the quality of the retinal image and which metrics are most used in order to classify them.
1.1.1.1 Ocular Scattering
Light scattering is a physical phenomenon in which light rays are deflected and deviated from the theoretical straight trajectory due to optical irregularities or non-homogeneities. These irregularities are characterized by variations on media’s refractive index and the presence of small particles of different sizes and foreign bodies, inducing the combination of light diffraction,
scattering is most usually due to changes on refractive index of the different structures of the eye (cornea, iris, sclera, crystalline lens, vitreous humor and retina). [1 3 10-21] Light scattering effect is also described as the angular distribution of the light intensity in the retina.[1 2]
There are two kinds of ocular scattering: the backward scatter, which is the amount of scattered light widespread out of the eye,[22] and the forward scatter, which is the light spread at low angles over the retina.[1 2] The backscattered light allows evaluating the quality of ocular tissues, so the most important component capable of compromise the retinal image by straylight is the forward intraocular scattering.[1 10 23 24]
Some authors suggest that the straylight in the retina increase with age in normal eyes due to transparency loss of ocular media, namely lens opacities. Straylight tend to double with the age compared to young healthy subjects. [3 10 11 19 23 25-27] Intraocular scattering affect the retinal image quality by decreasing the retinal image contrast when a bright light source is presented.[2] When the transparency of the ocular media and the organization of the histological structure are compromised, the intraocular scatter becomes more relevant, creating a decrease on retinal image contrast. Many ocular conditions can compromise the transparency and organization of the tissues, like corneal dystrophies, cataracts, vitreous changes, diabetic retinopathy and age-related macular degeneration.[3 10-19] So, in general terms, when any ocular condition decreases the transparency of the ocular tissues, it is accompanied by an increase in intraocular scattering and a consequent decrease of image contrast.[1 17]
1.1.1.2
Wavefront Aberrations
Such as scattering, wavefront aberrations change the trajectory of light rays propagation, but in a different way. The wavefront aberrations are defined as the wavefront deviation from a reference ideal optical system due to irregularities in the shape of optical surfaces. Aberrations can be described as chromatic – the defect occurs for different wavelength - and monochromatic - the defect only occurs for one wavelength.
The monochromatic aberrations are the type of aberrations that can cause the degradation of the retinal image by the straylight of a bright light source. On healthy eyes, where the transparency of ocular media is not compromised, the scattering quantity is almost irrelevant,
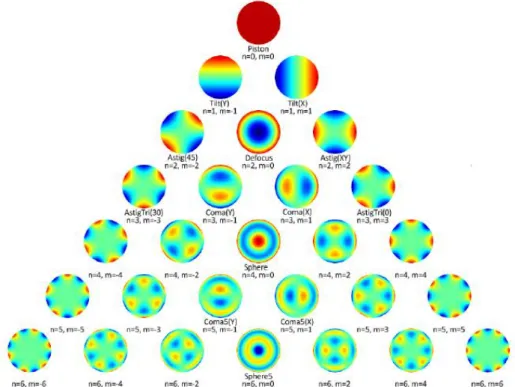
which means that the ocular wavefront aberrations are the responsible for image degradation. These irregularities are mainly originated from cornea and crystalline lens, wherein the aberrations from crystalline lens compensates a proportion of aberrations from cornea.[3] Wavefront aberrations are described by mathematical expansion series named Zernike polynomials that extract the components of the wavefront error.[4 28-32] Zernike polynomials (or coefficients) are organized into a pyramid by different orders, with one or more terms in each order (Figure 1.1) represented by Znm, where n is the order of the term and m is its frequency, and expressed in microns (µm). [28 32-34]The value of the total wavefront aberration is calculated by the root mean square (RMS) which is the square of the sum of the squares of each Zernike coefficient. The higher the coefficient value, the greater the impact on the total RMS wavefront error, leading to a decrease in the optical performance. [29 35]
Figure 1.1 Zernike polynomials pyramid up to the 6th order with the correspondent order, frequency and
name. Image reproduced from Specialistica, L. (2010).[36]
Aberrations are grouped into low- and high-order aberrations (LOA and HOA, respectively). LOA includes 0 to 2nd order Zernike terms and it refers to the tilts, prism and to the conventional refractive error (defocus and astigmatism). The 2nd order aberrations (defocus and astigmatism) are the main responsible for blurred retinal images and are the only ones that are routinely corrected with spectacles or soft contact lens.[37] Defocus and astigmatism are the most
normal eye.[38] Zernike terms from the 3rd order and above are included in the HOA group. Although HOA have a small contribution on the total eye’s aberrations, their effect on image quality has been reported once their correction could significantly improve visual performance, particularly in eyes with corneal diseases, by ameliorating the retinal image quality. [4 39-43]
The amount and distribution of wave aberrations tend to be smaller with the increasing order and vary among the population. In general, the magnitude of HOAs tends to be around zero, except for 3rd order coma-like (horizontal trefoil, vertical and horizontal coma and oblique trefoil) and 4th order spherical aberrations.[7 33 38 44] In normal eyes, spherical (Z40) and 3rd order coma aberrations tend to be slightly positive and oblique trefoil (Z33) tend to take negative values. Even if their magnitudes are low, these aberrations have a negative influence on retinal image quality and in healthy eyes they may be the most responsible for night vision complaints.
Figure 1.2 illustrates how these three aberrations can distort individually an image. The total magnitude of coma and spherical aberrations are the result from the magnitude of these aberrations on the cornea that the crystalline lens does not offset. [3 7 44-47]
Figure 1.2 Simulation of an image distorted by coma-like (A) and spherical-like (B) HOA. Image reproduced from Maeda (2009). [30]
Of all the HOAs, the wavefront aberration that clinicians give more attention is the spherical aberration. This is because in normal healthy eyes the spherical-like HOA tends to be more positive values and with a major magnitude than the other HOA and because increases with the pupil dilatation. [7] Total Spherical-like HOA normal RMS was found to be approximately 0,15µm for a 6mm pupil diameter in subjects between 20 and 29 years old. [48]
Many factors can induce changes in normal wavefront aberrations including ageing [30 48 49], accommodation [50 51], changes in tear-film volume and dynamics [52], contact lens [53], corneal pathologies [54 55], surgical and non-surgical corneal treatments [56 57] and cataracts. [30 58] This issue it
will be addressed in subsection 1.2.1., as the relationship between refractive error/defocus and wavefront aberrations in subsection 1.3.2..
1.1.2 Metrics and Methods for Evaluating the Visual Quality
As referred before, intraocular forward scattering, eye aberrations and diffraction are the responsible for the imperfection of the optical system. When evaluating the quality of vision by analyzing the effect of scattering and wavefront aberrations, there are several metrics/parameters that allow us to get a sense of how the retinal image is affected; for example, an aberrated eye produces a more extended and asymmetric retinal image. The most common metrics used to estimate the deterioration on image quality beyond the RMS are the point-spread function (PSF), the modulation transfer function (MTF) and the Strehl ratio (SR).
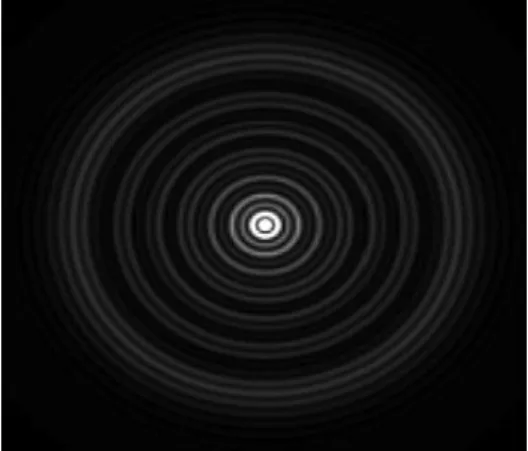
The PSF is the light distribution of a point object at the retinal imageand it is limited by the straylight/intraocular forward scattering and by the wavefront aberrations of the eye at the exit pupil. [1-3 16 59-61] This parameter defines the way a certain amount of light is redistributed and how it looks after passes through an optical system.[62] In practical terms, the PSF corresponds to the light distribution surrounding a bright spot light when seen against a dark background. [63] Its outer part, which goes beyond 1º of its distribution, is called straylight and it is the cause of disability glare and other visual complaints.[1 16] While the external contour of the PSF corresponds to the scattering effect – straylight -, which strongly declines with the increasing angle, the central area is mainly affected by ocular aberrations. [1 63] The effect of aberrations on PSF is based on the magnification of the straylight and reduction in contrast of the retinal image. Each wavefront aberration can be represented by its own PSF [60 62]: for example, Figure 1.3 illustrates the PSF of optical effect induced by Z40 aberration. Some studies show that PSF influence the patients’ night visual complaints and is a reliable method for their validation.[62 63] The MTF and the Strehl ratio are derived from the PSF and provide quantitative data to evaluate the impact of aberrations in visual quality.
Figure 1.3 Simulation of a PSF obtained by the effect of spherical-like HOA. Image reproduced from Mello et al. (2012).[60]
The MTF is an optical metric of image quality for grating objects representing contrast information of an image.[62] This function describes the variation of image contrast with the spatial frequency by measuring the contrast losses produced by an aberrated optical system.[1 3 33 59-62] The MTF differs with grating orientations and its values may vary from 0 to 1, where 1 indicates that the image contrast was 100% maintained from the object and describes an eye without any imperfection in the optical system– a perfect ideal eye – and 0 means that the image contrast was completely degraded so that the grating cannot be distinguished.[33 62] So, the lower the MTF values, the lower the contrast of the image and the poorer the retinal image quality. Once MFT is directly related to the decreasing contrast with the increasing spatial frequency, it is usual to associate it with the contrast sensitivity function (CSF) which represents a psychophysical measure of the contrast perception as a function of spatial frequency. These two metrics, MTF and CSF, are associated with NTF (retinal brain function) so that CSF depends on MTF and NTF. For example, after an ocular surgery, if there were not changes in NTF, the functional vision (CSF) will be proportional to the optical quality (MTF). Marcos et al. (2001)[64] found that a decrease in MTF was accompanied by a decrease in CSF in post-LASIK myopic patients. However, if MTF do not suffer changes, any improvements on CSF will be proportional to increases on NTF by neural adaptation.[65] Because of this proximity between the two metrics (MTF and CSF), the MTF can be obtained by the direct measuring of the CSF with sinusoidal fringes as the ratio between the conventional CSF and the interferometrical CSF - this was how the MTF was early obtained.[3]
Although the Strehl ratio (SR) metric is useful to describe the PSF of an eye [33], it can be also obtained from MTF. The SR is defined as the ratio between the actual peak intensity of an eye’s PSF with aberrations and the peak intensity of a diffraction-limited (aberration-free) PSF, or
equivalent, as the ratio between the volume of the actual MTF and the volume of a diffraction-limited MTF. This comparison is also taken for the same pupil size.[1-3 33 59-62] Its values range from 0 to 1, wherein 1 corresponds to a perfect optical aberration-free system.[33 60] This means that the higher the values of the Strehl ratio, the lower the values of RMS and the better the retinal image quality. It is usually considered a SR higher than 0.8 for a diffraction-limited system [3 33 61] and for lower levels of SR the extent and shape of the external contour of the PSF becomes more important than its peak value degrading the image quality.[59]
Different methodologies have been proposed and described in order to quantify the retinal image quality through the visual quality metrics described above, but only a few were approved and validated. The procedures could be from psychophysical to optical approaches. In optical methods, the Double-pass (DP) system and the Hartmann-Shack Wavefront Sensor (HSWS) are the methods used to objectively quantify the visual performance by ocular scattering and wavefront aberrations. The devices may be based in one of them or in both together. The DP system records the retinal image after a beam double-pass through the ocular media and reflects on the retina. The DP system provides information about the PSF, its external contour and limited to small angles, and the MTF can be calculated from the images obtained.[1 3] Relative to HSWS, this optical method is mostly used to measure the ocular aberrations and provide their Zernike polynomials magnitude but can also provide information about the MTF. [60 66 67] However, the MTF obtained by the DP system overcomes the one obtained by the HSWS system because the DP system is more sensible to the scatter than the HSWS one, producing a more accurate description of the optical quality.[1 7 68] The Compensation Comparison method is the most relevant psychophysical procedure to measure the intraocular forward scattering and it is the basis of the development of a commercially available device, the C-Quant. This psychophysical procedure is a 2-alternative forced-choice method in which the subject should compare and equalize the two stimulus presented in the two halves of a central ring while a flickering stimuli (that use glare) is presented in a peripheral ring. The results are provided in a psychometric curve for the magnitude of forward scattering in log units, [1 23 69] so the higher the logarithm of scattering, the higher the intraocular forward scattering.[1 70 71]
Like ocular scattering and wavefront aberrations, the PSF, MTF and Strehl ratio can suffer changes due to media’s transparency loss and changes in the structure of the ocular
elements. There are several studies founding changes in these visual quality metrics, proving the affectation of vision (see subsection 1.2.1).
1.1.3 Influence of Luminance and Pupil Size
The human eye is a complex optical system and relies on the optical quality and transparency of its components. Besides the ocular scattering, eye aberrations and diffraction the quality of vision also depends on the luminance of the background and on the pupil's aperture.
Luminance is a photometric measure that describes the amount of light passing through a defined area and reaches a particular solid angle by measuring the luminous intensity per unit area of light in a given direction. Its International System unit is candela per square meter (cd/m2). [72]In the optics domain, the luminance conditions of a specific scene can be classified in photopic (10 to 108 cd/m2), mesopic (10-3 to 100.5 cd/m2) or scotopic (10-6 to 10-3 cd/m2) luminance levels. [72 73]
It is well known the relationship between the luminance and the pupil diameter. The iris muscle controls the pupil size in order to control the amount of light entering the eye.[38] So, for higher amounts of luminance (photopic levels) the iris muscle constricts decreasing the pupil aperture, leading to a minor amount of light reaching the retina. The opposite happens to the pupil diameter when the luminance decreases. In these terms, pupil size and luminance are always related and they should have been taken into account in every clinical and experimental situation.
Usually in the routine clinical examination the visual acuity is only measured under optimal conditions, which means a high luminance background and contrast targets. However, under mesopic and scotopic conditions the visual acuity tends to be worse than that on optimal visual conditions. [74-76] Johnson & Casson (1995) [76] found that the LogMAR visual acuity increases linearly as the logarithmic luminance decreases, which means that the visual acuity decrease with the decreasing luminance. Besides, they also found that when contrast and luminance are reduced the visual acuity is degraded by a greater amount than that produced by only one of these factors alone and that when there are a few factors influencing the visual acuity they appear to have an additive influence. However, Simpson et al. (1986)[77] found that with low luminance levels the effect of blur on visual acuity is lower than with high luminance levels.
The visual performance it is also dependent on the Stiles-Crawford effect (SCE) – phenomena where the light passing through the edge of the pupil does not appear as bright as light passing through its centre (Stiles & Crawford, 1933)[78]. This effect reduces the effective retinal luminance but, as suggested by many authors [79-81], it can improve spatial vision with large pupils by attenuating the influence of defocus and aberrations on vision.
The pupil diameter considered to provide the best resolution is around 3mm because it is the pupil size which balances the contribution of the HOA and diffraction producing a minor degraded image. However, this depends on subject’s wavefront aberrations distribution and on the wavelength. Several studies shows that the retinal image quality decreases most often under scotopic or mesopic conditions when the pupil reaches its maximum diameter. [48 76 82-85] As the pupil size increases so does the ocular aberrations (Figure 1.4) and the external contour of the PSF (Figure 1.5) reducing the retinal image quality by the increased blurring effect. The opposite happens with the Strehl ratio that becomes lower as the pupil becomes bigger. [60 86] Spherical-like HOA (4th and 6th order) are among those that degrade the image quality in a more significant manner as the pupil dilates. Therefore, they become increasingly important at low luminance levels which is particularly important in subjects who underwent refractive surgeries.[85 87]
Figure 1.4 Changes in Total HOA RMS magnitude as function of age for different pupil diameters fitted with an exponential function. Image reproduced from Applegate et al. (2007). [48]
Nevertheless it cannot be admitted that the image quality is better for smaller pupils. For a pupil size below 3mm the image quality is less influenced by aberrations due to the diffraction effect which predominate above aberrations. Decreasing the pupil diameter can also degrade the image quality by restriction of the amount of available light although it allow the depth of focus to
increase.[2 3 7 38 60 87] On Figure 1.5 are represented the changes in PSF with the pupil diameter of an aberrated eye, demonstrating how diffraction and HOAs can distort a light spot.
Figure 1.5 PSF as function of pupil diameter in an aberrated eye. As the pupil increase the higher the effect of HOA in PSF, but for smaller pupils the effect of diffraction increases. Image reproduced from Mello et al. (2012). [60]
1.2 Light Distortion and Night Visual Disturbances
Nowadays the number of people going to an ophthalmology/optometry appointment with complaints of how the light of the cars bothers them when driving at night have been grown. These complaints are not only perceived by normal healthy subjects, but almost for the entire population, especially those who undergone ocular surgeries, have transparency loss, uncorrected refractive errors and others. According to Jabbur et. al (2004) [88] the most subjective complaints of dissatisfied patients after a refractive surgery were blurred distance vision (59.0%), glare and night vision disturbances (43.5%). In fact, the image quality degradation is due to the summation of intraocular scattering, ocular aberrations and uncorrected refractive errors. In healthy eyes these factors reduce the image quality due to the distorted light reaching the retina, leading to a perceived blurred and distorted image and glare. This happens mainly at night when pupil is physiologically dilated and when images are viewed against a dark background. In this section it will be described the photic phenomena causing light distortion related to subjects complaints at night and the factors causing the disturbances, as well as the most recent methods of evaluating the light distortion.
1.2.1 Photic phenomena (starburst, halos and glare)
Many people complaints about poor night vision due to photic phenomena caused by light distortion. The photic phenomena of light distortion described in literature are glare, starburst, haloes, hazy vision, monocular diplopia and polyopia and defocus. [62 87-96] These phenomena are also known as dysphotopsias. Jabbur and his co-workers (2004) [88] reviewed the complications of dissatisfied patients who undergone refractive surgery and they found that the most common complaints were blurred vision, glare and night vision problems, such as halos, multiple images and hazy vision.
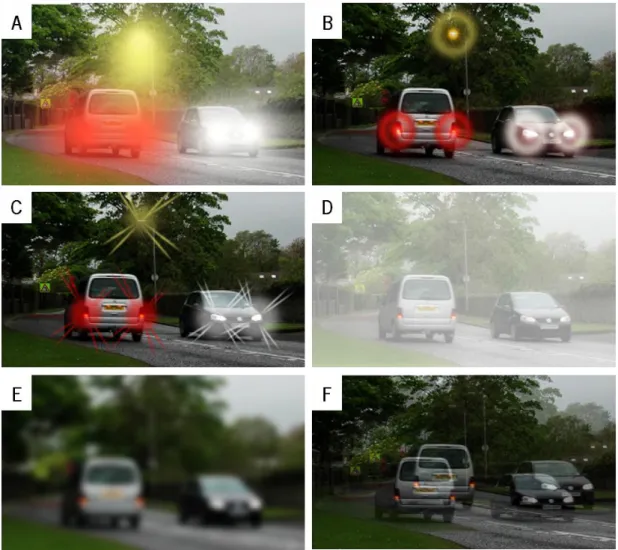
To better understand these complaints there is a need of defining the terms. Images from the QoV [91] are used to exemplify each photic phenomenon.
In general, glare (Figure 1.6A) refers to a light source appearing bright and intense and it is caused by scattered rays in light path from media opacities.[92 97] Glare phenomena can be divided into discomfort glare and disability glare.[15 25 87] The first one is a subjective discomfort sensation induced by a bright light source without causing significant losses in visual performance [15 25] while disability glare is associated to a functional impairment affecting the retinal image contrast.[23 25 26 87]
Halos (Figure 1.6B) and Starburst (Figure 1.6C) are night visual disturbances phenomena that degrade the size and shape of a light source. Halos are among the most reported phenomena next to glare and can occur with or without starburst. This light disturbance is perceived as circular shadow surrounding a light source and it is caused by refractive phenomena. Usually they are assumed to be a consequence of the contribution of the spherical high-order aberration, especially when in refractive surgeries the treated optical area is smaller than the pupil diameter in mesopic and scotopic conditions.[87 93] Starburst is a radial or regular radiating scatter of light from a point source affecting its size and regularity. This phenomenon might be explained by the diffraction of light at the crystalline lens suture lines formed by the union of their fibers. [98] It is commonly described as a star image for almost every people, even the ones who wear glasses and contact lens, especially when they are under-corrected or not corrected at all.[87 92 93]
Other photic phenomena are hazy vision (Figure 1.6D) and blurred or defocused vision (Figure 1.6E) and they are usually confused. Hazy vision is usually caused by loss of transparency of the ocular media and it is defined by a reduced visibility with contrast losses. Patients used to report complaints of foggy vision such as when looking through a foggy window. Defocused vision is caused by an uncorrected refractive error and the limits of images sharps seem to not be clearly.
Monocular diplopia and polyopia (Figure 1.6F) are normally associated to ocular diseases but in this case can be a consequence of light distortion. Also known as ghosting, this phenomenon is perceived as a partial troubled faint or a double/multiple images that overlap.[92]
Figure 1.6 Pictures from the Quality of Vision (QoV) questionnaire of the night visual symptoms and photic phenomena. Image reproduced from McAlinden et al. (2010). [91]
All the described night vision disturbances are mainly reported by people with ocular pathologies, corneal changes and subjects submitted to refractive treatments (surgical and
non-surgical) – see subsection 1.2.2 - but can also be reported from subjects with uncorrected refractive errors (section 1.3) or even well corrected patients.
1.2.2 Disturbing factors and complaints
In healthy young subjects, the night visual complaints are due to the magnitude of the intrinsic ocular aberrations of each subject. The night visual complaints have implications on quality of life and in many living activities. Driving at night is one of the living activities which performance can be diminished due to the visual disturbances caused by light distortion. [15 25 74 75 89 99-103]
Whenever there is a change in the optical components of the eye, the quality of the image on the retina can be changed and usually reduced. As seen in anterior sections the transparency loss of the optical components of the eye, ocular aberrations and changes in the refractive index of the different ocular components can alter the light path by dispersion and scattering, culminating into light distortion perception. Having this into account, whenever there is an ocular pathology changing the media transparency or the propagation of light rays, the light reaching the retina will be distorted and the retinal image will not be clearly perceived.
There are many studies that evaluate the image quality changes due to different pathologies, conducting to a light distortion. There are many studies relating changes in intraocular straylight and wavefront aberrations due to ocular pathologies, such as cataract [11 15 19 23 25 70 99 104 105], age-related macular degeneration [86 106], keratitis [86 106 107] and keratoconus [3 12 17 23]. In these studies it is reported an increase in intraocular scattering due to the changes in media transparency or due to changes in ocular aberrations resulting from corneal changes. In general they found a decreased in contrast sensitivity at almost all the frequencies tested, a decreased MTF, lower values of Strehl ratio, less intense and more spread PSF and a higher light distortion disturbance perceived by subjects affected with the mentioned conditions. So, at some point the straylight and light distortion evaluation can be an important method to assess and classify the severity level of the pathological conditions. [10 12 15 30 60 97 105 108]
increased straylight induced by 10% of corneal swelling related with hydrophilic contact lens wear. However, the straylight values decline linearly with time as the corneal swelling decreased after contact lens removal. [53 60 109]
Not only pathologies alter the media’s transparency and the refractive index. Nowadays, refractive surgeries have a great impact on visual quality due to the changes in the ocular wavefront aberrations. There are many reports of night visual disturbances complaints among subjects that undergone a refractive surgery with LASIK [56 62 71 84 85 87 88 93-95 97 101 110-115] and PRK [116 117]. Among others,Ortokeratology is a refractive non-surgical treatment that also changes the ocular aberrations and increases the light distortion.[85 115 118-120] All these refractive treatments were found to increase the light distortion due to an increase in high order ocular aberrations, especially in 4th order spherical aberration, which in myopic ablation it is positively induced.[121] This consequently increases the halo size compared with the halo without any invasive refractive treatment. In these refractive treatments the haloes complaints are usually associated to a larger pupil diameter compared with the optical treatment zone.[84 87 94 110] However, some authors do not consider that the pupil size is a predictor of the night visual complaints.[95 111 112 114] Once again most of the studies about the increase on night visual complaints and light distortion also report decreases on contrast sensitivity MTF and Strehl ratio, such as in pathologic conditions. Reinstein et al. (2012)[122], Schallhorn et al. (2009)[101] and Oshika et al. (2006)[56] found that the subjects undergoing LASIK with wavefront-guided technique had less night visual complaints than subjects submitted to conventional LASIK. Other common refractive treatment that could cause night visual disturbances complaints are the implantation of intraocular lens. [101 123-131] This is especially important for multifocal and diffractive lenses implantation for presbyopia correction. While some authors [126 127] found the performance with refractive multifocal IOLs to be comparable with monofocal IOLs, Brito and his coworkers (2015) [129] found an increased light disturbance although the good functional visual performance with diffractive multifocal IOLs. Besides Vega et al. (2015) [125] found differences in optical quality, through-focus performance and halo of four diffractive multifocal IOLs.
Castro et al. (2014) [82] evaluated the influence of alcohol consumption on the retinal image quality and night vision performance under conditions of low illumination. They found that the alcohol levels deteriorated the retinal image quality and the visual performance at night, being the deterioration positively associated with high alcohol levels consumption.
The influence of refractive errors on light distortion will be discussed on section 1.3. In summary, besides diffraction, light distortion also depends on the summation effect of intraocular scattering and high order aberrations. As seen above, in cataractous eyes the intraocular scattering is more relevant on light distortion and night visual complaints than the ocular aberrations, but when the corneal optical integrity is altered the ocular aberrations are the main responsible for the night visual disturbances.
1.2.3 Methods of evaluating Light Distortion
Nowadays, light distortion is currently taken into account on a clinical examination. In order to assess how patients perceived a bright light spot in low luminance levels and to understand how their quality of vision are affected by scattering, high-order aberrations and other factors, many researches created different methods of evaluating the visual performance and light degradation. In this study we will only refer the ones seems more relevant and more used in the scientific community.
There are psychophysical and optical methods to measure and quantify the straylight. In psychophysical procedures the evaluation depends on the subject’s response and performance while in optical procedures this is not an issue. However, the psychophysical procedures allows to have more meaningful results because translate the actual visual function of the subjects and the optical procedure have the disadvantage of being limited in the angular domain, which make it less functional.[1]
The optical methods most commonly used are the Optical Quality Analysis System (OQASTM, Visiometrics S.L., Terrassa) and Hartmann-Shack Wavefront sensor. The OQAS is based on a double-pass system for the analysis of the PSF of the retinal image and is capable of calculating the MTF, always considering the scattered light and the high-order aberrations.[1 18 19 70 86 106 132] Hartmann-Shack sensor is most commonly used to measure the ocular aberrations in a single direction, not being sensitive to the dispersed light and underestimating the visual quality in high glare situations.[1 67 68]
One of the most frequent psychophysical methods for the measurement of straylight is the compensation comparison method – the C-Quant Straylight Meter (Oculus Optikgeräte GmbH, Wetzlar-Dutenhofen, Germany). In this method the subject has to compare two central stimuli flickering in counter-phase and decide which flickers more strongly, while a peripheral flickering stimulus is presented in order to induce scattering. This is a two-alternative forced-choice method so the subject has to answer even when do not perceive differences.[1 17 23 26 63 71 105 111 133 134] Other psychophysical methods of evaluating light distortion are based on a central high-luminance stimulus inducing glare over a dark background and the subject has to detect a luminous peripheral stimulus around the central one. The instruments are Halo v1.0 software (Laboratory of Vision Sciences and Applications, University of Granada, Spain) [82 96 102], Starlights system (Novosalud, Valencia, Spain)[94 114] and Light Distortion Analyzer (LDA, CEORLab, University of Minho, Braga, Portugal)[119 129 135 136]. The difference between LDA and the other two instruments (Halo v1.0 and Starlights) is that LDA allows “to measure the light distortion under more realistic conditions using hardware with physical LEDs”[136] while the Halo v1.0 and Starlights use a computer screen display with projected light spots for the generation of glare and peripheral stimuli.[82 94 96 102 114] For that reason in this study we will use the Light Distortion Analyzer to evaluate and quantify the size and irregularity of light distortion. The instrument will be described in section 3.3.6.
There are many other instruments referred in the literature to quantify light distortion, or straylight, and evaluating how it degrades the retinal image with psychophysical and optical principles.[15 87 97 105 108 127 128 137 138]
Apart from these, McAlinden and its coworkers (2010) [91] developed a different way of measure the subjective quality vision by an inquiry. They called him Quality of Vision (QoV) questionnaire. The QoV Questionnaire consists on a Rasch-model test linearly scaled with ten items with three questions each, providing a quality of vision score for symptoms’ frequency, severity and bothersome, resulting in a questionnaire with thirty item in total.[91] This questionnaire is already validated and requires an authorization of the corresponding author to calculate the score.
1.3 Impact of defocus on visual quality
Uncorrected refractive errors are one of the leading causes of visual impairment, in a significant proportion of the general population, even in developed countries, either if they are undiagnosed or inadequately corrected. [139-143] These refractive errors generate blurred/defocused retinal images, reducing the contrast of the images and inflict a lower limit to visual perception. [2 5 74] The defocus produced by the non-correction of the refractive errors reduces the visual performance of young and elder people on almost every visual task. Many studies [74 75 100] shows that the induced defocus have a detrimental impact on driving performance, especially at night. Cohen and coworkers (2007)[103] investigated the relationship between night myopia and the number of driving accidents in a group of professional drivers and they found that when subjects presented night myopia over 0.75D they are more likely to be involved in driving accidents at night. Certain levels of blurred vision can also influence the athletic and reading performances.[144 145]
1.3.1 Defocus and wavefront aberrations
In section 1.1.1.2 the conventional refractive errors (defocus and astigmatism) were already classified as being part of the low-order ocular aberrations. These 2nd order aberrations are considered the most prevalent aberration of the human eye, being predominant over the high-order aberrations, and they are the only ocular aberrations that can be neutralized by ophthalmic correction. However, even when the eye is free of refractive error the produced retinal image it is not perfect because of the small contribution of HOA [2], especially at mesopic and scotopic conditions, as seen previously. Usually, a total HOA RMS of 0.25µm for a 5mm pupil is approximately equivalent to a defocus of 0.25D in young healthy eyes.[2] Both defocus induced by uncorrected refractive errors and HOA decrease the visual acuity and the contrast sensitivity.[7 111]
Cheng et al. (2003)[47] found no correlation between HOA and myopic and hyperopic refractive errors. Additionally they did not found differences between the magnitude of spherical-like HOA from the ametropic eyes and from the emmetropic ones. The same was verified by Rossi and his coworker (2007)[37] between emmetropes and low myopes, and by Kingston et al. (2013)[46] in individual with similar ages from different continents. Many other authors [7 40 46 59 60 146 147] refer the existence of an interaction between LOA and HOA, mainly between the ametropia or
subjective refraction and they concluded that HOA influence the amount of spherical and cylindrical refraction required for correction once the mean absolute error in spherical equivalent increased with the increase on HOA.
Several studies evaluated HOA as function of myopic refractive error, showing a tendency for a worsened visual quality in higher myopia degrees.[3 7 148 149] Marcos et al. (2000) [149] observed an increasing in corneal and internal HOA but a non significant change in total HOA with myopia. The positive increase in corneal spherical-like HOA is associated to a positive increase in corneal asphericity with myopia but this is usually compensated by the internal spherical-like HOA which increase in the opposite direction. However, they thought that the main responsible for the degradation in visual quality in myopia would be an increase in coma-like and other HOA. A study from Llorente et al. (2004) [146] compared the ocular aberrations between two groups of hyperopic and myopic eyes matched in age and absolute refractive error and they found higher positive amounts of total spherical-like HOA in the hyperopic group. Besides Thibos et al. (2002) [147] found a moderate positive correlation between defocus and spherical aberration in subjects between 22 and 35 years old with corrected refractive errors and paralyzed accommodation. So, in general terms, these studies demonstrate that the interaction and contribution of the spherical-like HOA with the defocus (spherical refraction) should be taking into account.
In addition to these findings, the influence of pupil size should not be forgotten, especially at low luminance conditions. Even for a fixed pupil size the blurred retinal image can be expanded by the increasing defocus caused by ametropia. The same happen when ametropia does not change but the pupil size increase, which magnifies HOA expression, mainly spherical-like aberration. In this context, some authors [35 37 40 60] believe that the adaptive optics correction of HOA can improve the visual quality due to a shift in subjective best focus of the image.
1.3.2 Impact of defocus in Visual Acuity and contrast sensitivity
The relationship between defocus and the loss of visual acuity it is studied since very early. Both spherical and astigmatic refractive errors affect the visual acuity. A defocus of 0.25D (negative or positive) may not have a great impact on visual acuity but for larger values of spherical or cylindrical defocus, VA tends to drop quickly. [2]
Many studies report losses of visual acuity due to the presence of defocus. [76 104 145 150-154] In order to study the additive influence of luminance, contrast and blur on visual acuity, Johnson and his coworkers (1995) [76] found a reduction at about 0.40 LogMAR units in VA with a induced blur of +1.00D on the best distance correction for a 97% contrast letters in subjects between 26-43 years old. Besides, they found that the VA decline was more abrupt for levels of blur up to +2.00D, being more gradually decreased for dioptric blur greater than +2.00D. They also found a significant reduction in contrast with the increasing positive defocus and reported that “low contrast targets appear to be more greatly affected by small amounts of blur than are high contrast targets”. Wood et al. (2008) [104] reported a 0.28±0.05 LogMAR VA decrease and a significant reduction in contrast sensitivity induced by a certain non-described quantity of positive induced blur.
Figure 1.7 shows LogMAR visual acuity as function of induced defocus two pupil diameter obtained by Villegas et al. (2002) [150] with the accommodation paralyzed. Both curves show that the VA decreased with both negative and positive defocus but the VA loss is higher with the positive defocus (at about a 6/9 loss). The same is seen on defocus curves obtained by Sheppard and his coworkers (2013) [124]. However, it is important to have in account that besides defocus and the magnitude of HOA, the level of luminance and the pupil size can also influence VA and contrast sensitivity values. When in low luminance levels and/or low contrast, the VA tends to worse in a major magnitude than in optimal luminance and contrast levels. [2 76 104 155]
Figure 1.7 Visual acuity as function of defocus for 3mm (black circles) and 5mm (white circles) pupil diameter with cycloplegia. Image reproduced from Villegas et al. (2002). [150]
Other aspect to have in account is the blur adaptation. Some studies [153 155] reported that the visual performance after a period of blur adaptation can be improved by changes in visual acuity and contrast sensitivity. These studies observed an improvement in VA and contrast sensitivity after a period of blur exposure and showed that myopes are more tolerant to retinal defocus compared to emmetropes. This tolerance can be explained by their daily experience with blurred images.
1.3.3 Impact of Defocus on light distortion
There are not many reports of what are the normal values of light distortion in a healthy subject. Puell et al. (2013)[156] developed a study in order to determine the normal halo size in 147 healthy subjects in a large ages range (20 to 77 years) and to evaluate the repeatability of the Vision Monitor (MonCv3; Metrovision, Pérenchies, France). They found the normal halo size to be 36.5±28.8mm, considering a wide range of age.
As the ocular aberration and intraocular scattering, the uncorrected refractive errors can distort the retinal image which produces a decrease on visual acuity and contrast sensitivity and, at mesopic and scotopic conditions, can origin night visual disturbances produced by the distorted light reaching the retina. So, at night, the combination of HOA, intraocular scattering and defocus produced by uncorrected refractive errors decrease the visual quality and performance due to light distortion, producing the perception of photic phenomena in the presence of a bright light source. It is known how HOA increase the perceived size and shape of a light source by itself, especially the spherical-like aberration, and that defocus from uncorrected refractive error also produce higher values of light distortion. However, there are not many studies evaluating the differences between positive and negative defocus on light distortion.
Gutierrez and his co-workers (2003) [96] developed a system (Starlights halometer (Novosalud, Valencia Spain)) to quantify the presence of halos in subjects and their results did not show differences between emmetropic and ametropic with positive and negative refractive status in light distortion. Besides, Villa et al. (2007) [94] evaluated the disturbance index with the same referred device and they found an increase on this index correlated with corneal HOA only. However, Villegas et al. (2002) [150] studied the existence of a correlation between optical and
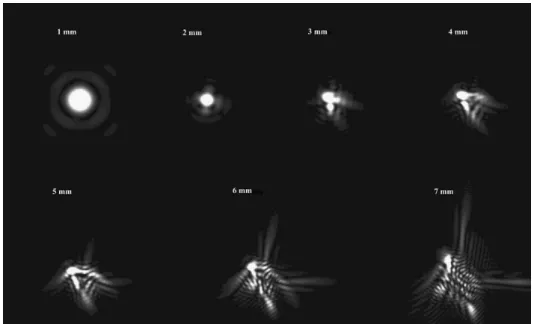
psychophysical parameters as a function of defocus and found that the double-pass retinal image increased with both positive and negative induced defocus (Figure 1.8). But, as seen in Figure 1.8 there are quite small differences between the disturbances on double-pass retinal image obtained by positive and negative defocus, although the Strehl ratio between both types of defocus was not significantly different.
Figure 1.8 Double-pass images (PSF) for different types and levels of defocus obtained with a 3mm pupil. Image reproduced from Villegas et al. (2002). [150]
Artal et al. (2011) [70] used the OQAS system to assess the given objective scatter index (OSI) and they referred that this parameter can be affected by uncorrected refractive errors besides HOA. They showed that the OSI values significantly increase for values over +1.00D of defocus. A pilot study conducted in Portugal by Amorim-de-Sousa et al. (2014) [157] evaluated the variation on monocular light distortion with the increasing positive spherical and astigmatic
size (LDI) and they found an increase with the increasing induced spherical and astigmatic defocus, being more significant over +1.00D for the spherical defocus, included (Figure 1.9).
Figure 1.9 Changes in LDI, a size parameter of light distortion from LDA, with positive induced defocus without cycloplegia. Image reproduced from Amorim-de-Sousa et al. (2015). [157]
2. HYPOTHESIS AND OBJECTIVES OF THE STUDY
2.1 Problem formulation
It is already known how uncorrected refractive errors can reduce the VA and the contrast sensitivity and that at low luminance levels the ocular aberrations are the main responsible for a decreased visual performance. However, there are no reports of how uncorrected refractive errors influence the perception of light distortion under low environmental lightning conditions. In this study it will be induced two different types of spherical defocus under cycloplegic conditions in order to investigate if there are differences on the perceived light distortion between a positive and negative defocus.
2.2 Hypothesis
The hypothesis of this thesis is that the defocus alters the light distortion perception and that the positive defocus increases the light distortion more than the negative defocus does due to the action of accommodation in normal healthy young eyes.
2.3 Objectives
The main goals of this thesis are:
1. Investigate the impact of positive and negative defocus on the perceived light distortion. 2. To understand how HOAs can affect the light distortion.
3. To analyze how topographic parameters such as SAI, SRI and Q can influence the light distortion.
3. MATERIAL AND METHODS
3.1 Study design
This was a cross-sectional study which intended to determine the impact of spherical defocus and high-order aberrations in light distortion measures around a LED (light emitting diode) light source.
The research was conducted in the Clinical and Experimental Optometry Research Lab (CEORLab) at the University of Minho (Braga, Portugal). All the instruments used in this study were available in the CEORLab. The protocol of the study was reviewed and approved by the Subcomité de Ética para as Ciências da Vida e da Saúde / Ethics Subcommittee for Health and Life Sciences (SECVS) of the University of Minho. Following the guidelines of the Declaration of Helsinki, all subjects signed a Consent Form (Attachment 1 on Appendix) once the objectives and procedures of the study were fully explained to them.
3.2 Participants and Sample Size
Sample size was calculated by GPower 3.1 software. To ensure an 80% power for a dependent comparison of means of light distortion between different levels of defocus, a sample size of 28 subjects was needed for a 0.05 level of significance.
In order to recruit participants for this study, it was sent an email to all academic community of the University of Minho. The inclusion criteria for this thesis project were subjects between 18 and 40 years of age, a spherical refractive error between +2.00 and -3.00D, with astigmatism below 1.50D and less than 1.00D of anysometropia. It was required transparent ocular media, no ocular pathology or surgery, and taking no ocular or systemic medications with ocular affectation. Subjects should present a best corrected VA of 0.00 LogMAR units or better in each eye, and the difference in VA between both eyes must be less than 0.1 LogMAR units.
Thirty-one (31) subjects answered the email and came to an initial consultation, however one (1) of them was unable to complete the experimental session. Thirty (30) subjects completed the study protocol. All subjects that volunteered to participate underwent a full optometric examination to assess suitability to enter the study and the required measurements were done at