38SPECTROSCOPY 16(4) APRIL 2001 w w w . s p e c t r o s c o p y o n l i n e . c o m
A
mazingly, 18 years after thecom-mercialization of inductively cou-pled plasma mass spectrometry (ICP-MS), less than 4000 systems have been installed worldwide. If you compare this number with another rapid multielement technique, inductively coupled plasma optical emission spec-trometry (ICP-OES), first commercial-ized in 1974, the difference is quite signif-icant. In 1992, 18 years after ICP-OES was introduced, more than 9000 units had been sold, and if you compare it with the same time period that ICP-MS has been available, the difference is even more dra-matic. From 1983 to the present day, more than 17,000 ICP-OES systems have been installed — more than four times the number of ICP-MS systems. If the comparison is made with all atomic spec-troscopy instrumentation (MS, ICP-OES, graphite furnace atomic absorption [GFAA] and flame atomic absorption [FAA]), the annual turnover for ICP-MS is less than 7% of the total atomic spec-troscopy market — 400 units compared to approximately 6000 atomic spec-troscopy systems. It’s even more surpris-ing when you consider that ICP-MS of-fers so much more than the other techniques, including two of its most at-tractive features — the rapid multiele-ment capabilities of ICP-OES, combined with the superb detection limits of GFAA.
ICP-MS — ROUTINE OR RESEARCH? Clearly, one of the reasons is price — an ICP-MS system typically costs twice as much as an ICP-OES system and three times more than a GFAA system. But in a competitive world, the “street price” of an ICP-MS system is much closer to a top-of-the-line ICP-OES system fitted with sam-pling accessories or a GFAA system that has all the bells and whistles on it. So if ICP-MS is not significantly more
expen-sive than ICP-OES and GFAA, why hasn’t it been more widely accepted by the ana-lytical community? I firmly believe that the major reason why ICP-MS has not gained the popularity of the other trace element techniques is that it is still con-sidered a complicated research tech-nique, requiring a very skilled person to operate it. Manufacturers of ICP-MS equipment are constantly striving to make the systems easier to operate, the software easier to use, and the hardware easier to maintain, but even after 18 years it is still not perceived as a mature, rou-tine tool like flame AA or ICP-OES. This might be partially true because of the rel-ative complexity of the instrumentation; however, in my opinion, the dominant reason for this misconception is that there has not been good literature avail-able explaining the basic principles and benefits of ICP-MS in a way that is com-pelling and easy to understand for some-one with very little knowledge of the technique. Some excellent textbooks (1, 2) and numerous journal papers (3–5) are available that describe the fundamen-tals, but they tend to be far too heavy for
a novice reader. There is no question in my mind that the technique needs to be presented in a more user-friendly way to make routine analytical laboratories more comfortable with it. Unfortunately, the publishers of the “for Dummies” series of books have not yet found a mass (excuse the pun) market for writing one on ICP-MS. So until that time, we will be present-ing a number of short tutorials on the technique, as a follow-up to the poster that was included in the February 2001 issue of Spectroscopy.
During the next few months, we will be discussing the following topics in greater depth:
• principles of ion formation • sample introduction
• plasma torch/radio frequency genera-tor
• interface region • ion focusing • mass separation • ion detection • sampling accessories • applications.
We hope that by the end of this series, we will have demystified ICP-MS, made it
T U T O R I A L
T U T O R I A L
S P E C T R O S C O P YA Beginner’s Guide to ICP-MS
Part I
RO B E R T TH O M A S
GENERATION OF IONS IN THE PLASMA We’ll start this series off with a brief de-scription of the fundamental principle used in ICP-MS — the use of a high-temperature plasma discharge to gener-ate positively charged ions. The sample,
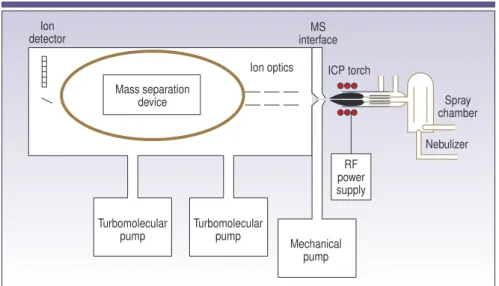
typically in liquid form, is pumped into the sample introduction system, which is made up of a spray chamber and nebu-lizer. It emerges as an aerosol and eventu-ally finds its way — by way of a sample in-jector — into the base of the plasma. As it travels through the different heating zones of the plasma torch it is dried, va-porized, atomized, and ionized. During this time, the sample is transformed from a liquid aerosol to solid particles, then into a gas. When it finally arrives at the analytical zone of the plasma, at approxi-mately 6000–7000 K, it exists as excited atoms and ions, representing the elemen-tal composition of the sample.
The excitation of the outer electron of a ground-state atom, to produce wavelength-specific photons of light, is the fundamental basis of atomic emission. However, there is also enough energy in the plasma to remove an electron from its orbital to generate an ion. It is the genera-tion, transportagenera-tion, and detection of sig-nificant numbers of these positively charged ions that give ICP-MS its charac-teristic ultratrace detection capabilities. It is also important to mention that, although ICP-MS is predominantly used for the detection of positive ions, negative ions (such as halogens) are also pro-duced in the plasma. However, because the extraction and transportation of nega-tive ions is different from that of posinega-tive ions, most commercial instruments are not designed to measure them. The process of the generation of positively charged ions in the plasma is shown con-ceptually in greater detail in Figure 1.
40SPECTROSCOPY 16(4) APRIL 2001 w w w . s p e c t r o s c o p y o n l i n e . c o m a little more compelling to purchase, and
ultimately opened up its potential as a routine tool to the vast majority of the trace element community that has not yet realized the full benefits of its capabilities.
S P E C T R O S C O P Y T U T O R I A L
.
.
.
.
.
.
.
.
.
.
.
.
.
.
.
.
.
.
.
.
.
.
.
.
.
.
.
.
.
.
.
.
.
.
.
.
.
.
.
.
.
.
.
.
.
.
.
.
.
.
.
.
.
.
.
.
.
.
.
.
.
Circle 28
Figure 3.Conversion of a chromium ground-state atom (Cr0) to an ion (Cr1).
Figure 5.Relative abundance of the naturally occurring isotopes of all the elements (6). Reproduced with the permission of PerkinElmer Instruments (Norwalk, CT).
S P E C T R O S C O P Y T U T O R I A L
.
.
.
.
.
.
.
.
.
.
.
.
.
.
.
.
.
.
.
.
.
.
.
.
.
.
.
.
.
.
.
.
.
.
.
.
.
.
.
.
.
.
.
.
.
.
.
.
.
.
.
.
.
.
.
.
.
.
.
.
.
Table I.Breakdown of the atomic structure of copper isotopes.
63Cu 65Cu
Number of protons (p1) 29 29
Number of electrons (e2) 29 29
Number of neutrons (n) 34 36
Atomic mass (p1 1 n) 63 65
Atomic number (p1) 29 29
Natural abundance 69.17% 30.83%
Nominal atomic weight 63.55*
* Calculated using the formulae 0.6917n10.3083n1p1 (referenced to the atomic weight of carbon)
Figure 4.Mass spectra of the two copper isotopes — 63Cu1and 65Cu1.
42SPECTROSCOPY 16(4) APRIL 2001 w w w . s p e c t r o s c o p y o n l i n e . c o m ION FORMATION
Figures 2 and 3 show the actual process of conversion of a neutral ground-state atom to a positively charged ion. Figure 2 shows a very simplistic view of the chromium atom Cr0, consisting of a nu-cleus with 24 protons (p1) and 28 neu-trons (n), surrounded by 24 orbiting elec-trons (e2) (It must be emphasized that this is not meant to be an accurate repre-sentation of the electrons’ shells and sub-shells, but simply a conceptual explana-tion for the purpose of clarity). From this we can say that the atomic number of chromium is 24 (number of protons), and its atomic mass is 52 (number of protons 1neutrons).
If energy is then applied to the chromium ground-state atom in the form of heat from a plasma discharge, one of the orbiting electrons will be stripped off the outer shell. This will result in only 23 electrons left orbiting the nucleus. Be-cause the atom has lost a negative charge (e2) but still has 24 protons (p1) in the nucleus, it is converted into an ion with a net positive charge. It still has an atomic mass of 52 and an atomic number of 24, but is now a positively charged ion and not a neutral ground-state atom. This process is shown in Figure 3.
NATURAL ISOTOPES
This is a very basic look at the process, because most elements occur in more than one form (isotope). In fact, chromium has four naturally occurring isotopes, which means that the chromium atom exists in four different forms, all with the same atomic number of 24 (number of protons), but with differ-ent atomic masses (numbers of neu-trons).
To make this a little easier to under-stand, let’s take a closer look at an ele-ment like copper, which has only two dif-ferent isotopes — one with an atomic mass of 63 (63Cu) and the other with an atomic mass of 65 (65Cu). They both have the same number of protons and elec-trons, but differ in the number of neu-trons in the nucleus. The natural abun-dances of 63Cu and 65Cu are 69.1% and 30.9%, respectively, which gives copper a nominal atomic mass of 63.55 — the value you see for copper in atomic weight reference tables. Details of the atomic structure of the two copper isotopes are shown in Table I.
When a sample containing naturally oc-curring copper is introduced into the
plasma, two different ions of copper, 63Cu1and 65Cu1, are produced, which
generate different mass spectra — one at mass 63 and another at mass 65. This can be seen in Figure 4, which is an actual ICP-MS spectral scan of a sample contain-ing copper. It shows a peak for the 63Cu1 ion on the left, which is 69.17% abundant, and a peak for 65Cu1at 30.83% abun-dance, on the right. You can also see small peaks for two Zn isotopes at mass 64 (64Zn) and mass 66 (66Zn) (Zn has a to-tal of five isotopes at masses 64, 66, 67, 68, and 70). In fact, most elements have at least two or three isotopes and many elements, including zinc and lead, have four or more isotopes. Figure 5 is a chart that shows the relative abundance of the naturally occurring isotopes of all the elements.
During the next few months, we will systematically take you on a journey through the hardware of an ICP mass spectrometer, explaining how each major component works, and finishing the se-ries with an overview of how the tech-nique is being used to solve real-world ap-plication problems. Our goal is to present both the basic principles and benefits of the technique in a way that is clear, con-cise, and very easy to understand. We hope that by the end of the series, you and your managers will be in a better po-sition to realize the enormous benefits that ICP-MS can bring to your laboratory.
REFERENCES
(1) A. Montasser, Inductively Coupled Plasma Mass Spectrometry(Wiley-VCH, Berlin, 1998).
(2) F. Adams, R. Gijbels, and R. Van Grieken, Inorganic Mass Spectrometry(John Wiley and Sons, New York, 1988.).
(3) R.S. Houk, V. A. Fassel, and H.J. Svec, Dy-namic Mass Spectrom.6, 234 (1981). (4) A.R. Date and A.L. Gray, Analyst106,
1255 (1981).
(5) D.J. Douglas and J.B. French, Anal. Chem.53, 37 (1982).
(6)Isotopic Composition of the Elements: Pure Applied Chemistry63(7), 991–1002 (1991).
Robert Thomasis the principal of his own freelance writing and scientific consulting company, Scientific Solutions, based in Gaithersburg, MD. He can be contacted by email at [email protected] or via his web site at www.scientificsolutions1. com.◆
S P E C T R O S C O P Y T U T O R I A L
.
.
.
.
.
.
.
.
.
.
.
.
.
.
.
.
.
.
.
.
.
.
.
.
.
.
.
.
.
.
.
56SPECTROSCOPY 16(5) MAY 2001 w w w . s p e c t r o s c o p y o n l i n e . c o m
Part II of Robert Thomas’ series on induc-tively coupled plasma mass spectrometry looks at one of the most critical areas of the instrument — the sample introduction sys-tem. He discusses the fundamental princi-ples of converting a liquid into a fine-droplet aerosol suitable for ionization in the plasma, and provides an overview of the different types of commercially avail-able nebulizers and spray chambers.
T
he majority of inductively coupled plasma mass spectrometry (ICP-MS) applications involve the analysis of liquid samples. Even though spec-troscopists adapted the technique over the years to handle solids, it was de-veloped in the early 1980s primarily to an-alyze solutions. There are many ways of introducing a liquid into an ICP mass spectrometer, but they all basically achieve the same result — they generate a fine aerosol of the sample so it can be efficiently ionized in the plasma dis-charge. The sample-introduction area has been called the Achilles heel of ICP-MS because it is considered the weakest component of the instrument, with only 1–2% of the sample finding its way into the plasma (1). Although there has re-cently been much improvement in this area, the fundamental design of an ICP-MS sample introduction system has not dramatically changed since the technique was first introduced in 1983.Before discussing the mechanics of aerosol generation in greater detail, let us look at the basic components of a sample introduction system. Figure 1 shows the proximity of the sample introduction area relative to the rest of the ICP mass spec-trometer, while Figure 2 represents the individual components.
The mechanism of introducing a liquid sample into analytical plasma can be con-sidered as two separate events — aerosol
generation using a nebulizer and droplet selection by way of a spray chamber. Sharp carried out a thorough investiga-tion of both processes (2).
AEROSOL GENERATION
As mentioned previously, the main func-tion of the sample introducfunc-tion system is to generate a fine aerosol of the sample. It achieves this purpose with a nebulizer and a spray chamber. The sample is nor-mally pumped at ~1 mL/min via a staltic pump into the nebulizer. A peri-staltic pump is a small pump with lots of minirollers that rotate at the same speed. The constant motion and pressure of the rollers on the pump tubing feed the sam-ple to the nebulizer. The benefit of a peri-staltic pump is that it ensures a constant flow of liquid, irrespective of differences in viscosity between samples, standards, and blanks. After the sample enters the nebulizer, the liquid is broken up into a fine aerosol by the pneumatic action of
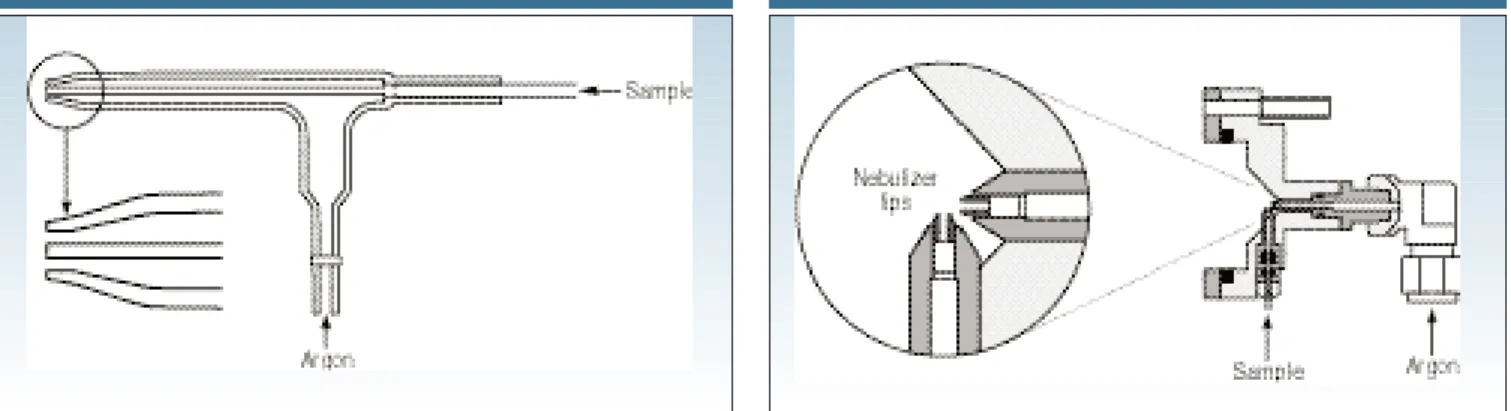
gas flow (~1 L/min) smashing the liquid into tiny droplets, which is very similar to the spray mechanism of a can of deodor-ant. Although pumping the sample is the most common approach to introducing it, some pneumatic nebulizers, such as the concentric design, don’t need a pump be-cause they rely on the natural venturi ef-fect of the positive pressure of the nebu-lizer gas to suck the sample through the tubing. Solution nebulization is conceptu-ally represented in Figure 3, which shows aerosol generation using a nebulizer with a crossflow design.
DROPLET SELECTION
Because the plasma discharge is ineffi-cient at dissociating large droplets, the spray chamber’s function is primarily to allow only the small droplets to enter the plasma. Its secondary purpose is to smooth out pulses that occur during the nebulization process, due mainly to the peristaltic pump. Several ways exist to
en-T U en-T O R I A L
T U T O R I A L
S P E C T R O S C O P YA Beginner’s Guide to ICP-MS
Part II: The Sample-Introduction System
RO B E R T TH O M A S
MAY 2001 16(5) SPECTROSCOPY 57 (4). Therefore, general-purpose ICP-OES
nebulizers that are designed to aspirate 1–2% dissolved solids, or high-solids neb-ulizers such as the Babbington, V-groove, or cone-spray nebulizers, which are de-signed to handle as much as 20% dis-solved solids, are not ideal for use with ICP-MS. The most common of the pneu-matic nebulizers used in commercial ICP mass spectrometers are the concentric and crossflow designs. The concentric de-sign is more suitable for clean samples, while the crossflow is generally more tol-erant to samples containing higher levels of solids or particulate matter.
Concentric design.In the concentric neb-ulizer, the solution is introduced through a capillary tube to a low-pressure region created by a gas flowing rapidly past the end of the capillary. The low pressure and high-speed gas combine to break up the solution into an aerosol, which forms at the open end of the nebulizer tip. Figure 5 illustrates the concentric design.
Concentric pneumatic nebulizers can provide excellent sensitivity and stability, particularly with clean solutions. How-ever, the small orifices can be plagued by blockage problems, especially if large numbers of heavy matrix samples are aspirated.
Crossflow design.For samples that con-tain a heavier matrix or small amounts of undissolved matter, the crossflow design is probably the best option. With this de-sign the argon gas is directed at right an-gles to the tip of a capillary tube, in con-trast to the concentric design, where the gas flow is parallel to the capillary. The solution is either drawn up through the capillary tube via the pressure created by the high-speed gas flow or, as is most
common with crossflow nebulizers, forced through the tube with a peristaltic pump. In either case, contact between the high-speed gas and the liquid stream causes the liquid to break up into an aerosol. Crossflow nebulizers are gener-ally not as efficient as concentric nebuliz-ers at creating the very small droplets needed for ICP-MS analyses. However, the larger diameter liquid capillary and longer distance between liquid and gas injectors reduce clogging problems. Many analysts feel that the small penalty paid in analytical sensitivity and precision when compared with concentric nebuliz-ers is compensated by the fact that the crossflow design is far more rugged for routine use. Figure 6 shows a cross sec-tion of a crossflow nebulizer.
Microflow design.A new breed of nebu-lizers is being developed for ICP-MS called microflow nebulizers, which are designed to operate at much lower sam-ple flows. While conventional nebulizers have a sample uptake rate of about 1 mL/min, microflow nebulizers typically run at less than 0.1 mL/min. They are based on the concentric principle, but sure only the small droplets get through,
but the most common way is to use a double-pass spray chamber where the aerosol emerges from the nebulizer and is directed into a central tube running the whole length of the chamber. The droplets travel the length of this tube, where the large droplets (greater than ~10 µm in diameter) fall out by gravity and exit through the drain tube at the end of the spray chamber. The fine droplets (~5–10 µm in diameter) then pass be-tween the outer wall and the central tube, where they eventually emerge from the spray chamber and are transported into the sample injector of the plasma torch (3). Although many different designs are available, the spray chamber’s main func-tion is to allow only the smallest droplets into the plasma for dissociation, atomiza-tion, and finally ionization of the sample’s elemental components. Figure 4 presents a simplified schematic of this process.
Let us now look at the different nebu-lizer and spray chamber designs that are most commonly used in ICP-MS. This ar-ticle cannot cover every type available be-cause a huge market has developed over the past few years for application-specific customized sample introduction compo-nents. This market created an industry of small OEM (original equipment manufac-turers) companies that manufacture parts for instrument companies as well as sell-ing directly to ICP-MS users.
NEBULIZERS
By far the most common design used for ICP-MS is the pneumatic nebulizer, which uses mechanical forces of a gas flow (normally argon at a pressure of 20–30 psi) to generate the sample aerosol. The most popular designs of pneumatic nebulizers include concentric, microconcentric, microflow, and cross-flow. They are usually made from glass, but other nebulizer materials, such as various kinds of polymers, are becoming more popular, particularly for highly cor-rosive samples and specialized applica-tions. I want to emphasize at this point that nebulizers designed for use with ICP-optical emission spectroscopy (OES) are not recommended for ICP-MS. This fact results from a limitation in total dissolved solids (TDS) that can be put into the ICP-MS interface area. Because the orifice sizes of the sampler and skimmer cones used in ICP-MS are so small (~0.6–1.2 mm), the concentration of matrix compo-nents must generally be kept below 0.2%
S P E C T R O S C O P Y T U T O R I A L
.
.
.
.
.
.
.
.
.
.
.
.
.
.
.
.
.
.
.
.
.
.
.
.
.
.
.
.
.
.
.
.
.
.
.
.
.
.
.
.
.
.
.
.
.
.
.
.
.
.
.
.
.
.
.
.
.
.
.
.
.
Figure 2.Diagram of the ICP-MS sample introduction area.
Figure 3.Conceptual representation of aerosol generation with an ICP-MS nebulizer.
w w w . s p e c t r o s c o p y o n l i n e . c o m they usually operate at higher gas
pres-sure to accommodate the lower sample flow rates. The extremely low uptake rate makes them ideal for applications with limited sample volume or where the sam-ple or analyte is prone to samsam-ple intro-duction memory effects. These nebuliz-ers and their components are typically
constructed from polymer materials such as polytetrafluoroethylene (PTFE), per-fluoroalkoxy (PFA), or polyvinylidene flu-oride (PVDF). In fact, their excellent cor-rosion resistance means that they have naturally low blank levels. This character-istic, together with their ability to handle small sample volumes such as vapor-phase decomposition (VPD) applications, makes them an ideal choice for semicon-ductor labs that are carrying out ultra-trace element analysis (5). A typical mi-croflow nebulizer made from PFA is shown in Figure 7.
SPRAY CHAMBERS
Let us now turn our attention to spray chambers. Basically two designs are used in commercial ICP-MS instrumentation — double pass and cyclonic spray cham-bers. The double pass is by far the most
common, with the cyclonic type gaining in popularity. Another type of spray cham-ber based on the impact bead design (first developed for flame AA and then adapted for ICP-OES) was tried on the early ICP-MS systems with limited suc-cess, but is not generally used today. As mentioned earlier, the function of the spray chamber is to reject the larger aerosol droplets and also to smooth out pulses produced by the peristaltic pump. In addition, some ICP-MS spray cham-bers are externally cooled (typically to 2–5 °C) for thermal stability of the sam-ple and to minimize the amount of solvent going into the plasma. This can have a number of beneficial effects, depending on the application, but the main benefits are reduction of oxide species and the ability to aspirate volatile organic solvents.
S P E C T R O S C O P Y T U T O R I A L
.
.
.
.
.
.
.
.
.
.
.
.
.
.
.
.
.
.
.
.
.
.
.
.
.
.
.
.
.
.
.
.
.
.
.
.
.
.
.
.
.
.
.
.
.
.
.
.
.
.
.
.
.
.
.
.
.
.
.
.
.
Figure 5.Diagram of a typical concentric nebulizer. Figure 6.Schematic of a crossflow nebulizer.
Figure 7.A typical concentric microflow nebulizer. Printed with permission from Ele-mental Scientific (Omaha, NE).
Figure 8.Schematic of a Scott double-pass spray chamber (shown with crossflow nebulizer). Printed with permission of PerkinElmer Instruments (Norwalk, CT).
Figure 9.Schematic of a cyclonic spray chamber (shown with concentric nebulizer).
60SPECTROSCOPY 16(5) MAY 2001 w w w . s p e c t r o s c o p y o n l i n e . c o m
Double pass.By far the most common design of double-pass spray chamber is the Scott design, which selects the small droplets by directing the aerosol into a central tube. The larger droplets emerge from the tube and, by gravity, exit the spray chamber via a drain tube. The liq-uid in the drain tube is kept at positive pressure (usually by way of a loop), which forces the small droplets back be-tween the outer wall and the central tube, where they emerge from the spray cham-ber into the sample injector of the plasma torch. Scott double-pass spray chambers come in a variety of shapes, sizes, and materials, but are generally considered the most rugged design for routine use. Figure 8 shows a Scott spray chamber made of a polysulfide-type material, cou-pled to a crossflow nebulizer.
Cyclonic spray chamber.The cyclonic spray chamber operates by centrifugal force. Droplets are discriminated accord-ing to their size by means of a vortex pro-duced by the tangential flow of the sam-ple aerosol and argon gas inside the chamber. Smaller droplets are carried
with the gas stream into the ICP-MS, while the larger droplets impinge on the walls and fall out through the drain. It is generally accepted that a cyclonic spray chamber has a higher sampling effi-ciency, which, for clean samples, trans-lates into higher sensitivity and lower de-tection limits. However, the droplet size distribution appears to be different from a double-pass design, and for certain types of samples, can give slightly inferior pre-cision. An excellent evaluation of the ca-pabilities of a cyclonic spray chamber was made by Beres and co-workers (6). Fig-ure 9 shows a cyclonic spray chamber connected to a concentric nebulizer.
Many other nonstandard sample intro-duction devices are available that are not described in this particular tutorial, such as ultrasonic nebulization, membrane de-solvation, flow injection, direct injection, electrothermal vaporization, and laser ab-lation. However, they are becoming more and more important, particularly as ICP-MS users are demanding higher perfor-mance and more flexibility. For that rea-son, they will be addressed in a separate
Circle 51
tutorial at the end of this series.
REFERENCES
(1) R. A. Browner and A.W. Boorn, Anal. Chem. 56, 786–798A (1984).
(2) B.L. Sharp, Analytical Atomic Spectrome-try3, 613 (1980).
(3) L.C. Bates and J.W. Olesik, Journal of An-alytical Atomic Spectrometry5(3), 239
(1990).
(4) R.S. Houk, Anal. Chem.56, 97A (1986).
(5) E. Debrah, S. A. Beres, T.J. Gluodennis, R.J. Thomas, and E.R. Denoyer, Atomic Spectroscopy, 197–202 (September 1995). (6) S. A. Beres, P. H. Bruckner, and E.R.
De-noyer, Atomic Spectroscopy, 96–99 (March/April 1994).
Robert Thomasis the principal of his own freelance writing and scientific marketing consulting company, Scientific Solutions, based in Gaithersburg, MD. He specializes in trace element analysis and can be con-tacted by e-mail at thomasrj@bellatlantic. net or via his web site at www.
scientificsolutions1.com. ◆
TRAINING COURSES
Thermo Nicolet (Madison, WI) is offering a free Spring 2001 Spectroscopic Solutions Seminar Series. The seminars will cover basic FT-IR spectroscopy, microspec-troscopy, dispersive Raman microscopy, Raman spectroscopy, and specialized sampling techniques. This year’s sched-ule includes the following seminars:
May 22 at the Syracuse Sheraton, Syracuse, NY; May 24 at the Wynd-ham Westborough Hotel, Westbor-ough, MA; May 24 at the Marriott Oak Brook, Oak Brook, IL; June 5 at the East Lansing Marriott, East Lans-ing, MI; June 5 at the Embassy Suites, Overland Park, KS; June 7 at the Sher-aton Indianapolis, Indianapolis, IN; June 12 at the Delta Meadowvale Conference Center, Mississauga, Ontario, Canada; June 12 at the Em-bassy Suites, Brookfield, WI; July 10 at the Coast Terrace Inn, Edmonton, Alberta, Canada; and July 26 at the Ala Moana Hotel, Honolulu, HI.
For more information, contact Thermo Nicolet, (800) 201-8132 fax: (608) 273-5046, e-mail: nicinfo@thermonicolet. com, web site: www.thermonicolet. com. ◆
“News Spectrum” continued from page 13
26SPECTROSCOPY 16(6) JUNE 2001 w w w . s p e c t r o s c o p y o n l i n e . c o m Part III of Robert Thomas’ series on
induc-tively coupled plasma–mass spectroscopy ( ICP-MS) looks at the area where the ions are generated — the plasma discharge. He gives a brief historical perspective of some of the common analytical plasmas used over the years and discusses the compo-nents that are used to create the ICP. He finishes by explaining the fundamental principles of formation of a plasma dis-charge and how it is used to convert the sample aerosol into a stream of positively charged ions.
I
nductively coupled plasmas are by far the most common type of plasma sources used in today’s commercial ICP–optical emission spectrometry (OES) and ICP-MS instrumentation. However, it wasn’t always that way. In the early days, when researchers were at-tempting to find the ideal plasma source to use for spectrometric studies, it was unclear which approach would prove to be the most successful. In addition to ICPs, some of the other novel plasma sources developed were direct current plasmas (DCP) and microwave-induced plasmas (MIP). A DCP is formed when a gas (usually argon) is introduced into a high current flowing between two or three electrodes. Ionization of the gas produces an inverted Y-shaped plasma. Unfortunately, early DCP instrumenta-tion was prone to interference effects and also had some usability and reliability problems. For these reasons, the tech-nique never became widely accepted by the analytical community (1). However, its one major benefit was that it could as-pirate high levels of dissolved or sus-pended solids, because there was no re-strictive sample injector for the solid material to block. This feature alone made it attractive for some laboratories, and once the initial limitations of DCPswere better understood, the technique became more accepted. In fact, for those who want a DCP excitation source cou-pled with an optical emission instrument today, an Echelle-based grating using a solid-state detector is commercially available (2).
Limitations in the DCP approach led to the development of electrodeless plasma, of which the MIP was the simplest form. In this system, microwave energy (typi-cally 100–200 W) is supplied to the plasma gas from an excitation cavity around a glass or quartz tube. The plasma dis-charge in the form of a ring is generated inside the tube. Unfortunately, even though the discharge achieves a very high power density, the high excitation temperatures exist only along a central fil-ament. The bulk of the MIP never gets hotter than 2000–3000 K, which means it is prone to very severe matrix effects. In addition, they are easily extinguished
dur-ing aspiration of liquid samples. For these reasons, they have had limited success as an emission source, because they are not considered robust enough for the analysis of real-world, solution-based samples. However, they have gained acceptance as an ion source for mass spectrometry (3) and also as emission-based detectors for gas chromatography.
Because of the limitations of the DCP and MIP approaches, ICPs became the dominant focus of research for both opti-cal emission and mass spectrometric studies. As early as 1964, Greenfield and co-workers reported that an atmospheric-pressure ICP coupled with OES could be used for elemental analysis (4). Although crude by today’s standards, the system showed the enormous possibilities of the ICP as an excitation source and most defi-nitely opened the door in the early 1980s to the even more exciting potential of us-ing the ICP to generate ions (5).
T U T O R I A L
T U T O R I A L
S P E C T R O S C O P Y
A Beginner’s Guide to ICP-MS
Part III: The Plasma Source
RO B E R T TH O M A S
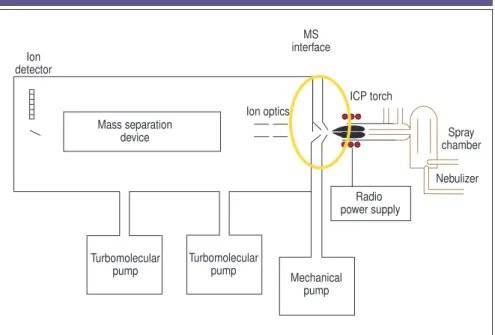
Ion detector
MS interface
ICP torch Ion optics
Spray chamber
Nebulizer Mass separation
device
Turbomolecular pump
Turbomolecular pump
Mechanical pump
Radio frequency power supply
28SPECTROSCOPY 16(6) JUNE 2001 w w w . s p e c t r o s c o p y o n l i n e . c o m
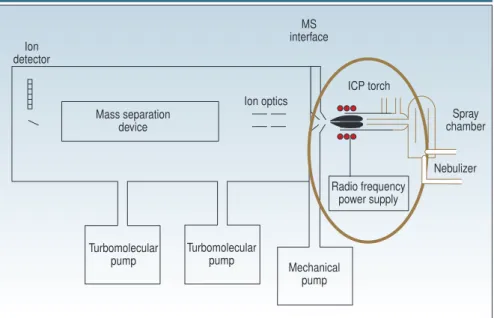
nents that are used to generate the source: a plasma torch, a radio frequency (RF) coil, and RF power supply. Figure 1 shows their proximity to the rest of the instrument; Figure 2 is a more detailed view of the plasma torch and RF coil rela-tive to the MS interface.
The plasma torch consists of three con-centric tubes, which are usually made from quartz. In Figure 2, these are shown as the outer tube, middle tube, and sam-ple injector. The torch can either be one-piece with all three tubes connected, or it can be a demountable design in which the tubes and the sample injector are sep-arate. The gas (usually argon) used to form the plasma (plasma gas) is passed between the outer and middle tubes at a flow rate of ;12–17 L/min. A second gas flow, the auxiliary gas, passes between the middle tube and the sample injector at ;1 L/min and is used to change the position of the base of the plasma relative to the tube and the injector. A third gas flow, the nebulizer gas, also flowing at
;1 L/min carries the sample, in the form of a fine-droplet aerosol, from the sample introduction system (for details, see Part II of this series: Spectroscopy16[5], 56–60 [2001]) and physically punches a channel through the center of the plasma. The sample injector is often made from materials other than quartz, such as alu-mina, platinum, and sapphire, if highly corrosive materials need to be analyzed. It is worth mentioning that although ar-gon is the most suitable gas to use for all three flows, there are analytical benefits in using other gas mixtures, especially in the nebulizer flow (6). The plasma torch
THE PLASMA TORCH
Before we take a look at the fundamental principles behind the creation of an in-ductively coupled plasma used in ICP-MS, let us take a look at the basic
compo-S P E C T R O compo-S C O P Y T U T O R I A L
.
.
.
.
.
.
.
.
.
.
.
.
.
.
.
.
.
.
.
.
.
.
.
.
.
.
.
.
.
.
.
.
.
.
.
.
.
.
.
.
.
.
.
.
.
.
.
.
.
.
.
.
.
.
.
.
.
.
.
.
.
Plasma
Nebulizer gas Interface Outer
tube
RF coil
Sample injector RF power Middle tube
Plasma gas Auxiliarygas
Figure 2.Detailed view of a plasma torch and RF coil relative to the ICP-MS interface.
Quartz torch
Collision-induced
ionization of argon Formation of inductivelycoupled plasma Sample introduced through sample injector Load
coil Tangential flowof argon gas
Electromagnetic
field High voltage
spark
(a) (b) (c)
(d) (e)
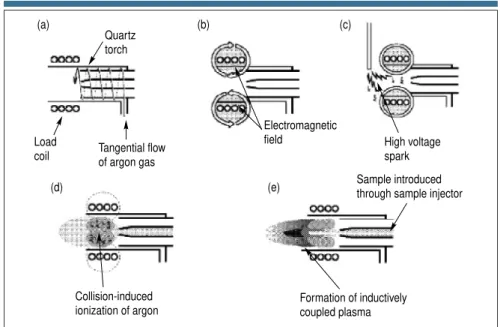
Figure 3.(right) Schematic of an ICP torch and load coil showing how the inductively coupled plasma is formed. (a) A tangential flow of argon gas is passed between the outer and middle tube of the quartz torch. (b) RF power is applied to the load coil, producing an intense electromagnetic field. (c) A high-voltage spark produces free elec-trons. (d) Free electrons are accelerated by the RF field, causing collisions and ioniza-tion of the argon gas. (e) The ICP is formed at the open end of the quartz torch. The sample is introduced into the plasma via the sample injector.
JUNE 2001 16(6) SPECTROSCOPY 29 Initial radiation zone Normal analytical zone 10,000 K Preheating zone 6500 K 6000 K
7500 K 8000 K
Figure 4.Different temperature zones in the plasma.
Droplet (Desolvation) Solid (Vaporization) Gas (Atomization) Atom (Ionization) Ion
From sample injector To mass spectrometer
M(H2O)1X2 (MX)n MX M M1
Figure 5.Mechanism of conversion of a droplet to a positive ion in the ICP.
is mounted horizontally and positioned centrally in the RF coil, approximately 10–20 mm from the interface. It must be emphasized that the coil used in an ICP-MS plasma is slightly different from the one used in ICP-OES. In all plasmas, there is a potential difference of a few hundred volts produced by capacitive coupling between the RF coil and the plasma. In an ICP mass spectrometer, this would result in a secondary dis-charge between the plasma and the inter-face cone, which could negatively affect the performance of the instrument. To compensate for this, the coil must be grounded to keep the interface region as close to zero potential as possible. I will discuss the full implications of this in greater detail in Part IV of this series.
FORMATION OF AN ICP DISCHARGE
Let us now discuss the mechanism of for-mation of the plasma discharge. First, a tangential (spiral) flow of argon gas is di-rected between the outer and middle tube of a quartz torch. A load coil, usually cop-per, surrounds the top end of the torch and is connected to a radio frequency generator. When RF power (typically 750–1500 W, depending on the sample) is applied to the load coil, an alternating current oscillates within the coil at a rate corresponding to the frequency of the generator. In most ICP generators this frequency is either 27 or 40 MHz. This RF oscillation of the current in the coil causes an intense electromagnetic field to be created in the area at the top of the torch. With argon gas flowing through the torch, a high-voltage spark is applied to the gas, which causes some electrons to be stripped from their argon atoms. These electrons, which are caught up and accelerated in the magnetic field, then collide with other argon atoms, stripping off still more electrons. This
collision-induced ionization of the argon continues in a chain reaction, breaking down the gas into argon atoms, argon ions, and electrons, forming what is known as an inductively coupled plasma discharge. The ICP discharge is then sustained within the torch and load coil as RF en-ergy is continually transferred to it through the inductive coupling process. The sample aerosol is then introduced into the plasma through a third tube called the sample injector. This whole process is conceptionally shown in Figure 3.
THE FUNCTION OF THE RF GENERATOR
Although the principles of an RF power supply have not changed since the work of Greenfield (4), the components have become significantly smaller. Some of the early generators that used nitrogen or air required 5–10 kW of power to sustain the plasma discharge — and literally took up half the room. Most of today’s generators use solid-state electronic components, which means that vacuum power ampli-fier tubes are no longer required. This makes modern instruments significantly smaller and, because vacuum tubes were notoriously unreliable and unstable, far more suitable for routine operation.
As mentioned previously, two frequen-cies have typically been used for ICP RF generators: 27 and 40 MHz. These fre-quencies have been set aside specifically for RF applications of this kind, so they will not interfere with other communica-tion-based frequencies. The early RF gen-erators used 27 MHz, while the more re-cent designs favor 40 MHz. There appears to be no significant analytical ad-vantage of one type over the other. How-ever, it is worth mentioning that the 40-MHz design typically runs at lower power levels, which produces lower signal inten-sity and reduced background levels.
Be-cause it uses slightly lower power, this might be considered advantageous when it comes to long-term use of the generator.
The more important consideration is the coupling efficiency of the RF genera-tor to the coil. The majority of modern solid-state RF generators are on the order of 70–75% efficient, meaning that 70–75% of the delivered power actually makes it into the plasma. This wasn’t always the case, and some of the older vacuum tube–designed generators were notori-ously inefficient; some of them experi-enced more than a 50% power loss. An-other important criterion to consider is the way the matching network compen-sates for changes in impedance (a mater-ial’s resistance to the flow of an electric current) produced by the sample’s matrix components or differences in solvent volatility. In older crystal-controlled gen-erators, this was usually done with servo-driven capacitors. They worked very well with most sample types, but because they were mechanical devices, they struggled to compensate for very rapid impedance changes produced by some samples. As a result, the plasma was easily extin-guished, particularly during aspiration of volatile organic solvents.
These problems were partially over-come by the use of free-running RF gen-erators, in which the matching network was based on electronic tuning of small changes in frequency brought about by the sample solvent or matrix components. The major benefit of this approach was that compensation for impedance changes was virtually instantaneous be-cause there were no moving parts. This allowed for the successful analysis of many sample types that would probably have extinguished the plasma of a crystal-controlled generator.
30SPECTROSCOPY 16(6) JUNE 2001 w w w . s p e c t r o s c o p y o n l i n e . c o m
IONIZATION OF THE SAMPLE
To better understand what happens to the sample on its journey through the plasma source, it is important to understand the different heating zones within the dis-charge. Figure 4 shows a cross-sectional representation of the discharge along with the approximate temperatures for different regions of the plasma.
zone before it eventually becomes a posi-tively charged ion in the analytical zone. To explain this in a very simplistic way, let’s assume that the element exists as a trace metal salt in solution. The first step that takes place is desolvation of the droplet. With the water molecules stripped away, it then becomes a very small solid particle. As the sample moves further into the plasma, the solid particle changes first into a gaseous form and then into a ground-state atom. The final process of conversion of an atom to an ion is achieved mainly by collisions of en-ergetic argon electrons (and to a lesser extent by argon ions) with the ground-state atom (7). The ion then emerges from the plasma and is directed into the interface of the mass spectrometer (for details on the mechanisms of ion genera-tion, please refer to Part I of this series:
Spectroscopy16[4], 38–42 [2001]). This process of conversion of droplets into ions is represented in Figure 5.
The next installment of this series will focus on probably the most crucial area of an ICP mass spectrometer — the inter-face region — where the ions generated in the atmospheric plasma have to be sampled with consistency and electrical integrity by the mass spectrometer, which is under extremely high vacuum.
REFERENCES
(1) A.L. Gray, Analyst100,289–299 (1975). (2) G.N. Coleman, D.E. Miller, and R.W.
Stark, Am. Lab.30(4), 33R (1998). (3) D.J. Douglas and J.B. French, Anal.
Chem.53,37-41 (1981).
(4) S. Greenfield, I.L. Jones, and C.T. Berry,
Analyst89,713–720 (1964). (5) R.S. Houk, V. A. Fassel, and H.J. Svec,
Dyn. Mass Spectrom.6,234 (1981). (6) J.W. Lam and J.W. McLaren, J. Anal.
Atom. Spectom.5,419–424 (1990). (7) T. Hasegawa and H. Haraguchi, ICPs in
Analytical Atomic Spectrometry,A. Montaser and D.W. Golightly, Eds., 2d ed. (VCH, New York, 1992).
Robert Thomasis the principal of his own freelance writing and scientific marketing consulting company, Scientific Solutions, based in Gaithersburg, MD. He specializes in trace-element analysis and can be con-tacted by e-mail at thomasrj@bellatlantic. net or via his web site at www.
scientificsolutions1.com. ◆
S P E C T R O S C O P Y T U T O R I A L
.
.
.
.
.
.
.
.
.
.
.
.
.
.
.
.
.
.
.
.
.
.
.
.
.
.
.
.
.
.
.
.
.
.
.
.
.
.
.
.
.
.
.
.
.
.
.
.
.
.
.
.
.
.
.
.
.
.
.
.
.
As mentioned previously, the sample aerosol enters the injector via the spray chamber. When it exits the sample injec-tor, it is moving at such a velocity that it physically punches a hole through the center of the plasma discharge. It then goes through a number of physical changes, starting at the preheating zone and continuing through the radiation
w w w . s p e c t r o s c o p y o n l i n e . c o m
T
he interface region is probably themost critical area of the whole induc-tively coupled plasma mass spec-trometry (ICP-MS) system. It cer-tainly gave the early pioneers of the technique the most problems to over-come. Although we take all the benefits of ICP-MS for granted, the process of tak-ing a liquid sample, generattak-ing an aerosol that is suitable for ionization in the plasma, and then sampling a representa-tive number of analyte ions, transporting them through the interface, focusing them via the ion optics into the mass spectrometer, finally ending up with de-tection and conversion to an electronic signal, are not trivial tasks. Each part of the journey has its own unique problems to overcome but probably the most chal-lenging is the movement of the ions from the plasma to the mass spectrometer. Let’s begin by explaining how the
ion-sampling process works, which will give readers an insight into the many prob-lems faced by the early researchers.
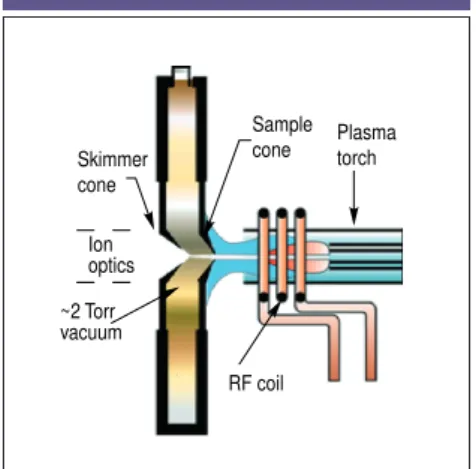
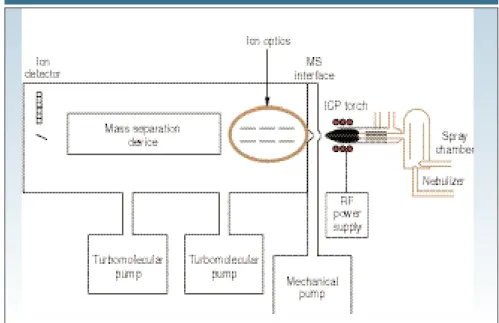
SAMPLING THE IONS
Figure 1 shows the proximity of the inter-face region to the rest of the instrument. The role of the interface is to transport the ions efficiently, consistently, and with electrical integrity from the plasma, which is at atmospheric pressure (760 Torr), to the mass spectrometer analyzer
region, which is at approximately 1026
Torr. One first achieves this by directing the ions into the interface region. The in-terface consists of two metallic cones with very small orifices, which are
main-tained at a vacuum of ;2 Torr with a
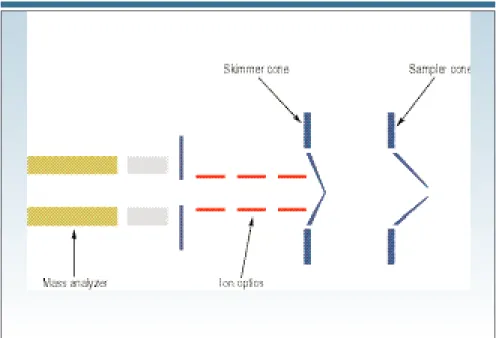
me-chanical roughing pump. After the ions are generated in the plasma, they pass through the first cone, known as the sam-pler cone, which has an orifice diameter
of 0.8–1.2 mm. From there they travel a short distance to the skimmer cone, which is generally sharper than the sam-pler cone and has a much smaller orifice (0.4–0.8 mm i.d.). Both cones are usually made of nickel, but they can be made of materials such as platinum that are far more tolerant to corrosive liquids. To re-duce the effects of the high-temperature plasma on the cones, the interface hous-ing is water-cooled and made from a ma-terial that dissipates heat easily, such as copper or aluminum. The ions then emerge from the skimmer cone, where they are directed through the ion optics, and finally are guided into the mass sepa-ration device. Figure 2 shows the inter-face region in greater detail; Figure 3 shows a close-up of the sampler and skimmer cones.
CAPACITIVE COUPLING
This process sounds fairly straight-forward but proved very problematic dur-ing the early development of ICP-MS be-cause of an undesired electrostatic (capacitive) coupling between the load coil and the plasma discharge, producing a potential difference of 100–200 V. Al-though this potential is a physical charac-teristic of all inductively coupled plasma discharges, it is particularly serious in an ICP mass spectrometer because the ca-pacitive coupling creates an electrical dis-charge between the plasma and the sam-pler cone. This discharge, commonly called the pinch effect or secondary dis-charge, shows itself as arcing in the re-gion where the plasma is in contact with the sampler cone (1). This process is shown very simplistically in Figure 4. If not taken care of, this arcing can cause all kinds of problems, including an increase in doubly charged interfering species, a wide kinetic energy spread of sampled ions, formation of ions
gener-T U gener-T O R I A L
T U T O R I A L
S P E C T R O S C O P Y
A Beginner’s Guide to ICP-MS
Part IV: The Interface Region
RO B E R T TH O M A S
Ion detector
MS interface
ICP torch Ion optics
Spray chamber
Nebulizer Mass separation
device
Turbomolecular pump
Turbomolecular pump
Mechanical pump
Radio power supply
Figure 1.Schematic of an inductively coupled plasma mass spectrometry (ICP-MS) system, showing the proximity of the interface region.
ated from the sampler cone, and a de-creased orifice lifetime. These problems were reported by many of the early re-searchers of the technique (2, 3). In fact, because the arcing increased with sam-pler cone orifice size, the source of the secondary discharge was originally thought to be the result of an electro-gas-dynamic effect, which produced an in-crease in electron density at the orifice (4). After many experiments it was even-tually realized that the secondary dis-charge was a result of electrostatic cou-pling of the load coil to the plasma. The problem was first eliminated by ground-ing the induction coil at the center, which had the effect of reducing the radio fre-quency (RF) potential to a few volts. This effect can be seen in Figure 5, taken from one of the early papers, which shows the reduction in plasma potential as the coil is grounded at different positions (turns) along its length.
Originally, the grounding was imple-mented by attaching a physical ground-ing strap from the center turn of the coil to the interface housing. In today’s instru-mentation the grounding is achieved in a number of different ways, depending on the design of the interface. Some of the most popular designs include balancing the oscillator inside the circuitry of the RF generator (5); positioning a grounded shield or plate between the coil and the plasma torch (6); or using two interlaced coils where the RF fields go in opposing directions (7). They all work differently but achieve a similar result of reducing or eliminating the secondary discharge.
ION KINETIC ENERGY
The impact of a secondary discharge
can-not be overestimated with respect to its ef-fect on the kinetic energy of the ions being sampled. It is well documented that the en-ergy spread of the ions entering the mass spectrometer must be as low as possible to ensure that they can all be focused effi-ciently and with full electrical integrity by the ion optics and the mass separation de-vice. When the ions emerge from the ar-gon plasma, they will all have different ki-netic energies based on their mass-to-change ratio. Their velocities should all be similar because they are controlled by rapid expansion of the bulk plasma, which will be neutral as long as it is maintained at zero potential. As the ion beam passes through the sampler cone into the skim-mer cone, expansion will take place, but its composition and integrity will be main-tained, assuming the plasma is neutral. This can be seen in Figure 6.
Electrodynamic forces do not play a role as the ions enter the sampler or the skimmer because the distance over which the ions exert an influence on each
other (known as the Debye length) is
small (typically 1023–1024mm)
com-pared with the diameter of the orifice (0.5–1.0 mm) (8), as Figure 7 shows.
It is therefore clear that maintaining a neutral plasma is of paramount impor-tance to guarantee electrical integrity of the ion beam as it passes through the in-terface region. If a secondary discharge is present, it changes the electrical char-acteristics of the plasma, which will affect the kinetic energy of the ions differently, depending on their mass. If the plasma is at zero potential, the ion energy spread is in the order of 5–10 eV. However, if a sec-ondary discharge is present, it results in a much wider spread of ion energies
en-tering the mass spectrometer (typically 20–40 eV), which makes ion focusing far more complicated (8).
BENEFITS OF A WELL-DESIGNED INTERFACE
The benefits of a well-designed interface are not readily obvious if simple aqueous samples are analyzed using only one set of operating conditions. However, it be-comes more apparent when many differ-ent sample types are being analyzed, re-quiring different operating parameters. A true test of the design of the interface oc-curs when plasma conditions need to be changed, when the sample matrix changes, or when a dry sample aerosol is being introduced into the ICP-MS. Ana-lytical scenarios like these have the po-tential to induce a secondary discharge, change the kinetic energy of the ions en-tering the mass spectrometer, and affect the tuning of the ion optics. It is therefore S P E C T R O S C O P Y T U T O R I A L
.
.
.
.
.
.
.
.
.
.
.
.
.
.
.
.
.
.
.
.
.
.
.
.
.
.
.
.
.
.
.
.
.
.
.
.
.
.
.
.
.
.
.
.
.
.
.
.
.
.
.
.
.
.
.
.
.
.
.
.
.
Plasma torch Ion optics ~2 Torr vacuum Sample cone Skimmer cone RF coilFigure 2.Detailed view of the interface region. Interface housing Sampler cone Skimmer cone
Figure 3.Close-up view of the sampler and skimmer cones. (Courtesy PerkinElmer Instruments, Norwalk, CT.)
Secondary discharge
Figure 4.Interface area affected by sec-ondary discharge. 100 80 60 40 20 0
0.0 0.5 1.0 1.5 Load coil turns
Plasma potential
2.0 2.5 3.0 n n n n n n n
Figure 5.Reduction in plasma potential as the load coil is grounded at different posi-tions (turns) along its length.
28SPECTROSCOPY 16(7) JULY 2001 w w w . s p e c t r o s c o p y o n l i n e . c o m
critical that the interface grounding mechanism can handle these types of real-world applications, of which typical examples include
• The use of cool-plasma conditions. It is standard practice today to use cool-plasma conditions (500–700 W power and 1.0–1.3 L/min nebulizer gas flow) to lower the plasma temperature and reduce argon-based polyatomic interferences
such as 40Ar16O, 40Ar, and 38ArH, in the
determination of difficult elements like
56Fe, 40Ca, and 39K. Such dramatic
changes from normal operating condi-tions (1000 W, 0.8 L/min) will affect the electrical characteristics of the plasma. • Running volatile organic solvents. Ana-lyzing oil or organic-based samples re-quires a chilled spray chamber (typically
220 °C) or a membrane desolvation
sys-tem to reduce the solvent loading on the plasma. In addition, higher RF power (1300–1500 W) and lower nebulizer gas flow (0.4–0.8 L/min) are required to dis-sociate the organic components in the sample. A reduction in the amount of sol-vent entering the plasma combined with higher power and lower nebulizer gas flow translate into a hotter plasma and a change in its ionization mechanism. • Reducing oxides. The formation of ox-ide species can be problematic in some sample types. For example, in geochemi-cal applications it is quite common to sac-rifice sensitivity by lowering the nebulizer gas flow and increasing the RF power to reduce the formation of rare earth ox-ides, which can interfere spectrally with the determination of other analytes. Un-fortunately these conditions have the po-tential to induce a secondary discharge. • Running a “dry” plasma. Sampling accessories such as membrane desolva-tors, laser ablation systems, and elec-trothermal vaporization devices are being used more routinely to enhance the flexi-bility of ICP-MS. The major difference be-tween these sampling devices and a con-ventional liquid sample introduction system, is that they generate a “dry” sam-ple aerosol, which requires totally differ-ent operating conditions compared with a conventional “wet” plasma. An aerosol containing no solvent can have a dramatic effect on the ionization conditions in the plasma.
Even though most modern ICP-MS in-terfaces have been designed to minimize the effects of the secondary discharge, it S P E C T R O S C O P Y T U T O R I A L
.
.
.
.
.
.
.
.
.
.
.
.
.
.
.
.
.
.
.
.
.
.
.
.
.
.
.
.
.
.
.
.
.
.
.
.
.
.
.
.
.
.
.
.
.
.
.
.
.
.
.
.
.
.
.
.
.
.
.
.
.
Ion optics
Skimmer Sampler
760 Torr 3–4 Torr
Expansion of ion beam
Ion beam Sampleaerosol
Figure 6.The composition of the ion beam is maintained, assuming a neutral plasma.
Interface
cone Debyelength Orificediameter
Figure 7.Electrodynamic forces do not af-fect the composition of the ion beam enter-ing the sampler or the skimmer cone.
Circle 17
30SPECTROSCOPY 16(7) JULY 2001 w w w . s p e c t r o s c o p y o n l i n e . c o m
I
n this month’s column we will explorewhy the user requirements specifica-tion (URS) and the validaspecifica-tion plan are so important for the validation of spec-trometry software, and we’ll cover the specification and system selection from a software perspective.
In the first installment of this series, we looked at the system development life cy-cle (SDLC) and some validation concepts (1). One concept was that validation is a process that covers the entire system de-velopment life cycle: Once started, you can’t stop. Now we will look in more de-tail at the first part of the SDLC.
THE WAY IT WAS
In the past, the spectrometer and soft-ware were purchased and then, just be-fore they were put into operational use, someone thought about validation. Some common questions may have been • Have we validated the system? No. • Does it matter? Probably.
• Will we get caught? Don’t even think about answering no to this question. Considering validation at such a late stage of the life cycle will mean a delay in
going operational, thus failing to gain benefit from the investment in the instru-ment or going live with no regulatory coverage. It depends on your approach to risk and if can you sleep at night.
THE WAY IT SHOULD BE
However, as we discussed in the previous article in this series, a proactive approach to validation is necessary and, if done right, will actually save you money by en-suring that you buy the right instrument for the job. So we’ll start at the beginning and look at the first stages of the life cycle: • Defining and controlling the validation
throughout the whole life cycle (writ-ing the validation plan).
• Specifying what you want the system to do (writing a user requirements specification).
• Selecting the system using the require-ments defined in the URS as the basis, rather than “the salesperson bought me a good meal.”
Defining and controlling the overall valida-tion.The validation plan is one name for the document that controls the validation effort for your spectrometer software. However, the name for this document varies from laboratory to laboratory. It may be called the validation plan, master validation plan, validation master plan, or quality plan.
Regardless of what you call this docu-ment in your organization, it should cover all the steps you are going to take to demonstrate the quality of the spectrome-try software in your laboratory.
Ideally the validation plan should be written as early as possible in the life cy-cle to define the overall steps that are re-quired as well as the documents to be pro-duced during each phase of the life cycle. There are different approaches to writing validation plans, and the document can be written in several stages in the life cycle.
I’ll outline my philosophy and rationale now and you, dear reader, can accept this as is, modify it, or ignore it.
First, you should write the validation plan as either the first or second docu-ment in the life cycle; I advise writing it af-ter the first or second draft of the URS to incorporate any implementation or roll-out issues in the overall validation strategy. The rationale for this approach is that the validation plan provides documented evi-dence of intent of the validation. The doc-ument will set out the overall strategy of the validation and define the life cycle phases and the documented evidence that will be produced in each phase. If you leave writing the validation plan until later in the project, one or more phases of the life cycle will have passed and you may need to write documents retrospectively. Furthermore, you’ll be out of compliance
with 21 CFR 11.10(k)(2),which requires
a time-sequenced audit trail of systems documentation.
Content of a validation plan.The purpose of a validation plan is to provide docu-mentation of intent for the whole valida-tion, including a definition of the life cycle used, documentation to be produced dur-ing the each stage of the life cycle, and roles and responsibilities of everyone in-volved in the project.
To provide a better perspective, the content of a validation plan is listed in the sidebar. It is based on the Institute of Electronic and Electrical Engineers (IEEE) standard for validation and verifi-cation plans (2).
This document is important because it defines what you will do in the validation, and you will be judged against it when your operation is inspected. Therefore, read and understand it well — don’t write the plan and forget it, because what you plan does not always come to pass. Usu-ally deviations from the plan occur that F O C U S O N
Q U A L I T Y
Q U A L I T Y
Q U A L I T Y
Q U A L I T Y
Validation of Spectrometry Software
Part II: Roles of the Validation Plan and User Requirements Specification
R . D . MCDO W A L L
Bob McDowall is a visiting senior lecturer in the Department of Chemistry at the University of Surrey, principal of McDowall Consulting (Bromley, UK), and Questions of Quality column editor of LCGC Europe,
Spectroscopy’s sister magazine. Address
![Figure 5. Schematic of a multicomponent lens system with extraction lens and off-axis quadrupole mass analyzer (courtesy of Agilent Technologies [Wilmington, DE]).](https://thumb-eu.123doks.com/thumbv2/123dok_br/16983198.763066/32.877.67.565.117.453/schematic-multicomponent-extraction-quadrupole-analyzer-courtesy-technologies-wilmington.webp)
![Figure 6. Schematic of a single ion lens and grounded stop system (not to scale [courtesy of PerkinElmer Instruments {Norwalk, CT}]).](https://thumb-eu.123doks.com/thumbv2/123dok_br/16983198.763066/34.877.327.563.114.340/figure-schematic-single-grounded-courtesy-perkinelmer-instruments-norwalk.webp)