(Annals of the Brazilian Academy of Sciences) ISSN 0001-3765
www.scielo.br/aabc
High spatial resolution analysis of Pb and U isotopes for geochronology by
laser ablation
multi-collector inductively coupled plasma mass spectrometry
(LA-MC-ICP-MS)
BERNHARD BÜHN, MÁRCIO M. PIMENTEL, MASSIMO MATTEINI and ELTON L. DANTAS
Instituto de Geociências, Universidade de Brasília, Campus Universitário Darcy Ribeiro, Asa Norte, 70910-900 Brasília, DF, Brasil
Manuscript received on March 13, 2008; accepted for publication on July 15, 2008; contributed byMARCIOM. PIMENTEL*
ABSTRACT
Age determinations using the 235U and 238U radioactive decay series to the daughter isotopes207Pb and206Pb, respectively, using the mineral zircon (ZrSiO4), are widely used to decipher geological processes. A new method
developed in the last couple of years, thelaserablation multi-collector inductively coupled plasma mass spectrometry (LA-MC-ICP-MS), overcomes previous laborious sample preparation, and yields isotopic ratios and age data with a high spatial resolution of ten of microns. The present study describes the analytical set-up and data reduction process as presently applied at the Laboratory for Geochronology of the University of Brasília. It explores the precision and accuracy of the method by cross-analysing three international zircon standards. We arrive at a precision of 1.9 to 3.7% (2σSD) and an accuracy of 0.6 to 3.8% (2σSD) for and U isotopic ratios of the standards. We also apply the method
to two natural zircon samples, which have previously been dated by other analytical methods. A comparison of the results shows a good conformity of the age data, being within the error limits. The data demonstrate the great analytical potential of the method for rapid, precise and accurate U-Pb isotopic analyses on the micron scale.
Key words:geochronology, U-Pb isotopes, LA-MC-ICP-MS, zircon, age dating.
INTRODUCTION
Absolute age determinations in the geosciences serve for a variety of applications including geotectonic stud-ies, sedimentation ages and sediment provenance, as well as dating of igneous and metamorphic rocks. They use the decay of a radioactive isotope in a natural min-eral with a half-life favourable for the expected age of the material or process investigated. Many of these applications are conducted in materials of considerable age (millions to billions of years), which suggests the use of the radioactive uranium isotopes235U and 238U with half-lifes of 7.04×10⁸ and 4.47 ×10⁹ years,
and the radiogenic daughter isotopes207Pb and206Pb,
*Member Academia Brasileira de Ciências Correspondence to: Bernhard Bühn E-mail: berbu@unb.br
respectively. Analysis of the parent and daughter iso-topes allows the determination of the crystallization age of the mineral. The mineral analysed should show cer-tain physicochemically favourable characteristics, such as high resistance to chemical exchange and recrystal-lization, and reasonably high U and radiogenic Pb con-tents for analysis, amongst others. These are met by the abundantly occurring mineral zircon (ZrSiO4)which is, therefore, the most traditional and widely used min-eral for age determinations of various geological appli-cations (e.g. Garbe-Schönberg and Arpe 1997, Košler et al. 2002).
in-troduction of the sample in aqueous solution, a laser
microprobe for sampling of solid material on the micron scale is connected to an ionization cell, which ionizes the sampled material in an inductively coupled plasma (ICP) and supplies single-charged ions to a magnetic sector or quadrupole mass spectrometer. The technique is referred to as “laserablation inductively coupled mass spectro-metry” (LA-ICP-MS). It avoids the laborious sample cleaning, dissolution and element separation in an ultra-clean laboratory environment required by the traditional isotope dilution thermal ionization mass spectrometry (ID-TIMS). Since the pioneering work by Feng et al. (1993) and Hirata and Nesbitt (1995), significant analyt-ical progress of the LA-ICP-MS method was achieved (see Vanhaecke and Moens 1999, Günther et al. 2000, Horn et al. 2000, Stirling et al. 2000, Simonetti et al. 2006, Paquette and Tiepolo 2007, Simon et al. 2007).
In this study, advances of this particular dating method, the multi-collector inductively coupled plasma mass spectrometry (MC-ICP-MS) coupled to a laser
microprobe, which has recently been set up at the Geo-chronology Laboratory of the University of Brasilia, are reported. We present results of three international zir-con standards cross-calibrated one against the other, and two natural zircon samples which have previously been analysed by other analytical methods. The data demon-strate the capacity of the method in terms of rapid, pre-cise and accurate U and Pb isotope analyses with high spatial resolution.
RATIONALE
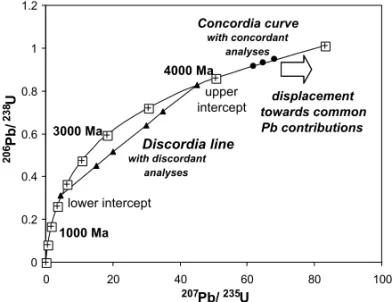
For the case of two radioactive isotopes of a single el-ement, as for the decay systems of238U and 235U, the ratios between the stable decay products and the radio-active parent isotopes (206Pb/238U and 207Pb/235U) are interrelated. Given closed-system conditions, they plot on a curve which extends from today towards the forma-tion of the Earth and the solar system at approximately 4.53 Ga ago (Fig. 1). The ratios have to concord one to the other following the relationship:
206Pb 238U =
207Pb
235U +1
λ238U/λ235U
−1 (1)
and define the “Concordia curve”, withλbeing the decay
constant of the respective radioactive isotope. Another
age information can be obtained by the207Pb/206Pb age, based on the relationship:
207Pb 206Pb =
235U 238U×
(eλ235U×t−1)
(eλ238U×t−1) (2)
With the constant present-day238U/235U ratio of 137.88, this age information considers only the daughter iso-topes. Hence, the more accurate and valid age infor-mation is obtained from the206Pb/238U and207Pb/235U isotope ratios.
Concordia curve
0 0.2 0.4 0.6 0.8 1 1.2
0 20 40 60 80 100
207Pb/235U
2
0
6P
b
/
2
3
8U
Discordia line with concordant
analyses
with discordant analyses
displacement towards common Pb contributions
4000 Ma
3000 Ma
1000 Ma
upper intercept
lower intercept
Fig. 1 – Principles of the Concordia diagram 207Pb/235U versus
206Pb/238U. Concordant analyses fall on the Concordia curve. Min-erals with a contribution of common Pb to the bulk Pb content plot below the Concordia curve. Lead loss leads to zircon analyses plot-ting on a Discordia line with the upper intercept indicaplot-ting the age of crystallization.
In order to avoid these corrections, it is always more effective to analyse minerals which, due to their crystal lattice characteristics, contain sufficient U to analyse the parent and the daughter isotope but, on the other hand, do not accommodate common Pb in the structure, be-cause of the mismatch between ionic charge and effec-tive ionic radius (Shannon 1976). These are, for ex-ample, zircon (ZrSiO4)or monazite (Ce,La,Nd,Th)PO4, which generally contain sufficient U to be analysed, ranging from 1 to>10000 ppm for zircon and 282 to >50000 ppm for monazite (Heaman and Parish 1991).
The common Pb content of the two minerals is gener-ally (but not always) very low.
Secondly, the system must have been closed to the gain or loss of the parent and daughter isotopes. In most cases, we deal with a loss of radiogenic lead which can be easily mobilized by geological processes because, as in the case of zircon, radiogenic Pb2+ does not fit the
Zr4+ ion characteristics (Mezger and Krogstad 1997).
The result is that the isotopic analyses plot on a “Dis-cordia line” which intersects the Con“Dis-cordia curve twice (Fig. 1): the upper intercept generally represents the time of crystallization of the mineral; the lower inter-cept may, in cases, be interpreted as the geological event when the crystal lost part of his radiogenic lead. Min-eral standards for isotopic analyses by LA-ICP-MS or ion microprobe should meet these two requirements, i.e. they should be concordant, and void of common lead.
METHOLOGICAL PROGRESS OF Pb-U ISOTOPIC ANALYSIS
Conventional Pb-U analyses for absolute age determi-nation of geological materials commonly use the tech-nique of ID-TIMS (Isotope Dilution Thermal Ioniza-tion Mass Spectrometry). Sample preparaIoniza-tion is labori-ous (e.g. Nebel-Jacobsen et al. 2005, Amelin and Davis 2006). The minerals have to be separated from the rock matrix, cleaned and sometimes abraded if the outer margins show alteration features (Mattinson 2005). The minerals are dissolved, and the Pb and U isotopes sep-arated by resin columns in an ultra-clean laboratory to allow sub-nanogram Pb isotopic analysis. The solutions are deposited on rhenium filaments for thermal ioniza-tion and introducioniza-tion of the ionized species into a mag-netic sector mass spectrometer.
This techniques has been successfully applied for decades and is still commonly used for U-Pb age deter-minations and other isotopic geochemical applications worldwide. Low-blank laboratories normally achieve a very high precision of the age determinations (Parrish and Noble 2003, Krymsky et al. 2007). However, short-comings of the technique are the need to separate the minerals from the matrix, the lack of spatial resolution of the analyses, and the laborious wet chemical prepara-tion under ultra-clean laboratory condiprepara-tions. On the other hand, the quality of the analyses is excellent, reaching precisions down to≤0.1% for the Pb/U isotopic ratios
(e.g., Mattinson 2005).
Another method which overcomes the need for wet chemical preparation is the Sensitive High Resolution Ion Micro Probe (SHRIMP). It focuses a high-energy ion beam (usually O−
2)onto an area of usually<30µm forin situisotopic analysis of minerals such as zircon.
The method reaches a precision and accuracy of about 1.0% (e.g., Cocherie et al. 2005). The SIMS method (Secondary Ion Mass Spectrometry), on the other hand, employs a primary ion beam and analyses the ejected secondary ions. It focuses an O−ion beam of typically
>10µm in diameter on a solid sample surface, and is
primarily applied to quantify major and trace element contents (for example, Pettke et al. 2004).
Many recent analytical methods, instead, use an “Inductively coupled plasma” ionization method (ICP) of the sample, generating a fine aerosol which is ionized in an Ar plasma (Horn et al. 2000). With Ar having a high first ionization potential of 15.759 V, the plasma ionizes all other elements to single-charged ions except for He, F and Ne. The method was developed in the early 1980s for introduction of dissolved samples. Likewise, the ICP array may be connected to a laser
equipped with additional multichannel ion counters (MICs) for high-sensitivity isotope analyses. The equip-ment with additional MICs is only a spatial problem within the Faraday cup arrangement and, generally, 6–8 MICs may easily be accommodated, allowing the simultaneous analysis of about 15 isotopes.
The shortcomings of the laserablation
multi-col-lector inductively coupled plasma mass spectrometry (LA-MC-ICP-MS) relative to SHRIMP or conventional TIMS analyses have been its lower precision. Thelaser
ablation process is not as stable as the SHRIMP method, or as the introduction of the sample in solution as in the case of TIMS. Firstly, this is due to the fragmenta-tion and vaporizafragmenta-tion process of the solid material ab-lated. Thelaserbeam may ablate parts of the mineral
which are slightly fractured, altered or otherwise phys-ically weakened or inhomogenized by previous geolog-ical processes, including the destruction of the mineral lattice by the proper radioactive radiation. The result is that the ablation and vaporization process of the mate-rial may vary in efficiency and completeness and, thus, the material transport to the plasma may not be contin-uous. Secondly, the carrier gas flux, normally ultrapure He, has an appreciable effect on the stability of the gas flow. Hence, thelasersettings, such aslaserintensity, laser frequency and beam diameter, together with the
gas flow parameters, are fundamental for a reasonably stable signal reaching the detectors.
With the more recent developments, however, the analytical uncertainties are getting closer to those of SHRIMP (see Willigers et al. 2002). Bruguier et al. (2001) arrived at 6%, Horn et al. (2000) at 2%, Chang et al. (2006) at 4%, and Gerdes and Zeh (2006) at 3–4% precision or accuracy for U-Pb isotope ratios of natural materials. These values depend very much on the nature of the material analysed, such as its com-position, presence of fractures, inclusions and hetero-geneities. The LA-ICP-MS analyses may be even more precise for synthetic glass standards which are chemi-cally and isotopichemi-cally homogeneous (Bernal et al. 2005). Often, the largest uncertainty is given by the analysis of the standards (Chang et al. 2006) which are gener-ally natural minerals including all the potential pitfalls. With a precision of that magnitude, however, with the control of the spatial resolution of the material
anal-ysed, and with the relatively easy preparation of the samples, thelaserablation MC-ICP mass spectrometry
certainly is the method of choice for the coming years for isotopic analysis of solid materials in the geo- and environmental sciences (Willigers et al. 2002, Košler and Sylvester 2003).
SET-UP OF THE LASER ABLATION MC-ICP-MS U-Pb METHOD
The analytical equipment used in this study was installed at the “Laboratório de estudos geocronológicos, geo-dinâmicos e ambientais” of the Geosciences Institute of the University of Brasília, Brasília, Brazil, by ini-tiative of Petróleo Brasileiro S/A – PETROBRAS and the “Ministério de Minas e Energia”. The laboratory is part of the “Rede de Estudos Geodinâmicos e Ambien-tais – GEOCHRONOS”. It was inaugurated in Decem-ber 2006 and consists, apart from other installations and instrumentation, of a Thermo FinniganNeptune
multi-collector inductively coupled plasma mass spectrometer. Attached to this is a New Wave 213µm Nd-YAG solid
state laser which provides the ablated material to the
mass spectrometer.
SAMPLEPREPARATION
Sample preparation is straightforward. The minerals of interest, in this case zircon, are separated from the rock matrix by crushing the rock, concentrating the heavy mineral fraction by panning, separating the zircon grains by a Frantz magnetic separator, and final hand-picking of individual zircon grains. In situanalysis directly on
a rock slab or thin section is also possible. However, it was found that the procedure of pre-concentration largely facilitates the measurements and localization of the zircons, so that it is worthwhile to be done.
The zircon grains are then located under the binoc-ular one by one on a glass wafer covered with a double-sided tape in order to secure the grains. A 9 mm diameter plastic ring is placed on the tape around the zircons, and filled with two-compound epoxy. After 1-2 days of dry-ing, the mounts are removed from the tape. Polishing of the mounts is done with 3µm followed by 1µm diamond
The mounts are then taken to an ultrasonic bath with 3% HNO3, and then cleaned with distilled water. A Nylon sample holder which takes three mounts was especially constructed. The three sites may be occupied with one standard and two samples, or with two standards and one sample.
THELASERSET-UP
The sample chamber is flushed with He gas of analyt-ical quality, which samples the ablated and vaporized material to be transported via Tygon tubes into the ICP. Before entering thelasersample chamber, the He passes
through a glass tube filled with gold-coated quartz crys-tals (gold trap) to remove the largest part of mercury (Hg) whose isotope204Hg interferes with the204Pb iso-tope analysed to apply the common Pb correction. The He gas flux is commonly 0.35–0.45 L/min.
The laser is run at a frequency of 7–10 Hz and
an energy of 30–36%, resulting in alaserenergy of ca.
0.5 to 1.2 J/cm2. A smalllaserspot size of say 30µm applied to a single spot with theselaserconditions would
not produce enough material for a reasonable signal, but at least 40–50µm would be required, with the signal
intensity deteriorating along duration of the analysis be-cause of the deepening of thelaserpit. This suggested the use of a raster scheme of thelaserwhich samples
only the surface of the zircon. The raster is composed of two parallel and a connecting line with a 20µm spacing.
With a 30µm beam diameter applied here, the sampled
area of the zircon is a square of about 70µm on each
side. With a speed of 1µm/sec, the propagating laser
spot takes about 1 min to pass the raster, which is enough time to collect the signal. This setting also avoids the prominent down-hole fractionation of isotopes which would require an additional correction, and a signifi-cantly higher laser energy to drill the zircon. Before
signal collection, a pre-ablation run along the raster is applied to clean the mineral surface. The running con-ditions of this cleaning run are: 40µm spot size,
fre-quency 10 Hz and 25%laserenergy.
THEICP-MSANDMULTI-COLLECTORSET-UP
Before entering the plasma, the He gas coming from the
laserwith the ablated material, is combined with Ar gas
of analytical quality which sustains the plasma. The
de-tector arrangement consists of a central Faraday cup and 4 Faraday cups each on the high side and low side of the centre cup (Fig. 2). For high-sensitivity analyses of the Pb and U isotopes, the mass spectrometer is equipped with 6 ion counters (ICs, or multichannel ion counters MICs). Four of them are fixed on the outermost Faraday cup of the low side (cup L4), one on the third cup of the low side (cup L3), and one on the outermost Faraday cup on the high side (cup H4). The latter is used only for the analysis of238U in materials with extremely low U content. For the present application, we analysed238U on the Faraday cup H4. The other isotopes are collected on the low side. The four ICs on the cup L4 are fixed at defined distances referring to: one mass unit between L4 and IC5, one mass unit between IC5 and IC4, two mass units between IC4 and IC3, and two mass units between IC3 and IC2. The signals collected on the four ICs are: 207Pb on IC5,206Pb on IC4, 204Hg/204Pb on IC3, and202Hg on IC2. Because of the always present contamination of the He gas with Hg, a correction for the isobaric interference between204Hg and204Pb has to be applied, using the signal of202Hg collected on IC2.
DATACOLLECTION
With this collector set-up, five isotopes are analysed si-multaneously. Before analysis, the Faraday cups are calibrated for baseline and gain, and the ICs for their yield. To ensure the optimal operating voltage and the same sensitivity for the ICs, a signal of about 300,000 counts per second (cps) is successively directed into the 4 ICs using different analysing lines. We use a solution of206Pb for this cross-calibration. Based on the signal response for each IC, the operating voltage of each IC is adjusted in order to ensure measuring conditions with the same sensitivity for all ICs used.
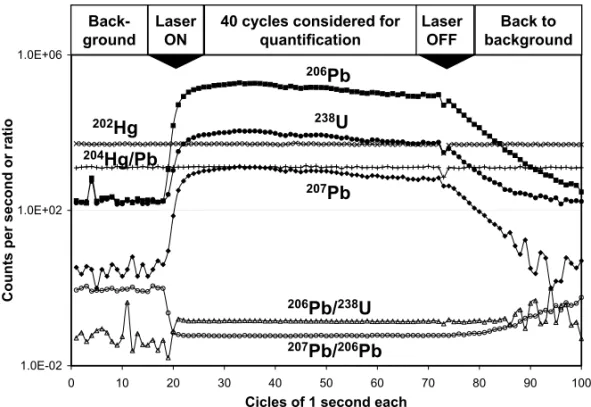
For standard and sample analysis, the signals are collected in a single block with 40 cycles of 1.049 sec. each. The laser is started and, when the signal at
L1 C H1
L4 L3 L2 H2 H3 H4
IC5 IC4
IC2 IC3
Center cup with SEM
(IC1) IC6
Tick marks are mass units
IC7
202Hg 204Pb
206Pb207Pb 238U
204Hg
206Pb 207Pb 238U
Low U-Pb concentr.
High U-Pb concentr.
High side Faraday cups Low side
Faraday cups
Fig. 2 – Set-up of the cup configurations (Faraday cups and ICs) for low U-Pb and high U-Pb concentrations in zircon with the Thermo FinniganNeptuneMC-ICP-MS.
a blank, a standard, and three samples, blank, standard, and so on. The method accounts for the drift of the instrument, and eliminates the need to correct for the mass bias of individual isotopes.
DATAREDUCTION
The isotope data of the 40 analysed cycles are trans-ferred into an in-house Excel spreadsheet for data re-duction. The isotope ratios of the 40 cycles are evalu-ated on a 2σ standard error rejection basis. The routine
then calculates the error correlation valueρ(rho) for the
206Pb/238U and 207Pb/235U data. The isobaric contri-bution of204Hg is subtracted from the joint204Pb/204Hg peak by considering the analyzed202Hg/204Hg ratio. The spreadsheet allows to chose between three ways to deter-mine the202Hg/204Hg value which is applied for correc-tion: (i) from the mean of the two bracketing blanks, (ii) from the mean of the two bracketing (common Pb-free) standards, or (iii) from the mean of the four. Normally, the difference between the three determinations is mi-nor. We consider this more favourable than applying the natural202Hg/204Hg ratio of 4.346, which would require an absolutely precise cross-calibration of IC2 and IC3. Because235U cannot be analysed with this type of cup configuration, the natural ratio 238U/235U of 137.88 is used to calculate the235U intensity.
The correction for instrumental drift and mass bias is done by considering the two standards analysed be-fore and after the samples, and the two blank analy-ses run before and after the samples, respectively, af-ter applying a blank correction for all isotopes analysed. The normalization of the isotopic ratios of the samples (Rspl)follows the formula of Albarède et al. (2004):
Rspl=
Rstd×rspl
r1−θ
std1 ×rθstd2
(3)
for which Rstd is the true isotopic ratio of the standard (207Pb/206Pb or206Pb/238U ratios, respectively), r
spl is the analysed isotopic ratio of the sample, and rstd1 and rstd2are the analysed isotopic ratios of the two standards before and after the samples along the sequence. The variableθ(theta) is a time factor (Albarède et al. 2004)
or, in other words, gives respective weight to the two standard measurements. It depends on the location of the samples within the analysing sequence, and takes values between 0 and 1. For example, three successive analyses run between two standards and two blanks sug-gest θ = 0.25, 0.50 and 0.75 for samples 1, 2 and 3,
respectively. The term r1−θ
std1×rθstd2
is a linear inter-polation of the logarithms of the isotopic ratios, which accounts for the generally exponential instrumental drift. The same algorithm is applied to correct for the drift in the blank analyses. An alternative would be to inject a diluted thallium (Tl) solution to determine the mass bias of the Pb isotopes (e.g., Horn et al. 2000) which, however, does not allow the correction of U mass bias. The standard-sample bracketing approach applied here, therefore, certainly bears the least error for that analyt-ical method, as it does not require intensive mass bias corrections.
The corrected206Pb/238U and207Pb/206Pb ratios so obtained are transferred into absolute age information using the software of Ludwig (2003). The software was also used to plot the Concordia diagrams. The errors of the206Pb/238U and207Pb/206Pb ratios were propagated by quadratic addition of the external reproducibility and the within-run precision, following equation (4):
2σ
206Pb 238U, or
207Pb 206Pb
!
propagated =2SD∧analysed2 +2SE∧analysed2
1/2
1.0E-02 1.0E+02 1.0E+06
0 10 20 30 40 50 60 70 80 90 100
Cicles of 1 second each
C
o
u
n
ts
p
e
r
s
e
c
o
n
d
o
r
ra
ti
o
207Pb/206Pb 206Pb/238U
207Pb 204Hg/Pb
202Hg 238U
Laser ON
Laser OFF
Back-ground
40 cycles considered for quantification
Back to background
206Pb
Fig. 3 – Typical signal sequence of alaserablation experiment. Note that the absolute count rates of the isotopes may vary during the ablation process while the isotope ratios remain constant. The signals of202Hg and204Hg/Pb, in the case of no common204Pb present in the ablated sample, come solely from the Hg contents in the Ar gas, and are therefore not influenced by the ablation process.
with SD being the sample standard deviationσ:
σ =
v u u u t 1 N
N X
i=1
xi−xm2 (5)
where N is the number of analyses, xi is the value of each individual analyses xi to xN, and xm is the arith-metic mean of all analyses. Whereas the SD is indepen-dent of the number of analyses, the standard error SE:
SE = √σ
N (6)
decreases with the number of analyses N taken. The external reproducibility (2 SD∧2
analysed)is represented by the standard deviation obtained by repeated analysis of standard zircon GJ-1 which were run during the analyti-cal session (generally∼0.8% for207Pb/206Pb, and
∼1% for206Pb/238U). The within-run precision (2 SE∧2
analysed) is the standard error calculated for each analysis. The resulting errors are 2σstandard deviations.
Zircon U-Pb isotopic analyses may require a correc-tion for the common lead contribucorrec-tion to the total206Pb and207Pb signals. There are a couple of methods to do this in the literature (see Andersen 2002, Horstwood et
al. 2003). For minerals with a low common Pb content as, for example, zircon, we use a correction based on the amount of non-radiogenic204Pb. The counts per second of204Pb (including a correction for204Hg) are used to deduce the amount of non-radiogenic, common 206Pb and207Pb, given a common Pb composition following the model of Stacey and Kramers (1975). With the frac-tion fcof common206Pb and207Pb so obtained:
fc = Pbc Pbt =
Pbc
Pbc+Pbr (7) where Pbcis the value (in counts per second) of common Pb, Pbtthe total Pb, and Pbrthe radiogenic Pb, with Pb being206Pb or207Pb, respectively, we use the relation-ships:
206Pb 238U
radiogenic =
206Pb 238U
total ×(1−fc), (8) and
207Pb 235U
radiogenic =
207Pb 235U
total
−
206Pb 238Utotal ×
207Pb 206Pbcommon ×
238U 235U×fc
of Andersen (2002) to arrive at common Pb-corrected 206Pb/238U and207Pb/235U isotopic ratios. The neces-sity for a correction is judged from the204Pb signal in-tensity. Values smaller than∼25 cps (blank-corrected), resulting in 206Pb/204Pb ratios well beyond 3000, sug-gest an insignificant common Pb content which would not recognizably effect the calculated ages. All zircons analysed in this study met this condition, and therefore did not require a correction.
STANDARDS AND SAMPLES
Three international zircon standards were analysed, us-ing each one as an external standard and correctus-ing the remaining two against it. This yields a set of 6 iso-tope ratio and age data which are compared with the certified values of the standards (see Table I). The stan-dards are: (i) GJ-1 zircon standard provided by the ARC National Key Centre for Geochemical Evolution and Metallogeny of Continents (GEMOC), Australia. This is a gem-quality zircon crystal of about 0.7 cm in diameter which was broken and prepared for analysis. Its refer-ence age after Jackson et al. (2004) is: 207Pb/206Pb age = 608.6±1.1 Ma,206Pb/238U age = 600.4±1.8 Ma,
207Pb/235U age = 602.1
±3.0 Ma; (ii) Temora 2,
pro-vided by Lance Black, Geoscience Australia, Australia, which comes from the Middledale gabbroic diorite in eastern Australia; the zircon crystals have a size of about 300–500µm and, prior to sample preparation, the
con-centrate was hand-picked to obtain a high-purity zircon concentrate. Its reference age after Black et al. (2004) is: 207Pb/206Pb age = 419.1±9.1 Ma,206Pb/238U age
= 416.2±1.1 Ma,207Pb/235U age = 416.7±1.7 Ma;
(iii) FC1 zircon concentrate provided by Richard Arm-strong, Australian National University, Canberra, Aus-tralia; the crystals have sizes of approximately 50– 100µm, and were hand-picked prior to sample
prepara-tion; they were extracted from the Duluth Complex in the U.S.A. Its reference age (Paces and Miller 1993) is: 207Pb/206Pb age = 1098.9 Ma, 206Pb/238U age = 1099.9 Ma,207Pb/235U age = 1100.0 Ma.
For an additional test of the method, two zircon samples from our own laboratory which had previously been dated by other analytical methods were also investi-gated here. One is a relatively young zircon concentrate (sample HD66) from a hornblende-bearing orthogneiss
of the Neoproterozoic Goiás magmatic arc which has previously been dated at 630±5 Ma (2σ )by U-Pb
ID-TIMS in our laboratory (Laux et al. 2005). Its average 207Pb/206Pb TIMS age is 633.3
±5.7 Ma. The other
sam-ple (EC69A) has much older zircon crystals and went through a more complex geological history. They were extracted from a migmatized hornblende- and biotite-bearing tonalite from an Archean nucleus of the São José do Campestre Massif in the Borborema Province, NE Brazil. The zircons yielded an upper intercept age of 3065 ± 12 Ma determined by SHRIMP analysis (Dantas et al. unpublished data).
RESULTS
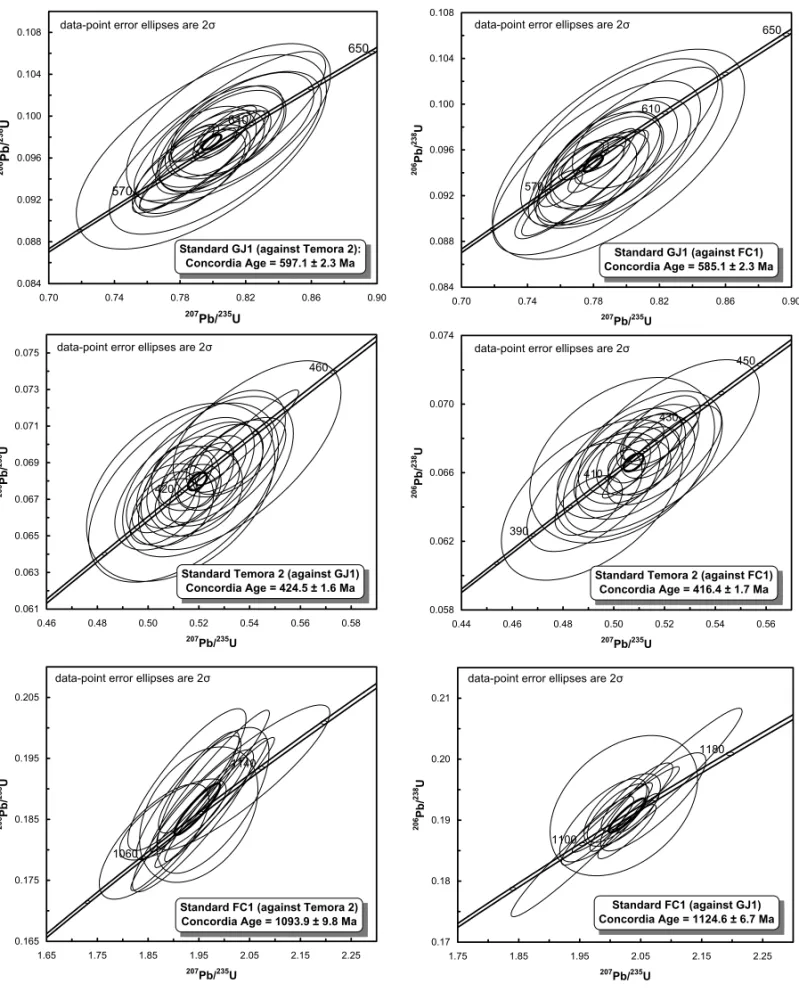
Between 13 and 23 analyses were run for the standards GJ1, Temora 2 and FC1. Figure 4 shows the ages ob-tained for each standard normalized against one another in a Concordia diagram, and Table I summarizes the data obtained. The concordance between the values obtained and the referenced standard data of the 207Pb/206Pb, 206Pb/238U and207Pb/235U age data is well satisfactory. We obtained precisions of 1.9 to 3.7% (2σ standard
de-viation) for the207Pb/206Pb,206Pb/238U and207Pb/235U age data, depending on the isotope system and on the particular standard. The accuracy was calculated as the percentage of deviation between the analysed Concor-dia age and the referenced207Pb/206Pb age. The Concor-dia age, following Ludwig (2003) is, “the most-probable age for a data-point (or weighted-mean data-point) on a Concordia diagram, where the true location of the data point is assumed to fall precisely on the Concordia curve”. Because not all referenced standards provide the error correlation coefficient to calculate that age, their referenced207Pb/206Pb age was used. The accu-racy so obtained varies between 0.6 and 3.8% (2σ
stan-dard deviation).
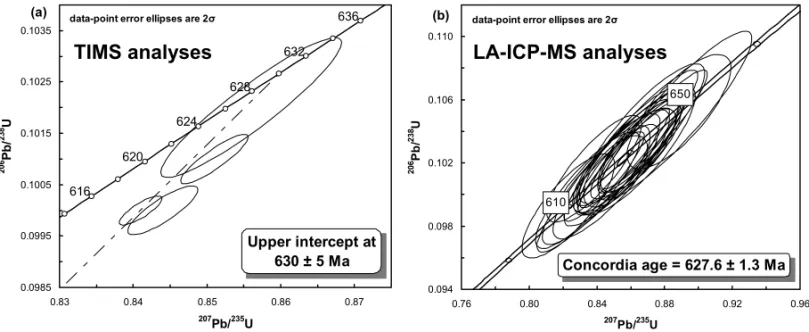
The majority of the 23 analyses obtained for the natural sample HD66 (Table II) were taken as multi-ple analyses on different localities of individual grains. They are all concordant (Fig. 5), yielding a Concordia age of 627.6±1.3 Ma, which is identical within
650 610 570 0.084 0.088 0.092 0.096 0.100 0.104 0.108
0.70 0.74 0.78 0.82 0.86 0.90
207 Pb/235U
2 0 6P b / 2 3 8U
Standard GJ1 (against Temora 2): Concordia Age = 597.1 ± 2.3 Ma
data-point error ellipses are 2 650
610 570 0.084 0.088 0.092 0.096 0.100 0.104 0.108
0.70 0.74 0.78 0.82 0.86 0.90
207Pb/235U
2 0 6P b / 2 3 8U
Standard GJ1 (against FC1) Concordia Age = 585.1 ± 2.3 Ma data-point error ellipses are 2
460 420 0.061 0.063 0.065 0.067 0.069 0.071 0.073 0.075
0.46 0.48 0.50 0.52 0.54 0.56 0.58
207Pb/235U
2 0 6P b / 2 3 8U
Standard Temora 2 (against GJ1) Concordia Age = 424.5 ± 1.6 Ma data-point error ellipses are 2
450 430 410 390 0.058 0.062 0.066 0.070 0.074
0.44 0.46 0.48 0.50 0.52 0.54 0.56
207
Pb/235U
2 0 6P b / 2 3 8U
Standard Temora 2 (against FC1) Concordia Age = 416.4 ± 1.7 Ma data-point error ellipses are 2
1140 1060 0.165 0.175 0.185 0.195 0.205
1.65 1.75 1.85 1.95 2.05 2.15 2.25
207
Pb/235U
2 0 6P b / 2 3 8U
Standard FC1 (against Temora 2) Concordia Age = 1093.9 ± 9.8 Ma data-point error ellipses are 2
1180 1100 0.17 0.18 0.19 0.20 0.21
1.75 1.85 1.95 2.05 2.15 2.25
207Pb/235U
2 0 6P b / 2 3 8U
Standard FC1 (against GJ1) Concordia Age = 1124.6 ± 6.7 Ma data-point error ellipses are 2
TABLE I
Referenced and determined ages (by LA-ICP-MS) of the zircon standards GJ1, Temora 2 and FC1.
Sample Standard
No. 207Pb*/ Error 207Pb*/ Error Prec. 206Pb*/ Error 206Pb*/ Error Prec. of 206Pb* (2σ )
206Pb*
(2σ ) (2σ )
238U
(2σ )
238U
(2σ ) (2σ )
anal. age (Ma) (Ma) age (Ma) (Ma) (%) age (Ma) (Ma) age (Ma) (Ma) (%)
referenced analysed referenced analysed
GJ1 Temora 2 23 608.6 1.1 598.4 6.3 2.8 600.4 1.8 598.3 20.2 2.7
GJ1 FC1 20 608.6 1.1 583.7 6.1 2.4 600.4 1.8 584.0 19.8 2.3
Temora 2 GJ1 23 419.1 9.1 424.8 16.5 2.9 416.2 1.1 424.9 12.9 2.8
Temora 2 FC1 20 419.1 9.1 414.9 16.6 3.5 416.2 1.1 414.9 12.6 3.5
FC1 Temora 2 13 1098.9 n.r. 1111.6 5.5 3.7 1099.9 n.r. 1109.9 30.4 3.4
FC1 GJ1 13 1098.9 n.r. 1127.8 4.8 2.9 1099.9 n.r. 1127.2 25.5 2.7
Sample Standard
No. 207Pb*/ Error 207Pb*/ Error Prec. Concordia Error
Accuracy of 235U (2σ )
235U
(2σ ) (2σ ) age (Ma) (2σ )
(%) anal. age (Ma) (Ma) age (Ma) (Ma) (%) determined (Ma)
referenced analysed
GJ1 Temora 2 23 602.1 3.0 596.7 15.9 1.6 597.1 2.3 1.9
GJ1 FC1 20 602.1 3.0 587.7 15.7 1.9 585.1 2.3 3.9
Temora 2 GJ1 23 416.7 1.7 426.6 10.8 2.8 424.5 1.6 1.3
Temora 2 FC1 20 416.7 1.7 415.9 10.6 3.7 416.4 1.7 0.6
FC1 Temora 2 13 1100.0 n.r. 1098.0 24.7 2.6 1093.9 9.8 0.5
FC1 GJ1 13 1100.0 n.r. 1123.3 21.9 2.2 1124.6 6.7 2.3
Referenced values from: GJ1 (Jackson et al. 2004), Temora 2 (Black et al. 2004), FC1 (Paces and Miller 1993). Precision (Prec.): 2σ
precision for the number of analyses, “n.r.” = not reported. All errors are 2σstandard deviations. Accuracy: Percentage of deviation between analysed concordia age and referenced207Pb/206Pb age.
weighted average of 24 207Pb/206Pb ages resulted in a 207Pb/206Pb age of 628.7
±6.0 Ma, compared with
the TIMS207Pb/206Pb age of 633.3
±5.7 Ma.
Sample EC69A shows a more complex zircon pop-ulation, as seen from 24 SHRIMP (Table III) and 35 MS analyses (Table IV). Most of the LA-ICP-MS analyses were taken as multiple shots on individ-ual zircon grains. None of the zircons required a com-mon Pb correction. The ICP-MS analyses display var-ious groups of zircons plotting on supposedly different Discordia lines (Fig. 6). The youngest upper intercept age, defined by four discordant and three concordant analytical points, yields the age of 3045 ± 24 Ma, which agrees within error with the SHRIMP age of 3065±12 Ma. However, various older zircon popu-lations were encountered in the sample. One is defined by 17 discordant zircon analyses which yield an upper intercept age of 3305 ±51 Ma. A minor population composed of three discordant analyses gives an upper intercept age of 3625 ±38 Ma. The two latter
pop-ulations may relate to 3.4–3.5 Ga ages reported from the same area by Dantas et al. (2004). Another group of five highly discordant zircon analyses with extremely low206Pb/238U ratios may represent still another, even older geological event. Three analyses on grain 14 (see Table IV, but not included in Fig. 6) yielded one con-cordant and two nearly concon-cordant data with ages be-tween 540 and 570 Ma. They represent another event of resetting of the isotope system during the Neopro-terozoic/Cambrian Brasiliano cycle. Therefore, the Dis-cordias of all older zircon populations were anchored to 558 Ma, which is the mean of these three analyses.
DISCUSSION AND CONCLUSIONS
A comparison of the LA-ICP-MS results of the natural sample HD66 with TIMS analyses shows a fine confor-mity even within the limits of error, yielding 627.6±
1.3 Ma for LA-ICP-MS and 630±5 Ma for the TIMS
TABLE II
TIMS and LA-ICP-MS analyses of sample HD66. T I M S
207Pb*/ 2σ 207Pb*/ 2σ 206Pb*/ 2σ 207Pb/ 2σ 207Pb*/ 2σ 206Pb*/ 2σ
Analysis 206Pb* error 235U error 238U error ρ 206Pb error 235U error 238U error (%) (%) (%) age (Ma) age (Ma) age (Ma) 1 0.0609 0.16 0.841 0.28 0.100 0.23 0.82 637.0 3.5 619.7 1.3 614.4 1.3 2 0.0609 0.24 0.844 0.46 0.100 0.39 0.84 636.0 5.3 621.4 2.1 614.4 2.3 3 0.0608 0.20 0.851 0.44 0.101 0.39 0.89 634.0 4.3 625.2 2.1 620.3 2.3 4 0.0606 0.44 0.856 1.17 0.102 1.09 0.93 626.0 9.5 627.9 5.5 626.1 6.5
LA-ICP-MS
1 0.06112 1.6 0.8864 2.5 0.10499 2.5 0.91 643.5 33.9 644.4 11.9 643.6 15.4 2 0.06054 2.2 0.8511 1.6 0.10147 1.6 0.63 622.8 46.3 625.2 7.4 623.0 9.5 3a 0.06068 1.0 0.8566 2.8 0.10230 2.8 0.94 627.9 22.4 628.2 12.9 627.9 16.5 3b 0.06054 1.2 0.8474 2.7 0.10147 2.7 0.93 623.0 26.1 623.2 12.5 623.0 16.1 3c 0.06082 1.1 0.8658 2.0 0.10316 2.0 0.90 632.8 22.5 633.3 9.5 632.9 12.2 4 0.06116 1.5 0.8885 1.9 0.10525 1.9 0.76 645.0 31.2 645.5 9.2 645.1 11.9 5a 0.06094 2.0 0.8666 2.2 0.10385 2.2 0.86 637.2 42.8 633.7 10.5 636.9 13.5 5b 0.06090 1.7 0.8637 2.4 0.10358 2.4 0.92 635.7 37.2 632.1 11.0 635.3 14.3 6a 0.06080 1.9 0.8653 2.3 0.10303 2.3 0.77 632.1 39.7 633.0 10.9 632.2 14.0 6b 0.06076 1.6 0.8642 1.7 0.10283 1.7 0.75 630.8 33.1 632.4 7.8 631.0 10.0 6c 0.06077 2.0 0.8632 2.5 0.10284 2.5 0.82 630.9 41.9 631.8 11.8 631.0 15.2 7a 0.06085 1.0 0.8671 1.9 0.10333 1.9 0.94 633.9 21.0 634.0 8.9 633.9 11.4 7b 0.06079 1.1 0.8637 1.7 0.10296 1.7 0.87 631.7 24.0 632.1 7.9 631.7 10.1 7c 0.06083 1.2 0.8662 1.6 0.10319 1.6 0.89 633.1 26.6 633.5 7.6 633.1 9.7 8a 0.06049 1.1 0.8441 2.1 0.10114 2.1 0.90 621.0 23.5 621.4 9.5 621.1 12.1 8b 0.06059 1.3 0.8657 2.2 0.10188 2.2 0.83 624.6 27.7 633.2 10.1 625.4 12.8 8c 0.06069 1.7 0.8571 2.2 0.10236 2.2 0.82 628.2 35.9 628.6 10.1 628.2 13.0 9 0.06056 1.6 0.8524 2.5 0.10161 2.5 0.83 623.6 34.3 626.0 11.4 623.8 14.6 10a 0.06018 2.1 0.8231 2.6 0.09928 2.6 0.80 610.2 44.8 609.8 11.7 610.2 14.9 10b 0.06046 1.8 0.8424 2.4 0.10097 2.4 0.88 620.0 38.4 620.5 10.9 620.1 14.0 10c 0.06051 2.1 0.8484 2.9 0.10127 2.9 0.85 621.7 45.7 623.8 13.5 621.9 17.3 11a 0.06035 1.4 0.8346 2.3 0.10028 2.3 0.86 616.1 29.3 616.1 10.7 616.1 13.6 11b 0.06057 1.4 0.8485 1.8 0.10162 1.8 0.76 623.9 30.3 623.8 8.4 623.9 10.7
Note: Analyses with letters (a, b, c) indicate analyses on the same zircon grain. All errors are 2σstandard deviations.
616 620
624 628
632 636
0.0985 0.0995 0.1005 0.1015 0.1025 0.1035
0.83 0.84 0.85 0.86 0.87
207 Pb/235
U
2
0
6P
b
/
2
3
8U
Upper intercept at 630 ± 5 Ma data-point error ellipses are 2
(a)
650
610
0.094 0.098 0.102 0.106 0.110
0.76 0.80 0.84 0.88 0.92 0.96
207Pb/235U
2
0
6P
b
/
2
3
8U
Concordia age = 627.6 ± 1.3 Ma data-point error ellipses are 2
(b)
TIMS analyses
LA-ICP-MS analyses
TABLE III
SHRIMP data of sample EC69A.
207Pb*/ 1σ 207Pb*/ 1σ 206Pb*/ 1σ 207Pb/ 1σ 207Pb*/ 1σ 206Pb*/ 1σ Analysis 206
Pb* error 235U error 238U error ρ 206Pb error 235U error 238U error
(%) (%) (%) age (Ma) age (Ma) age (Ma)
1 0.23187 0.16 18.88 1.4 0.5904 1.4 0.99 3065 2.6 3036 13.6 2991 34 2 0.22398 0.26 17.02 1.6 0.5512 1.5 0.99 3010 4.2 2936 15.5 2830 34 3 0.22960 0.59 18.61 1.6 0.5877 1.4 0.92 3049 9.6 3022 15.5 2980 33 4a 0.17531 0.17 5.20 1.5 0.2153 1.5 0.99 2609 2.8 1853 12.9 1257 17 4b 0.23401 0.24 17.90 1.5 0.5547 1.5 0.99 3080 3.9 2984 14.5 2845 35 5 0.22896 0.20 18.83 1.5 0.5964 1.4 0.99 3045 3.2 3033 14.6 3015 33 6 0.23269 0.11 18.40 1.4 0.5734 1.4 1.00 3071 1.7 3011 13.6 2922 33 7 0.22065 0.33 15.63 1.5 0.5139 1.5 0.98 2986 5.4 2854 14.4 2673 33 8a 0.22995 0.22 18.74 1.5 0.5909 1.4 0.99 3052 3.5 3029 14.6 2993 34 8b 0.23278 0.20 19.57 1.4 0.6098 1.4 0.99 3071 3.2 3070 13.6 3069 34 9 0.22789 0.36 17.77 1.5 0.5654 1.4 0.97 3037 5.8 2977 14.5 2889 33 10 0.22748 0.34 16.34 1.5 0.5210 1.4 0.97 3034 5.5 2897 14.5 2703 31 11 0.23340 0.41 19.46 1.6 0.6047 1.5 0.96 3076 6.6 3065 15.6 3049 37 12 0.22859 0.26 15.47 1.5 0.4907 1.4 0.98 3042 4.2 2845 14.4 2574 30 13 0.22691 0.13 17.89 1.4 0.5719 1.4 1.00 3030 2.1 2984 13.6 2915 32 14 0.23221 0.14 19.22 1.4 0.6003 1.4 1.00 3067 2.2 3053 13.6 3031 34 15 0.22759 0.23 17.75 1.5 0.5655 1.5 0.99 3035 3.7 2976 14.5 2889 35 16 0.23251 0.09 18.21 1.4 0.5680 1.4 1.00 3069 1.4 3001 13.6 2900 33 17 0.23087 0.12 18.37 1.4 0.5772 1.4 1.00 3058 1.9 3009 13.6 2937 33 18 0.22915 0.32 17.01 1.5 0.5382 1.4 0.98 3046 5.1 2935 14.5 2776 32 19 0.21750 0.68 15.98 1.6 0.5327 1.5 0.91 2962 11 2876 15.4 2753 34 20 0.22271 0.44 15.34 1.5 0.4996 1.4 0.96 3000 7.1 2837 14.4 2612 30 21 0.23329 0.19 19.00 1.4 0.5906 1.4 0.99 3075 3.1 3042 13.6 2992 34 22 0.22929 0.10 17.43 1.4 0.5513 1.4 1.00 3047 1.6 2959 13.5 2830 32
Note that the errors are 1σerrors. The majority of shots were taken as single shots on zircon grains.
that there was no Pb loss in the zircons (no discordant zircons), in contrast to three out of four TIMS analy-ses (Fig. 5a). It is most probable, that weathered or otherwise isotopically disturbed surfaces of the zircons are responsible for the discordant U-Pb TIMS data, since the zircons were not abraded before digestion to remove possible alterations or disturbances. The LA-ICP-MS method avoids this by polishing of the zircon grains before analysis, and by alaserpre-ablation which cleans the uppermost part of the mineral surface.
The LA-ICP-MS analyses of the natural sample EC69A show a complex history of zircon growth and lead loss. Three concordant zircon analyses, together with 4 other analyses, define an upper intercept age of 3045±24 Ma (Fig. 6) which agrees, within error, with the 3065±12 Ma SHRIMP age. There are other
discor-dant zircon analyses which, although being discordiscor-dant, indicate a complex history of crystallization and partial resetting. In that particular case, the internal structure of the zircons would have to be imaged by cathodolu-minescence or back-scattered electron techniques prior to analysis, for ensuring an unequivocal interpretation of the various age populations. The analyses presented here show, nevertheless, that it is possible to detect an even complex geological history from a set of only 10– 15 zircon grains, by high spatial resolution LA-ICP-MS analysis.
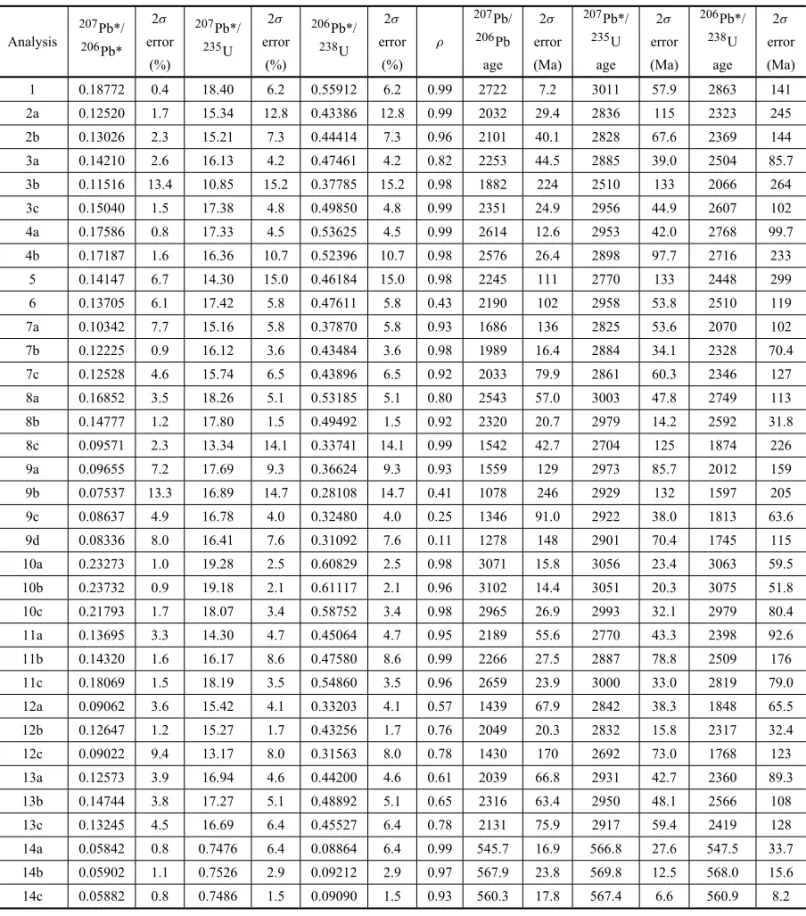
TABLE IV
LA-ICP-MS data of sample EC69A.
207Pb*/ 2σ 207Pb*/ 2σ 206Pb*/ 2σ 207Pb/ 2σ 207Pb*/ 2σ 206Pb*/ 2σ Analysis 206
Pb* error 235U error 238U error ρ 206Pb error 235U error 238U error
(%) (%) (%) age (Ma) age (Ma) age (Ma)
1 0.18772 0.4 18.40 6.2 0.55912 6.2 0.99 2722 7.2 3011 57.9 2863 141 2a 0.12520 1.7 15.34 12.8 0.43386 12.8 0.99 2032 29.4 2836 115 2323 245 2b 0.13026 2.3 15.21 7.3 0.44414 7.3 0.96 2101 40.1 2828 67.6 2369 144 3a 0.14210 2.6 16.13 4.2 0.47461 4.2 0.82 2253 44.5 2885 39.0 2504 85.7 3b 0.11516 13.4 10.85 15.2 0.37785 15.2 0.98 1882 224 2510 133 2066 264 3c 0.15040 1.5 17.38 4.8 0.49850 4.8 0.99 2351 24.9 2956 44.9 2607 102 4a 0.17586 0.8 17.33 4.5 0.53625 4.5 0.99 2614 12.6 2953 42.0 2768 99.7 4b 0.17187 1.6 16.36 10.7 0.52396 10.7 0.98 2576 26.4 2898 97.7 2716 233 5 0.14147 6.7 14.30 15.0 0.46184 15.0 0.98 2245 111 2770 133 2448 299 6 0.13705 6.1 17.42 5.8 0.47611 5.8 0.43 2190 102 2958 53.8 2510 119 7a 0.10342 7.7 15.16 5.8 0.37870 5.8 0.93 1686 136 2825 53.6 2070 102 7b 0.12225 0.9 16.12 3.6 0.43484 3.6 0.98 1989 16.4 2884 34.1 2328 70.4 7c 0.12528 4.6 15.74 6.5 0.43896 6.5 0.92 2033 79.9 2861 60.3 2346 127 8a 0.16852 3.5 18.26 5.1 0.53185 5.1 0.80 2543 57.0 3003 47.8 2749 113 8b 0.14777 1.2 17.80 1.5 0.49492 1.5 0.92 2320 20.7 2979 14.2 2592 31.8 8c 0.09571 2.3 13.34 14.1 0.33741 14.1 0.99 1542 42.7 2704 125 1874 226 9a 0.09655 7.2 17.69 9.3 0.36624 9.3 0.93 1559 129 2973 85.7 2012 159 9b 0.07537 13.3 16.89 14.7 0.28108 14.7 0.41 1078 246 2929 132 1597 205 9c 0.08637 4.9 16.78 4.0 0.32480 4.0 0.25 1346 91.0 2922 38.0 1813 63.6 9d 0.08336 8.0 16.41 7.6 0.31092 7.6 0.11 1278 148 2901 70.4 1745 115 10a 0.23273 1.0 19.28 2.5 0.60829 2.5 0.98 3071 15.8 3056 23.4 3063 59.5 10b 0.23732 0.9 19.18 2.1 0.61117 2.1 0.96 3102 14.4 3051 20.3 3075 51.8 10c 0.21793 1.7 18.07 3.4 0.58752 3.4 0.98 2965 26.9 2993 32.1 2979 80.4 11a 0.13695 3.3 14.30 4.7 0.45064 4.7 0.95 2189 55.6 2770 43.3 2398 92.6 11b 0.14320 1.6 16.17 8.6 0.47580 8.6 0.99 2266 27.5 2887 78.8 2509 176 11c 0.18069 1.5 18.19 3.5 0.54860 3.5 0.96 2659 23.9 3000 33.0 2819 79.0 12a 0.09062 3.6 15.42 4.1 0.33203 4.1 0.57 1439 67.9 2842 38.3 1848 65.5 12b 0.12647 1.2 15.27 1.7 0.43256 1.7 0.76 2049 20.3 2832 15.8 2317 32.4 12c 0.09022 9.4 13.17 8.0 0.31563 8.0 0.78 1430 170 2692 73.0 1768 123 13a 0.12573 3.9 16.94 4.6 0.44200 4.6 0.61 2039 66.8 2931 42.7 2360 89.3 13b 0.14744 3.8 17.27 5.1 0.48892 5.1 0.65 2316 63.4 2950 48.1 2566 108 13c 0.13245 4.5 16.69 6.4 0.45527 6.4 0.78 2131 75.9 2917 59.4 2419 128 14a 0.05842 0.8 0.7476 6.4 0.08864 6.4 0.99 545.7 16.9 566.8 27.6 547.5 33.7 14b 0.05902 1.1 0.7526 2.9 0.09212 2.9 0.97 567.9 23.8 569.8 12.5 568.0 15.6 14c 0.05882 0.8 0.7486 1.5 0.09090 1.5 0.93 560.3 17.8 567.4 6.6 560.9 8.2
Note that the errors are 2σerrors. The majority of shots were taken as multiple shots on zircon grains.
which may always be a source of sample contamination. Apart from that, however, it serve as well as a precise and accurate geochronological tool. With a precision of 1.9 to 3.7% (2σSD) and an accuracy of 0.6 to 3.8% (2σSD)
3000
2600
2200
1800
1400
0.1 0.2 0.3 0.4 0.5 0.6 0.7
2 6 10 14 18 22
207
Pb/235U
2
0
6P
b
/
2
3
8U
(a)
3000
2600
2200
1800
1400
1000
0.0 0.2 0.4 0.6
0 4 8 12 16 20 24
207 Pb/235U
2
0
6 P
b
/
2
3
8 U
data-point error ellipses are 2
(b)
Upper intercepts at:
3045 +/- 24 Ma (medium grey) 3305 +/- 51 Ma (light grey) 3625 +/- 38 Ma (dark grey) All anchored at 558 Ma
LA-ICP-MS analyses
Upper intercept at 3065 +/- 12 Ma Lower intercept at 610 +/- 140 Ma
SHRIMP analyses
Fig. 6 – Comparison of (a) SHRIMP data (24 analyses from Dantas et al. unpublished data) with (b) 32 LA-ICP-MS analyses of sample EC69A. An upper intercept age of 3045±24 Ma, defined by three concordant and four discordant analyses, is within error of the SHRIMP age of 3065±12 Ma. The Discordia lines obtained by LA-ICP-MS are archored at 558 Ma. See Tables III and IV for full analyses.
ACKNOWLEDGMENTS
The LA-ICP-MS facility was installed at the Universi-dade de Brasília with funds provided by PETROBRAS and the Ministério de Minas e Energia do Brasil, which are gratefully acknowledged. Thanks go to Lance Black, Elena Belousova and Richard Armstrong for providing the zircon standards. We also thank the three anonymous journal referees for valuable and clarifying comments and suggestions.
RESUMO
A determinação de idades através do decaimento dos isóto-pos radioativos 235U e 238U para os isótopos radiogênicos
207Pb e206Pb, respectivamente, utilizando o mineral zircão
(ZrSiO4), é amplamente aplicada para decifrar processos
geo-lógicos. Um novo método tem sido desenvolvido nos últimos anos, a ablação alasermulti-coletor espectrometria de massas com plasma indutivamente acoplado (LA-MC-ICP-MS), su-perando o laborioso trabalho anteriormente necessário em ou-tros métodos, na preparação de amostras, e permite obtenção de razões isotópicas com alta resolução espacial de micrôme-tros. O presente estudo descreve os procedimentos analíticos e os métodos usados na redução de dados que estão sendo apli-cados no Laboratório de Geocronologia da Universidade de Brasília. Explora-se a precisão e exatidão do método através da análise de três padrões internacionais de zircão. Observa-se uma precisão entre 1,9 a 3,7% (2σ desvio padrão) e uma
exatidão de 0,6 a 3,8% (2σ desvio padrão) para as razões
isotópicas de Pb e U dos padrões. Também foram obtidas idades pelo método LA-ICP-MS de duas amostras de zircões naturais, que já foram datadas anteriormente por outros méto-dos analíticos. A comparação méto-dos resultaméto-dos mostra uma boa conformidade das idades obtidas, dentro dos limites de erro. Os dados demonstram o grande potencial do método analítico para análises isotópicas rápidas, precisas e exatas de U-Pb, numa escala de micrômetros.
Palavras-chave:geocronologia, isótopos U-Pb, LA-MC-ICP-MS, zircão, datação.
REFERENCES
ALBARÈDE F, TELOUK P, BLICHERT-TOFT J, BOYET
M, AGRANIERAANDNELSONB. 2004. Precise and
accurate isotopic measurements using multiple-collector ICPMS. Geochim Cosmochim Acta 68: 2725–2744. AMELINYANDDAVISWJ. 2006. Isotope analysis of lead
in sub-nanogram quantities by TIMS using a202Pb-205Pb spike. J Anal Atom Spectrom 21: 1053–1061.
ANDERSEN T. 2002. Correction of common lead in U-Pb analyses that do no report204Pb. Chem Geol 192: 59–79. BERNALJP, EGGINSSMANDMCCULLOCHMT. 2005.
Ac-curatein situ238U-234U-232Th-230Th analysis of silicate glasses and iron oxides by laser-ablation MC-ICP-MS. J Anal Atom Spectrom 20: 1240–1249.
geochronology by the monitoring of a trace-element-re-lated matrix effect: SHRIMP, ID-TIMS, ELA-ICP-MS and oxygen isotope documentation for a series of zircon standards. Chem Geol 205: 115–140.
BRUGUIER O, TÉLOUK P, COCHERIE A, FOUILLAC AM
ANDALBARÈDEF. 2001. Evaluation of Pb-Pb and U-Pb
laser ablation ICP-MS zircon dating using matrix-matched calibration samples with a frequency quadrupled (266 nm) Nd-YAG laser. Geostandard Newslett 25: 361–373. CHANG Z, VERVOORT JD, MCCLELLAND WC AND
KNAACKC. 2006. U-Pb dating of zircon by LA-ICP-MS. Geochem Geophy Geosy 7, Doi:10.1029/2005GC001100. COCHERIEA, ROSSI P, FANNINGCMANDGUERROT C. 2005. Comparative use of TIMS and SHRIMP for U-Pb zircon dating of A-type granites and mafic tholeiitic layered complexes and dykes from the Corsian Batholith (France). Lithos 82: 185–219.
DANTAS EL, VAN SCHMUS WR, HACKSPACHER PC,
BRITO NEVES BB AND CORDANI UG. 2004. The 3.4–3.5 Ga São Jose do Campestre Massif, NE Brazil. Remmants of the oldest crust in South America. Precam-brian Res 130: 113–137.
FENGR, MACHADONANDLUDDENJ. 1993. Lead geo-chronology of zircon by Laser-Probe-inductively coupled plasma mass spectrometry (LP-ICPMS). Geochim Cos-mochim Acta 57: 3479–3486.
GARBE-SCHÖNBERGCDANDARPET. 1997.
High-resolu-tion ICPMS in fast scanning mode: applicaHigh-resolu-tion for laser ablation analysis of zircon. Fresen J Anal Chem 359: 462– 464.
GERDESAANDZEHA. 2006. Combined U-Pb and Hf iso-tope LA-(MC-)ICP-MS analyses of detrital zircons: Com-parison with SHRIMP and new constraints for the prove-nance and age of an Armorican metasediment in Central Germany. Earth Planet Sc Lett 249: 47–61.
GÜNTHERD, HORNIANDHATTENDORFB. 2000. Recent
trends and developments in laser ablation ICP mass spec-trometry. Fresen J Anal Chem 368: 4–14.
HEAMANLANDPARRISHR. 1991. U-Pb geochronology of accessory minerals. In: HEAMANLANDLUDDENJN (Eds.) Short course handbook on applications on isotope systems to problems in geology. Mineral Ass Canada, Toronto, p. 59–102.
HIRATATANDNESBITTRW. 1995. U-Pb isotope
geochro-nology of zircon: evaluation of the laser probe – induc-tively coupled plasma mass spectrometry technique. Geo-chim CosmoGeo-chim Acta 59: 2491–2500.
HORNI, RUDNICKRLANDMCDONOUGHWF. 2000. Pre-cise elemental and isotope ratio determination by sim-ultaneous solution nebulization and laser ablation-ICP-MS: application to U-Pb geochronology. Chem Geol 164: 281–301.
HORSTWOODMSA, FOSTERGL, PARRISHRR, NOBLESR ANDNOWELLGM. 2003. Common-Pb correctedin situ U-Pb accessory mineral geochronology by LA-MC-ICP-MS. J Anal Atom Spectrom 18: 837–846.
JACKSON SE, PEARSON NJ, GRIFFIN WLAND BELOU
-SOVAEA. 2004. The application of laser ablation induc-tively coupled plasma mass spectrometry toin situU-Pb zircon geochronology. Chem Geol 211: 47–69.
KOŠLERJANDSYLVESTERP. 2003. Present trends and the future of zircon in geochronology: laser ablation ICPMS. Rev Mineral Geochem 53: 243–275.
KOŠLER J, FONNELAND H, SYLVESTER P, TUBRETT M ANDPEDERSENRB. 2002. U-Pb dating of detrital
zir-cons for sediment provenance studies – a comparison of laser ablation ICMPS and SIMS techniques. Chem Geol 182: 605–618.
KRYMSKYRS, MACABIRAMJB, LAFONJMANDESTU
-MANO GS. 2007. Uranium-lead dating method at the Pará-Iso isotope geology laboratory, UFPA, Belém – Brazil. An Acad Bras Cienc 79: 115–128.
LAUXJH, PIMENTELMM, DANTAS EL, ARMSTRONGR ANDJUNGESSL. 2005. Two Neoproterozoic crustal
ac-cretion events in the Brasília belt, central Brazil. J S Am Earth Sci 18: 183–198.
LUDWIGKR. 2003. Isoplot 3.00: A geochronological toolkit for Microsoft Excel. Berkeley Geochronological Center, Spec Publ No. 4, 70 pp.
MATTINSONJM. 2005. Zircon U-Pb chemical abrasion (“CA-TIMS”) method: Combined annealing and multi-step par-tial dissolution analysis for improved precision and accu-racy of zircon ages. Chem Geol 220: 47–66.
MEZGERKANDKROGSTADEJ. 1997. Interpretation of
dis-cordant U-Pb zircon ages: An evaluation. J Metamorph Geol 15: 127–140.
NEBEL-JACOBSEN Y, SCHERER EE, MÜNKER C AND
MEZGERK. 2005. Separation of U, Pb, Lu, and Hf from single zircons for combined U-Pb dating and Hf isotope measurements by TIMS and MC-ICPMS. Chem Geol 220: 105–120.
PACESJBANDMILLERJD. 1993. Precise U-Pb ages of
pet-rogenetic, paleomagnetic and tectonomagmatic process associated with the 1.1 Ga midcontinental system. J Geo-phys Res 98: 13997–14013.
PAQUETTE JL AND TIEPOLO M. 2007. High resolution
(5µm)U-Th-Pb isotope dating of monazite with excimer
laser ablation (ELA)-ICPMS. Chem Geol 240: 222–237. PARRISHRRANDNOBLESR. 2003. Zircon U-Th-Pb geo-chronology by Isotope Dilution – Thermal Ionization Mass Spectrometry (ID-TIMS). Rev Mineral Geochem 53: 183–213.
PETTKET, HALTERWE, WEBSTERJD, AIGNER-TORRES
M ANDHEINRICH CA. 2004. Accurate quantification of melt inclusion chemistry by LA-ICPMS: a comparison with EMP and SIMS and advantages and possible limita-tions of these methods. Lithos 78: 333–361.
SHANNONRD. 1976. Revised effective ionic radii and sys-tematic studies of interatomic distances in halides and chalcogenides. Acta Cystallogr A32: 751–767.
SIMONJI, REIDMRANDYOUNGED. 2007. Lead isotopes
by LA-MC-ICPMS: Tracking the emergence of mantle signatures in an evolving silicic magma system. Geochim Cosmochim Acta 71: 2014–2035.
SIMONETTIA, HEAMAN LM, HARTLAUB RP, CREASER
RA, MACHATTIETGANDBOHMC. 2005. U-Pb zircon dating by laser ablation MC-ICP-MS using a new mul-tiple ion counting Faraday collector array. J Anal Atom Spectrom J 20: 677–686.
SIMONETTIA, HEAMANLM, CHACKOTANDBANERJEE
NR. 2006. In situpetrographic thin section U-Pb dating of zircon, monazite, and titanite using laser ablation MC-ICP-MS. Int J Mass Spectrom 253: 87–97.
STACEY JS AND KRAMERSJD. 1975. Approximation of terrestrial lead isotope evolution by a two-stage model. Earth Planet Sc Lett 26: 207–221.
STIRLING CH, LEEDC, CHRISTENSENJN ANDHALLI -DAYNA. 2000. High-precisionin situ238U-234U-230Th isotopic analysis using laser ablation multiple collector ICPMS. Geochim Cosmochim Acta 64: 3737–3750. VANHAECKEFANDMOENSL. 1999. Recent trends in trace
element determination and speciation using inductively coupled plasma mass spectrometry. Fresen J Anal Chem 364: 440–451.
WILLIGERSBJA, BAKER JA, KROGSTAD EJANDPEATE