R. Bras. Zootec., 47:e20160325, 2018
https://doi.org/10.1590/rbz4720160325
© 2018 Sociedade Brasileira de Zootecnia ISSN 1806-9290
www.sbz.org.br
Received: November 2, 2016 Accepted: May 24, 2018
*Corresponding author: danielcampelo.agro@gmail.com
Copyright © 2018 Sociedade Brasileira de Zootecnia. This is an Open Access article distributed under the terms of the Creative Commons Attribution License (http://creativecommons.org/licenses/by/4.0/), which permits unrestricted use, distribution, and reproduction in any medium, provided the original work is properly cited.
Aquaculture
Dietary lysine requirement of adult lambari (
Astyanax altiparanae
)
(Garutti and Britski, 2000)
Daniel Abreu Vasconcelos Campelo
1*, Ana Lúcia Salaro
2, André Luis Fialho Ladeira
3,
Lorena Batista de Moura
1, Wilson Massamitu Furuya
41 Universidade Estadual de Maringá, Programa de Pós-graduação em Zootecnia, Maringá, PR, Brasil. 2 Universidade Federal de Viçosa, Departamento de Biologia Animal, Viçosa, MG, Brasil.
3 Universidade Federal de Viçosa, Programa de Pós-graduação em Biologia Animal, Viçosa, MG, Brasil. 4 Universidade Estadual de Ponta Grossa, Departamento de Zootecnia, Ponta Grossa, PR, Brasil.
ABSTRACT - A 90-day feeding trial was conducted to estimate the dietary lysine requirement of adult lambari (Astyanax altiparanae), based on growth performance, whole-body composition, muscle development, and aspartate aminotransferase (AST) and alanine aminotransferase (ALT) activities. Six isoproteic (345.0 g kg−1) and isoenergetic (19.51 MJ kg−1) diets were formulated, and crystalline L-lysine was added to obtain diets with lysine concentrations of 12.13, 13.31, 15.36, 18.79, 19.92, and 23.02 g kg−1 dry diet. Female adult lambari (n = 480; weight of 4.96±0.02 g) were distributed into 24 (70 L) aquaria and fed
the experimental diets six times daily. Fish fed 12.13 to 19.92 g kg−1 lysine showed increased weight gain and percent weight
gain, and fish from those treatments also showed improvement in final carcass quality by a decrease in whole-body lipid content. Fish fed 12.13 g kg−1 lysine showed lower ALT and AST activities in blood serum when compared with fish fed the highest lysine
levels. No differences were observed in muscle growth in fish fed graded lysine levels. According to the broken-line model analysis of weight gain and dietary lysine levels, the dietary lysine requirement of adult lambari is estimated at 18.72 g kg−1
(5.41% of dietary protein).
Key Words: aminoacid, carcass quality, fish nutrition, lysine, nutritional requirement
Introduction
Protein is a major and the most expensive component
of formulated aquafeeds (Wilson, 2002; NRC, 2011). To
maximize dietary protein utilization, the amino acid profile
must meet dietary requirements (Khan and Abidi, 2011)
according to fish species and growth stage (Peres and
Oliva-Teles, 2008). Lysine is the first-limiting essential
amino acid in plant protein sources commonly used in fish
diets (El-Sayed, 1999; Cao et al., 2012), especially in corn
and corn byproduct ingredients. In addition, it is found in
high concentrations in the whole body of many fish species
(Kim and Lall, 2000; Michelato et al., 2016).
In aquaculture, environmental concerns have also
stimulated the search for nutritional strategies to improve
nitrogen use, minimizing its excretion into the environment.
Excessive nitrogen in fish farm effluents stimulates
eutrophication of water bodies and reduces water quality.
Thus, the manipulation of feed formulation through the
estimation of essential amino acid requirements must be
considered, not only to maximize the efficiency of protein
utilization but also to reduce nitrogenous waste (Talbot and
Hole, 1994; Cho and Bureau, 1997).
Lambari,
Astyanax altiparanae
, was recently
established as an aquaculture species in Latin America.
This fish is produced for food purposes and used as
live bait; moreover, it has potential to be marketed as a
canned product (Dutra et al., 2012). Its small size, high
reproductive rate and fry production without hormonal
induction (Porto-Foresti et al., 2010) allows its use as
an experimental model for other large-sized species
(Gonçalves et al. 2014). Females grow faster than males,
with slaughter weight of 5 to 10 g.
A few studies have estimated the dietary requirements
for lambaris: the crude protein requirement is about 320
to 380 g kg
−1(Cotan et al., 2006), and the dietary essential
amino acid requirement was estimated based on the
whole-body composition and the ideal protein concept (Abimorad
and Castellani, 2011; Furuya et al., 2015). However,
dose-response feeding assays have not been published to
date. Therefore, the objective of this study was to estimate
the dietary lysine requirement for female adult lambari
based on the dose-response model, by evaluating the
growth performance, whole-body composition, muscle
development, and aspartate aminotransferase (AST) and
alanine aminotransferase (ALT) activities.
Material and Methods
This experiment was approved by the local Ethics
Committee for Animal Use (Protocol nº 18/2013) and was
performed in Viçosa, Minas Gerais, Brazil (20°45'20" S
latitude, 42°52'40" W longitude, and 649 m altitude,).
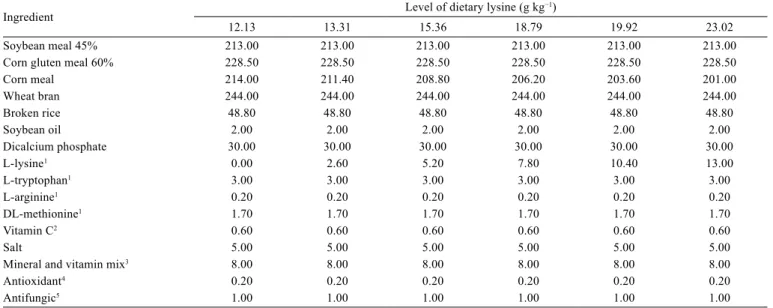
Six isoproteic (345.0 g kg
−1) and isoenergetic
(19.51 MJ kg
−1) experimental diets were formulated,
with graded levels of crystalline L-lysine HCl based on
corn gluten meal and soybean meal as protein ingredients
(Table 1). The final levels of dietary lysine confirmed
by amino acid analysis were: 12.13, 13.31, 15.36, 18.79,
19.92, and 23.02 g kg
−1of dry diet (Table 2). Macro
ingredients were ground in a hammer mill (TRF-400
Trapp, Jaraguá do Sul, SC, Brazil) with 0.5-mm screens;
all ingredients were mixed in a “V” mixer (MA200,
Marconi, Piracicaba, SP, Brazil); the diets were extruded
with a 3-mm Ex-Micro
®extruder (ExTeec Company,
Ribeirão Preto, SP, Brazil), and then dried for 12 h by
oven-drying at 45 °C.
A completely randomized design with six treatments
and four replicates was used. Female adult lambari weighing
4.96±0.02 g (mean weight ± SD) were weighed on a
precision scale (model MB45 Toledo
®0.01 g, São Bernardo
do Campo, SP, Brazil) and randomly distributed into 24
fiberglass aquaria (70 L of water) at 20 fish per aquarium.
The aquaria were maintained in a recirculation system
(2 to 3 L min
−1) with a mechanical and biological filter and
covered with nylon nets to prevent fish from escaping.
Throughout the experimental period, water temperature
was maintained at 27±1 °C by using a digital thermostat
(Coel Tlj29, São Paulo, SP, Brazil). The other water
parameters were measured with a multi-parameter meter
(model HI 9828, Hanna Instruments, Barueri, SP, Brazil);
average dissolved oxygen was 6.50±1.00 mg L
−1, pH was
7.30±0.50, and total ammonia was 0.02±0.00 mg L
−1. The
photoperiod was adjusted to 12 h by fluorescent lamps
(60 W). The fish were hand-fed to apparent satiation, six
times daily (8:00, 10:00, 12:00, 14:00, 16:00, and 18:00 h)
for 90 days.
At the end of the experimental period, after 24 h of
starvation, all fish from each aquarium were counted and
weighed to evaluate growth performance data, survival
rate, weight gain, percent weight gain, feed efficiency, and
protein efficiency rate and euthanized with a lethal dose
of anesthetic (400 mg clove oil L
−1). Whole body, carcass,
gonads, viscera, and liver weights were recorded to
determine carcass yield and gonadosomatic, viscerosomatic,
Table 1 - Formulations of the experimental diets
Ingredient Level of dietary lysine (g kg
−1)
12.13 13.31 15.36 18.79 19.92 23.02
Soybean meal 45% 213.00 213.00 213.00 213.00 213.00 213.00
Corn gluten meal 60% 228.50 228.50 228.50 228.50 228.50 228.50
Corn meal 214.00 211.40 208.80 206.20 203.60 201.00
Wheat bran 244.00 244.00 244.00 244.00 244.00 244.00
Broken rice 48.80 48.80 48.80 48.80 48.80 48.80
Soybean oil 2.00 2.00 2.00 2.00 2.00 2.00
Dicalcium phosphate 30.00 30.00 30.00 30.00 30.00 30.00
L-lysine1 0.00 2.60 5.20 7.80 10.40 13.00
L-tryptophan1 3.00 3.00 3.00 3.00 3.00 3.00
L-arginine1 0.20 0.20 0.20 0.20 0.20 0.20
DL-methionine1 1.70 1.70 1.70 1.70 1.70 1.70
Vitamin C2 0.60 0.60 0.60 0.60 0.60 0.60
Salt 5.00 5.00 5.00 5.00 5.00 5.00
Mineral and vitamin mix3 8.00 8.00 8.00 8.00 8.00 8.00
Antioxidant4 0.20 0.20 0.20 0.20 0.20 0.20
Antifungic5 1.00 1.00 1.00 1.00 1.00 1.00
1 L-lysine, L-tryptophan, L-arginine (Ajinomoto, São Paulo, SP, Brazil); DL-methionine (MCassab, São Paulo, SP, Brazil). 2 Vitamin C (Saint Charbel, Viçosa, MG, Brazil).
3 Assurance levels per kilogram of product: vitamin A, 1,200,000 IU; vitamin D3, 200,000 IU; vitamin E, 12,000 mg; vitamin K3, 2,400 mg; vitamin B1, 4,800 mg; vitamin B2,
4,800 mg; vitamin B6, 4,000 mg; vitamin B12, 4,800 mg; folic acid, 1,200 mg; calcium pantothenate, 12,000 mg; vitamin C, 48,000 mg; biotin, 48 mg; choline, 65,000 mg; niacin, 24,000 mg; Fe, 10,000 mg; Cu, 6,000 mg; Mg, 4,000 mg; Zn, 6,000 mg; I, 20 mg; Co, 2 mg; Se, 20 mg (Guabi Animal Nutrition, Brazil).
4 Butylated hydroxytoluene (BHT) (ISOFAR Ind., Brazil).
and hepatosomatic index. The viscerosomatic index included
weights of stomach, intestine, pyloric cecum, gonads,
heart, liver, gallbladder, and swim bladder. The carcass
was defined as the fish without scales and viscera. Protein
productive value was also determined from the crude
protein value of the animal.
For whole-body composition analysis, fish were
previously lyophilized (Labconco, Kansas City, MO, USA)
and ground in a ball mill (Marconi MA923, Piracicaba, SP,
Brazil). Crude protein (N% × 6.25) was determined by the
Kjeldahl method (Quimis, Diadema, SP, Brazil), total lipids
were determined by ether extraction in a Soxtherm 2000
extractor (Gerhardt, New Orleans, LA, USA), and mineral
matter was determined by combusting dry samples in a
muffle furnace (TE-1100-1P, Tecnal, Piracicaba, SP, Brazil)
at 550 °C for 6 h, in accordance with the Association of
Official Analytical Chemists (AOAC, 1995). Gross energy
content was determined by adiabatic bomb calorimetry
(Parr 1266, Parr Instruments Co., Moline, IL, USA). All
analyses were performed in triplicate.
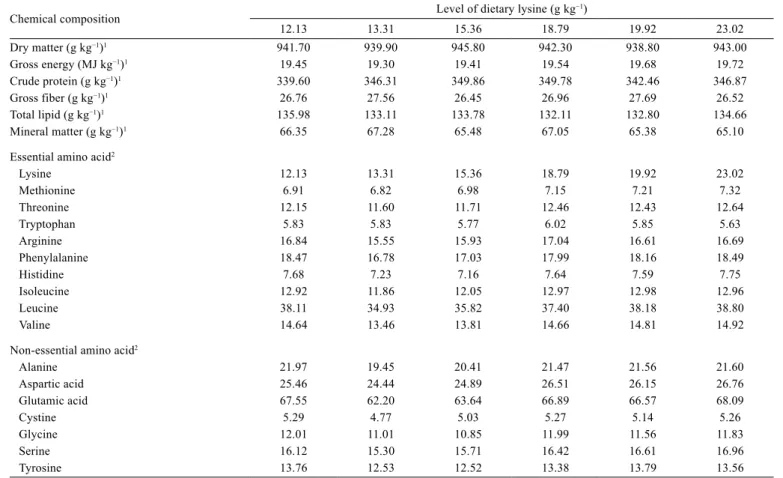
The amino acid profiles of experimental diets were
analyzed by Ajinomoto do Brasil Indústria e Comércio de
Alimentos – Animal Nutrition Division (São Paulo, Brazil)
by hydrolyzing 0.3 mg of sample in 1 mL of 6N HCl for
22 h. The obtained sample was diluted in 0.02N HCl and
injected into an automatic amino acid analyzer (Hitachi
L-888, Tokyo, Japan). Hydrolysis recovery was performed
in 4N methanesulfonic acid for analysis of tryptophan and
in performic acid for sulfur amino acids.
For muscle fiber frequency analysis, white muscle
samples were collected from the epaxial region of
eight fish from each treatment, fixed in 10% buffered
formaldehyde solution for 24 h and transferred to 70%
alcohol. Subsequently, muscles were dehydrated in
an increasing ethanol series and embedded in glycol
methacrylate (Historesin
®, Leica, São Paulo, SP, Brazil).
Transverse 3 μm fiber sections were obtained with a
microtome and stained with toluidine blue. These fiber
cross-sections were photo-documented under a light
microscope (Olympus
®BX53, São Paulo, SP, Brazil)
with an attached camera (Olympus
®DP73, São Paulo, SP,
Brazil). Fiber cross-section diameter (μm) was estimated
by measuring 200 white muscle fibers from each animal
per group, using the smallest diameter method (Dubowitz
and Brooke, 1973). White muscle fibers were grouped into
three diameter classes (<20, 20-50, and >50 μm) (Almeida
Table 2 - Chemical composition and amino acid profiles (g kg−1) of the experimental diets, based on dry matter
Chemical composition Level of dietary lysine (g kg−1)
12.13 13.31 15.36 18.79 19.92 23.02
Dry matter (g kg−1)1 941.70 939.90 945.80 942.30 938.80 943.00
Gross energy (MJ kg−1)1 19.45 19.30 19.41 19.54 19.68 19.72
Crude protein (g kg−1)1 339.60 346.31 349.86 349.78 342.46 346.87
Gross fiber (g kg−1)1 26.76 27.56 26.45 26.96 27.69 26.52
Total lipid (g kg−1)1 135.98 133.11 133.78 132.11 132.80 134.66
Mineral matter (g kg−1)1 66.35 67.28 65.48 67.05 65.38 65.10
Essential amino acid2
Lysine 12.13 13.31 15.36 18.79 19.92 23.02
Methionine 6.91 6.82 6.98 7.15 7.21 7.32
Threonine 12.15 11.60 11.71 12.46 12.43 12.64
Tryptophan 5.83 5.83 5.77 6.02 5.85 5.63
Arginine 16.84 15.55 15.93 17.04 16.61 16.69
Phenylalanine 18.47 16.78 17.03 17.99 18.16 18.49
Histidine 7.68 7.23 7.16 7.64 7.59 7.75
Isoleucine 12.92 11.86 12.05 12.97 12.98 12.96
Leucine 38.11 34.93 35.82 37.40 38.18 38.80
Valine 14.64 13.46 13.81 14.66 14.81 14.92
Non-essential amino acid2
Alanine 21.97 19.45 20.41 21.47 21.56 21.60
Aspartic acid 25.46 24.44 24.89 26.51 26.15 26.76
Glutamic acid 67.55 62.20 63.64 66.89 66.57 68.09
Cystine 5.29 4.77 5.03 5.27 5.14 5.26
Glycine 12.01 11.01 10.85 11.99 11.56 11.83
Serine 16.12 15.30 15.71 16.42 16.61 16.96
Tyrosine 13.76 12.53 12.52 13.38 13.79 13.56
et al., 2008). Muscle fiber frequency was expressed as the
number of fibers from each diameter class relative to the
total number of fibers measured.
For enzymatic activity analysis, blood was collected
with a hypodermic syringe from the caudal vein. One
milliliter of serum was separated by centrifugation
(10,000 rpm for 15 min at 4 °C) and stored at −80 °C. Aspartate
aminotransferase and ALT activities in serum were
measured by using diagnostic reagent kits purchased from
Bioclin
®(Quibasa - Química Básica, Belo Horizonte, MG,
Brazil) according to the manufacturer’s instructions, in an
automatic biochemical analyzer (Alizè, Lisabio, France).
All analyses were performed in duplicate.
Statistical analysis of the data was subjected to the
Lilliefors test, to verify the normality of errors, and to
the Bartlett test, to verify the homogeneity of variances.
Afterwards, one-way analysis of variance (ANOVA) at 5%
significance was performed. The optimum dietary lysine
requirements were estimated with a broken-line model
(Y = a + bx) or second-order polynomial model (Y = ax
2+
bx + c); depending on the sum of squares about regression
(SSR) and coefficient of determination (R
2) for the two
models, the one with the smaller values of SSR and higher
R
2was chosen as the best fitting model. All statistical
analyses were performed with SPSS (SPSS Inc., Chicago,
IL, USA, version 23.0).
Results
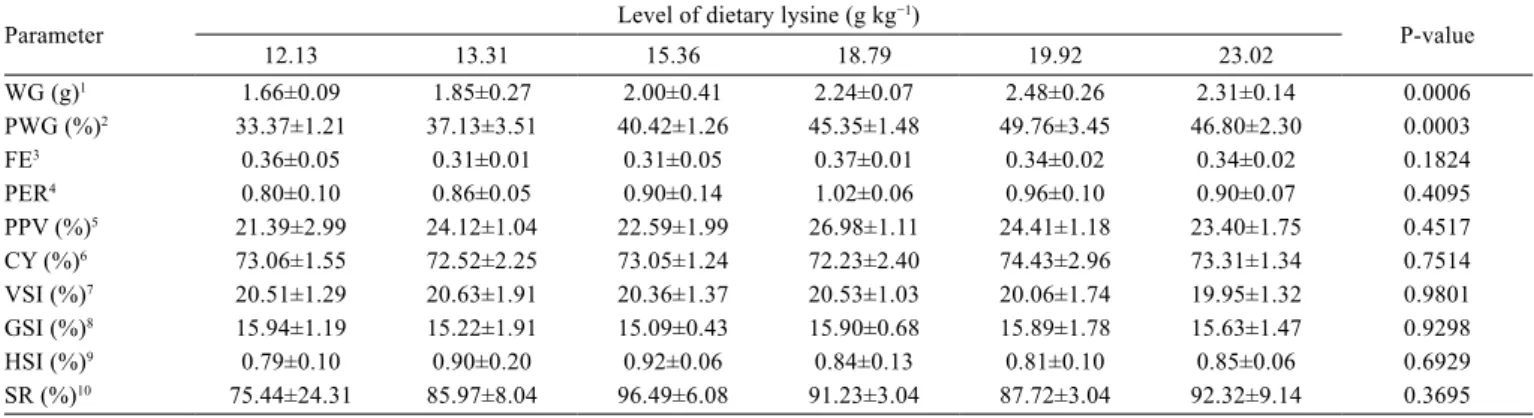
Survival, feed efficiency, and carcass yield as well
as viscerosomatic, gonadosomatic, and hepatosomatic
index of adult lambari were unaffected by the dietary
lysine levels (P>0.05). The same was observed for protein
efficiency ratio and protein productive value (Table 3).
No specific external signs or pathological symptoms were
observed during the experimental period.
The lysine levels influenced (P<0.05) weight gain
and percent weight gain of fish (Table 3). The R
2values
for weight gain were 0.97 and 0.65 for broken-line and
second-order polynomial models, respectively. Similarly,
for percent weight gain, these values were 0.98 and 0.67
for broken-line and second-order polynomial models,
respectively. The SSR for weight gain and percent weight
gain was also better for broken-line model. Based on the
calculated R
2and SSR, the broken-line model with the best
fit in the two cases was chosen. According to broken-line
regression analysis on weight gain (Y = 0.561 + 0.093x)
(Figure 1) and percent weight gain (Y = 11.062 + 1.897x),
Table 3 - Growth performance of finishing lambari (Astyanax altiparanae) fed diets containing levels of dietary lysine
Parameter Level of dietary lysine (g kg
−1)
P-value
12.13 13.31 15.36 18.79 19.92 23.02
WG (g)1 1.66±0.09 1.85±0.27 2.00±0.41 2.24±0.07 2.48±0.26 2.31±0.14 0.0006
PWG (%)2 33.37±1.21 37.13±3.51 40.42±1.26 45.35±1.48 49.76±3.45 46.80±2.30 0.0003
FE3 0.36±0.05 0.31±0.01 0.31±0.05 0.37±0.01 0.34±0.02 0.34±0.02 0.1824
PER4 0.80±0.10 0.86±0.05 0.90±0.14 1.02±0.06 0.96±0.10 0.90±0.07 0.4095
PPV (%)5 21.39±2.99 24.12±1.04 22.59±1.99 26.98±1.11 24.41±1.18 23.40±1.75 0.4517
CY (%)6 73.06±1.55 72.52±2.25 73.05±1.24 72.23±2.40 74.43±2.96 73.31±1.34 0.7514
VSI (%)7 20.51±1.29 20.63±1.91 20.36±1.37 20.53±1.03 20.06±1.74 19.95±1.32 0.9801
GSI (%)8 15.94±1.19 15.22±1.91 15.09±0.43 15.90±0.68 15.89±1.78 15.63±1.47 0.9298
HSI (%)9 0.79±0.10 0.90±0.20 0.92±0.06 0.84±0.13 0.81±0.10 0.85±0.06 0.6929
SR (%)10 75.44±24.31 85.97±8.04 96.49±6.08 91.23±3.04 87.72±3.04 92.32±9.14 0.3695 Values are presented as mean±SD (n = 4).
1 Weight gain = Final mean biomass − Initial mean biomass.
2 Percent weight gain = (Final weight − Initial weight)/Initial weight × 100.
3 Feed efficiency = Wet weight gain/Dry feed intake. 4 Protein efficiency ratio = Wet weight gain/Dry protein intake. 5 Protein productive value = Fish protein gain/Dry protein intake × 100.
6 Carcass yield = Eviscerated fish weight/Whole fish weight × 100. 7 Viscerosomatic index = Viscera weight/Whole body weight × 100. 8 Gonadosomatic index = Gonad weight/Whole body weight × 100.
9 Hepatosomatic index = Liver weight/Whole body weight × 100.
10 Survival rate = Final number of fish/Initial number of fish × 100.
Figure 1 - Optimal dietary lysine requirement of finishing lambari (Astyanax altiparanae) based on broken-line model of weight gain versus dietary lysine level.
1.0 1.2 1.4 1.6 1.8 2.0 2.2 2.4 2.6 2.8 3.0
10 12 14
Dietary lysine level (g kg−1)
16 18 20 22 24 26 28 30
Weight gain (g) 18.72 g kg-1(5.41% of dietary protein)
the optimum dietary lysine levels were estimated at
18.72 g kg
−1(5.41% of crude protein) and 18.83 g kg
−1(5.44% of dietary protein), respectively.
The lysine intake of 1.89 mg day
−1per animal was the
amount required for maximum weight gain (Y = −0.4898x
2+ 1.8749x + 0.627; R
2= 0.67) of adult lambari.
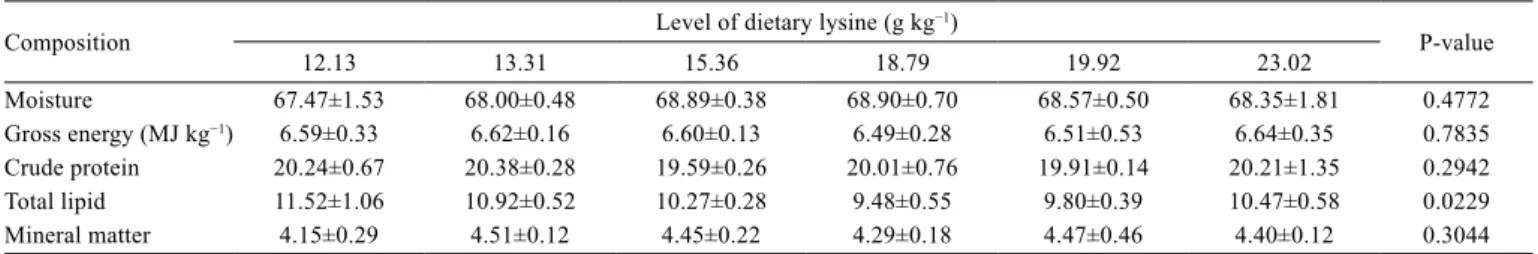
Whole-body moisture, crude protein, mineral matter, and
gross energy content were not affected by the dietary lysine
level (P>0.05) (Table 4). A quadratic relationship between
dietary lysine level and whole-body total lipid content was
observed (Y = 0.0437272x
2– 1.63695x + 24.9696; R
2= 0.61),
and the optimum dietary lysine level was estimated at
18.76 g kg
−1dry diet (5.42% of dietary protein).
Adult lambari had muscle fibers distributed in the
three classes of diameters established. Dietary lysine level
did not influence (P>0.05) fiber frequency in any of the
three classes of diameters established (Table 5).
Serum activities of AST and ALT of adult lambari were
influenced (P<0.05) by dietary lysine levels. According to
broken-line regression analysis, fish fed 15.23 g kg
−1lysine
of dry diet had higher AST values (Y = −273.486 + 51.697x;
R
2= 0.79), and the highest activities of ALT (Y = −20.513
+ 3.730x; R
2= 0.86) were estimated in fish fed 21.77 g kg
−1lysine of dry diet. Fish fed 12.13 g kg
−1lysine of dry diet
had the lowest concentrations of AST and ALT (Table 6).
Discussion
Weight gain and percent weight gain was affected
by the supplementation of dietary lysine. Based on these
parameters, the requirements of dietary lysine for adult
lambari were estimated at 18.72 g kg
−1(5.41% of dietary
protein) and 18.83 g kg
−1(5.44% of dietary protein),
respectively. Based on the requirements of dietary lysine
as a percentage of dietary protein, the values found in this
study are within the expected range for other fish species,
from 3.32 to 6.61% of dietary protein (Wilson, 2003), as
well as for most species described in the NRC (2011). A
higher dietary lysine requirement of 5.86% of dietary
protein was estimated for adult lambari, based on the
muscle amino acid composition and essential amino acid
requirements of other omnivorous fish species (Abimorad
and Castellani, 2011). Furuya et al. (2015) determined
that the dietary lysine requirement for another species
of adult lambari (
Astyanax fasciatus
) was 5.46% of the
dietary protein. This represents the mean dietary lysine
Table 6 - Aspartate aminotransferase (AST) and alanine aminotransferase (ALT) activities in serum (U L−1) of finishing lambari (Astyanax
altiparanae) fed diets containing levels of dietary lysine
Enzyme Level of dietary lysine (g kg
−1)
P-value
12.13 13.31 15.36 18.79 19.92 23.02
AST 374.33±62.13 382.00±41.15 532.50±53.03 525.33±41.36 501.00±46.49 513.00±12.73 0.0008
ALT 25.00±9.85 29.33±13.87 35.33±1.53 52.67±6.11 51.67±4.16 60.67±4.62 0.0003
Valuesare presented as mean±SD (n = 4).
Table 4 - Whole-body composition (% wet matter) of finishing lambari (Astyanax altiparanae) fed diets containing levels of dietary lysine
Composition Level of dietary lysine (g kg−1) P-value
12.13 13.31 15.36 18.79 19.92 23.02
Moisture 67.47±1.53 68.00±0.48 68.89±0.38 68.90±0.70 68.57±0.50 68.35±1.81 0.4772
Gross energy (MJ kg−1) 6.59±0.33 6.62±0.16 6.60±0.13 6.49±0.28 6.51±0.53 6.64±0.35 0.7835
Crude protein 20.24±0.67 20.38±0.28 19.59±0.26 20.01±0.76 19.91±0.14 20.21±1.35 0.2942
Total lipid 11.52±1.06 10.92±0.52 10.27±0.28 9.48±0.55 9.80±0.39 10.47±0.58 0.0229
Mineral matter 4.15±0.29 4.51±0.12 4.45±0.22 4.29±0.18 4.47±0.46 4.40±0.12 0.3044
Values are presented as mean±SD (n = 4).
Table 5 - Muscle fiber frequency into three diameter classes (<20, 20-50, and >50 μm) of finishing lambari (Astyanax altiparanae) fed diets containing levels of dietary lysine
Diameter (μm) Level of dietary lysine (g kg−1) P-value
12.13 13.31 15.36 18.79 19.92 23.02
<20 0.69±1.00 0.50±0.53 0.17±0.26 1.13±0.86 0.75±1.25 0.44±0.61 0.4720
20-50 34.00±11.83 28.71±9.70 28.58±10.08 29.50±12.34 27.69±9.43 26.76±6.90 0.8179 >50 65.31±12.47 70.79±9.92 71.33±10.27 69.38±13.65 71.56±11.29 73.00±6.26 0.8234
Values are presented as mean±SD (n = 4).
requirement value of common carp (
Cyprinus carpio
),
grass carp (
Ctenopharyngodon idella
), and Nile tilapia
(
Oreochromis niloticus
), as reported by the NRC (2011),
and is similar to the requirement estimated for adult
lambari in this study. Methods to determine amino acid
requirements based on whole-body amino acid composition
and amino acid requirements of other fish species are
used as guidelines for establishing indispensable amino
acid patterns to formulate diets for fish species whose
dietary essential amino acid requirements are unknown
(Tibaldi and Kaushik, 2005). However, dose-response
experiments with an increasing supply of amino acid is the
most accepted method for determining dietary amino acid
requirements (Cowey, 1995; Zhou et al., 2010).
There are few studies that estimate the dietary
requirements for adult fish, because most adult fish species
produced have a high final weight and conducting
dose-response experiments with large fish is difficult and costly.
Therefore, research with lambari can be advantageous
because, due to its small size, lambari can be used as a
model for studies of larger fish species (Gonçalves et al.,
2014). In the present study, it was possible to determine
the dietary lysine requirement for adult fish in the
stationary growth rate phase, when growth performance
is lower compared to fish in the fast growth rate phase.
Adult lambari fed diets containing levels of dietary lysine
presented the optimum percent weight gain estimated at
46.48%. Medium-sized Atlantic salmon (
Salmo salar
),
with an average initial weight of 376.16±46.33 g, presented
a percent weight gain of 18.18% for fish fed the lower
dietary lysine level (5.9 g kg
−1) and 60.80% for fish fed the
higher level (26.0 g kg
−1) (Berge et al., 1998). Similarly,
finishing Nile tilapia with an initial weight of 117.90±0.67 g
and fed increasing dietary lysine levels presented an average
percent weight gain of 66.17% (Furuya et al., 2004). In
another dietary lysine requirement experiment for adult
Nile tilapia with an initial weight of 274.89±1.90 g,
conducted in an outdoor net cage system and with low
stocking density, the average percent weight gain was
101.11% (Michelato et al., 2016). Animals in the finishing
phase or adults close to reaching their maximum size do
not have the high growth rates of the younger stages.
The lysine requirement varies according to animal
species and age (Forster and Ogata, 1998), feeding
practices and rearing conditions (Forster and Ogata, 1998;
Mai et al., 2006), digestibility of energy content and
nutrient diets (Rodehutscord et al., 2000), and the model
used to analyze the dose-response relationship (Mai et al.,
2006). In this study, all the fish used were adult females
and, in that life stage, the fish have much greater energy
requirements for maturation of the gonads, especially
females. Muscle growth slows down during the advanced
stages of gonad development (Tveiten et al., 1998), as
reported in salmonids during sexual maturation (Aksnes
et al., 1986; Tveiten et al., 1998). This suppression or
reduction of muscle growth is associated with high
plasma concentrations of sex steroids and may also, at
least in part, be mediated through stimulation of autolytic
enzyme activity in the muscle tissue (Ando et al., 1986;
Tveiten et al., 1998). For female adult lambari, lysine
supplementation can prevent a decrease in growth, by
increasing their weight even through advanced stages of
gonadal development.
Supplementation of lysine can reduce whole-body
lipid content of fish (Mai et al., 2006; Zhang et al., 2008;
Carter and Hauler, 2011) and increase whole-body protein
content (Wang et al., 2005; Abboudi et al., 2006; Lin
et al., 2012), improving the final quality of carcass. This
relationship could be attributed to the use of balanced diets,
which reduces the catabolism of amino acids and improves
protein synthesis, reducing the use of dietary protein for
lipid formation (Rodehutscord et al., 2000; Tantikitti and
Chimsung, 2001; Encarnação et al., 2004). Lysine is also
a precursor of carnitine, which facilitates the removal of
short-chain organic acids from mitochondria, thereby
freeing intramitochondrial co-enzyme A to participate in
β
-
oxidation, avoiding accumulation of whole-body lipids
(Ozório et al., 2001). Burtle and Liu (1994) reported that
whole-body lipids of channel catfish (
Ictalurus punctatus
)
were reduced with carnitine supplementation, lysine
supplementation, or both. In the present study, the dietary
lysine level estimated to achieve lower whole-body lipids
was 18.76 g kg
−1of dry diet, a value similar to the dietary
lysine requirement determined based on weight gain.
Some authors observed a reduction in whole-body lipids
in fish fed optimal levels of lysine, even without changes
in whole-body protein (Luo et al., 2006; Sánchez-Lozano
et al., 2009; Deng et al., 2011).
In this study, fish showed muscle growth
predominantly by hypertrophy of the cells. Most fish
species present unlimited muscle growth, through
active growth processes of hyperplasia and hypertrophy
(Stickland, 1983). However, in some small fish species,
such as zebrafish (
Danio rerio
), muscle growth is
pre-determined, with low hyperplastic growth occurring after
the juvenile phases (Biga and Goetz, 2006). Lambari is
a small species; thus, the hyperplastic growth period is
shorter, and muscle growth occurs mainly by hypertrophy
(Veggetti et al., 1993; Koumans and Akster, 1995). On
hyperplasia continues to be an important contributor to
muscle growth into the adult phase (Zimmerman and
Lowery, 1999). Adult Nile tilapia present muscle growth
characterized by different fiber diameters (mosaic pattern),
and the frequency of <20 μm diameter muscle fibers
confirmed that the hyperplasia growth process in white
muscle occurs throughout all life stages (Michelato et al.,
2016). Increasing the number of fibers during early life
stages is associated with meat production and high growth
rates (Rowlerson and Veggetti, 2001). Well-balanced diets
for fish larvae promote increased growth rates associated
with a higher contribution of hyperplasia, which in
turn, promote an increase in the body size of adult fish
(Galloway et al., 1999; Ostaszewska et al., 2008; Michelato
et al., 2016). For adult lambari, the dietary lysine levels
evaluated were not sufficient to reflect differences in
frequency of diameter classes of muscle fibers. However,
adult lambari have a low capacity to increase their size;
therefore, promoting methods to increase hyperplasia in
larvae of this species can possibly increase growth rates of
adult fish.
The increased ALT and AST serum levels of fish
that received the highest levels of dietary lysine suggest
an increase in the catabolism of amino acids, since ALT
and AST are the most important enzymes involved in
deamination and transamination reactions (Cowey and
Walton, 1989). The excess of amino acid provided cannot
be stored by fish and is converted into energetic compounds
(Stone et al., 2003). The same was demonstrated in
fingerling black sea bream (
Acanthopagrus schlegelii
)
fed diets with different lysine and arginine levels, which
had lower plasma ALT activity when they received the
control diet (Zhou et al., 2011). Increased levels of ALT
activity were also observed in the sera of fry, fingerling,
and juvenile Nile tilapia when the dietary protein level
was between 25 and 45% (Abdel-Tawwab et al., 2010).
The authors attributed the increase in ALT activity to the
use of excess hydrocarbons from amino acids to supply
energetic demands.
The appropriate lysine supplementation resulted in
increased weight gain and decreased whole-body lipids,
wherein the best results were obtained in fish fed diets with
a ratio of arginine:lysine of 0.91:1.0. Besides the lysine
requirement, the arginine:lysine ratio should be considered
to prevent antagonism between these amino acids (Wu,
2013). Considering that the growth of lambari females
results in animals with greater whole-body lipids, lysine
supplementation constitutes a nutritional tool to bring the
fish to market.
Conclusions
According to the broken-line model analysis of
weight gain and dietary lysine levels, the dietary lysine
requirement for adult lambari is 18.72 g kg
−1(5.41% of
dietary protein).
Acknowledgments
We would like to thank the Ajinomoto Animal
Nutrition – Animal Nutrition Division, São Paulo, SP,
Brazil, which assisted with the amino acid analyses. This
study was funded by the Coordenação de Aperfeiçoamento
de Pessoal de Nível Superior (CAPES) and Conselho
Nacional de Desenvolvimento Científico e Tecnológico
(CNPq), Brasília, DF, Brazil.
References
Abboudi, T.; Mambrini, M.; Ooghe, W.; Larondelle, Y. and Rollin, X. 2006. Protein and lysine requirements for maintenance and for tissue accretion in Atlantic salmon (Salmo salar) fry. Aquaculture 261:369-383. https://doi.org/10.1016/j.aquaculture.2006.07.041 Abdel-Tawwab, M.; Ahmad, M. H.; Khattab, Y. A. and Shalaby, A.
M. 2010. Effect of dietary protein level, initial body weight, and their interaction on the growth, feed utilization, and physiological alterations of Nile tilapia, Oreochromis niloticus (L.). Aquaculture 298:267-274. https://doi.org/10.1016/j.aquaculture.2009.10.027 Abimorad, E. G. and Castellani, D. 2011. Exigências nutricionais
de aminoácidos para o lambari-do-rabo-amarelo baseadas na composição da carcaça e do músculo. Boletim do Instituto de Pesca 37:31-38.
Aksnes, A.; Gjerde, B. and Roald, S. O. 1986. Biological, chemical and organoleptic changes during maturation of farmed Atlantic salmon, Salmo salar. Aquaculture 53:7-20. https://doi.org/10.1016/0044-8486(86)90295-4
Almeida, F. L. A.; Carvalho, R. F.; Pinhal, D.; Padovani, C. R.; Martins, C. and Dal Pai-Silva, M. 2008. Differential expression of myogenic regulatory factor MyoD in pacu skeletal muscle (Piaractus mesopotamicus Holmberg 1887: Serrasalminae, Characidae, Teleostei) during juvenile and adult growth phases. Micron 39:1306-1311. https://doi.org/10.1016/j.micron.2008.02.011 Ando, S.; Yamazaki, F.; Hatano, M. and Zama, K. 1986.
Deterioration of chum salmon (Oncorhynchus keta) muscle during spawning migration. III. Changes in protein composition and protease activity of juvenile chum salmon muscle upon treatment with sex steroids. Comparative Biochemistry and Physiology Part B: Comparative Biochemistry 83:325-330. https://doi.org/10.1016/0305-0491(86)90375-5
AOAC - Association of Official Analytical Chemists. 1995. Official methods of analysis of the Association of Analytical Chemist. 16th ed. AOAC International, Washington, DC.
Berge, G. E.; Sveier, H. and Lied, E. 1998. Nutrition of Atlantic salmon (Salmo salar); the requirement and metabolic effect of lysine. Comparative Biochemistry and Physiology Part A 120:477-485. Biga, P. R. and Goetz, F. W. 2006. Zebrafish and giant danio as
Burtle, G. J. and Liu, Q. 1994. Dietary carnitine and lysine affect channel catfish lipid and protein composition. Journal of the World Aquaculture Society 25:169-174. https://doi.org/10.1111/j.1749-7345.1994.tb00178.x
Cao, J. M.; Chen, Y.; Zhu, X.; Huang, Y. H.; Zhao, H. X.; Li, G. L.; Lan, H. B.; Chen, B. and Pan, Q. 2012. A study on dietary L‐lysine requirement of juvenile yellow catfish Pelteobagrus fulvidraco. Aquaculture Nutrition 18:35-45. https://doi.org/10.1111/j.1365-2095.2011.00874.x
Carter, C. G. and Hauler, R. C. 2011. Effect of high digestible protein to digestible energy ratio on lysine utilisation by Atlantic salmon, Salmo salar L., parr. Aquaculture 311:209-214. https://doi.org/10.1016/j.aquaculture.2010.11.045
Cho, C. Y. and Bureau, D. P. 1997. Reduction of waste output from salmonid aquaculture through feeds and feeding. The Progressive Fish-Culturist 59:155-160. https://doi.org/10.1577/1548-8640(1997)059<0155:ROWOFS>2.3.CO;2
Cotan, J. L. V.; Lanna, E. A. T.; Bomfim, M.; Donzele, J.; Ribeiro, F. B. and Serafini, M. A. 2006. Níveis de energia digestível e proteína bruta em rações para alevinos de lambari tambiú. Revista Brasileira de Zootecnia 35:634-640. https://doi.org/10.1590/ S1516-35982006000300002
Cowey, C. B. 1995. Protein and amino acids requirements: a critique of methods. Journal of Applied Ichthyology 11:199-204. Cowey, C. B. and Walton, M. J. 1989. Intermediary metabolism.
p.259-329. In: Fish Nutrition. 2nd ed. Halver, J. E. and Hardy, R. W., ed. Academic Press, San Diego.
Deng, J.; Zhang, X.; Tao, L.; Bi, B.; Kong, L. and Lei, X. 2011. d‐lysine can be effectively utilized for growth by common carp (Cyprinus carpio). Aquaculture Nutrition 17:467-475. https://doi.org/10.1111/j.1365-2095.2010.00783.x
Dubowitz, V. and Brooke, M. H. 1973. Muscle biopsy: a modern approach. WB Saunders, Philadelphia.
Dutra, F. M.; Machado, W. J.; Caetano, M. S. and Gobbo, A. A. 2012. Avaliação sensorial do processamento em conserva, utilizando-se as espécies: Tilápia (Oreochromis niloticus), Lambari (Astianax spp) e Pacu (Piaractus mesopotamicus). Revista Brasileira de Produtos Agroindustriais 14:239-244.
El-Sayed, A-F. M. 1999. Alternative dietary protein sources for farmed tilapia, Oerochromis spp. Aquaculture 179:149-168. https://doi.org/10.1016/S0044-8486(99)00159-3
Encarnação, P.; Lange, C.; Rodehutscord, M.; Hoehler, D.; Bureau, W. and Bureau, D. P. 2004. Diet digestible energy content affects lysine utilization, but not dietary lysine requirements of rainbow trout (Oncorhynchus mykiss) for maximum growth. Aquaculture 235:569-586. https://doi.org/10.1016/j.aquaculture.2004.01.001 Forster, I. and Ogata, H. Y. 1998. Lysine requirement of juvenile
Japanese flounder Paralichthys olivaceus and juvenile red sea bream Pagrus major. Aquaculture 161:131-142. https://doi.org/10.1016/S0044-8486(97)00263-9
Furuya, W. M.; Botaro, D.; Neves, P. R.; Silva, L. C. R. and Hayashi, C. 2004. Exigência de lisina pela Tilápia do Nilo (Oreochromis niloticus), na fase de terminação. Ciência Rural 34:1933-1937. https://doi.org/10.1590/S0103-84782004000500038
Furuya, W. M.; Michelato, M.; Salaro, A. L.; Cruz, T. P. and Barraviera-Furuya, V. R. 2015. Estimation of the dietary essential amino acid requirements of colliroja Astyanax fasciatus by using the ideal protein concept. Latin American Journal of Aquatic Research 43:888-894.
Galloway, T. F.; Kjorsvik, E. and Kryvi, H. 1999. Muscle growth and development in Atlantic cod larvae (Gadus morhua L.), related to different somatic growth rates. Journal of Experimental Biology 202:2111-2120.
Gonçalves, L. U.; Parisi, G.; Bonelli, A.; Sussel, F. R. and Viegas, E. M. M. 2014. The fatty acid compositions of total, neutral andpolar
lipids in wild and farmed lambari (Astyanax altiparanae) (Garutti & Britski, 2000) broodstock. Aquaculture Research 45:195-203. https://doi.org/10.1111/j.1365-2109.2012.03215.x
Khan, M. and Abidi, S. 2011. Effect of dietary L‐lysine levels on growth, feed conversion, lysine retention efficiency and haematological indices of Heteropneustes fossilis (Bloch) fry. Aquaculture Nutrition 17:657-667. https://doi.org/10.1111/j.1365-2095.2010.00815.x
Kim, J-D. and Lall, S. P. 2000. Amino acid composition of whole body tissue of Atlantic halibut (Hippoglossus hippoglossus), yellowtail flounder (Pleuronectes ferruginea) and Japanese flounder (Paralichthys olivaceus). Aquaculture 187:367-373. https://doi.org/10.1016/S0044-8486(00)00322-7
Koumans, J. T. M and Akster, H. A. 1995. Myogenic cells in development and growth of fish. Comparative Biochemistry and Physiology Part A: Physiology 110:3-20. https://doi.org/10.1016/0300-9629(94)00150-R
Lin, Y.; Gong, Y.; Yuan, Y.; Gong, S.; Yu, D.; Li, Q. and Luo, Z. 2012. Dietary L‐lysine requirement of juvenile Chinese sucker, Myxocyprinus asiaticus. Aquaculture Research 44:1-11. https://doi.org/10.1111/j.1365-2109.2012.03161.x
Luo, Z.; Liu, Y.-J.; Mai, K.-S.; Tian, L.-X.; Tan, X.-Y.; Yang, H.-J.; Liang, G.-Y. and Liu, D.-H. 2006. Quantitative L‐lysine requirement of juvenile grouper Epinephelus coioides. Aquaculture Nutrition 12:165-172. https://doi.org/10.1111/j.1365-2095.2006.0 0392.x
Mai, K.; Zhang, L.; Ai, Q.; Duan, Q.; Zhang, C.; Li, H.; Wan, J. and Liufu, Z. 2006. Dietary lysine requirement of juvenile Japanese seabass, (Lateolabrax japonicus). Aquaculture 258:535-542. https://doi.org/10.1016/j.aquaculture.2006.04.043
Michelato, M.; Vidal, L. V. O.; Xavier, T. O.; Moura, L. B.; Almeida, F. L. A.; Pedrosa, V. B.; Furuya, V. R. B. and Furuya, W. M. 2016. Dietary lysine requirement to enhance muscle development and fillet yield of finishing Nile tilapia. Aquaculture 457:124-130. https://doi.org/10.1016/j.aquaculture.2016.02.022
NRC - National Research Council. 2011. Nutrient requirements of fish and shrimp. National Academy Press, Washington, DC. Ostaszewska, T.; Dabrowski, K.; Wegner, A. and Krawiec, M.
2008. The effects of feeding on muscle growth dynamics and the proliferation of myogenic progenitor cells during pike perch development (Sander lucioperca). Journal of the World Aquaculture Society 39:184-195. https://doi.org/10.1111/j.1749-7345.2008.00151.x
Ozório, R. O. A.; Van Eekeren, T. H. B.; Huisman, E. A. and Verreth, J. A. J. 2001. Effects of dietary carnitine and protein energy: nonprotein energy ratios on growth, ammonia excretion and respiratory quotient in African catfish, Clarias gariepinus (Burchell) juveniles. Aquaculture Research 32:406-414. https:// doi.org/10.1046/j.1355-557x.2001.00031.x
Peres, H. and Oliva-Teles, A. 2008. Lysine requirement and efficiency of lysine utilization in turbot (Scophthalmus maximus) juveniles. Aquaculture 275:283-290. https://doi.org/10.1016/j.aquaculture.2007.12.015
Porto-Foresti, F.; Castilho-Almeida, R. B.; Senhorini, J. A. and Foresti, F. 2010. Biologia e criação do lambari-do-rabo-amarelo (Astyanax altiparanae). p.101-115. In: Espécies nativas para piscicultura no Brasil. 2a ed. Baldisserotto, B. and Gomes, L. C., ed. Editora UFSM, Santa Maria, RS.
Rodehutscord, M.; Borchert, F.; Gregus, Z.; Pack, M. and Pfeffer, E. 2000. Availability and utilisation of free lysine in rainbow trout (Oncorhynchus mykiss): 1. Effect of dietary crude protein level. Aquaculture 187:163-176. https://doi.org/10.1016/S0044-8486(99)00388-9
Muscle development and growth. 18th ed. Johnston, I. A., ed. Academic Press, London.
Sánchez-Lozano, N. B.; Martínez-Llorens, S.; Tomás-Vidal, A. and Cerdá, M. J. 2009. Effect of high-level fish meal replacement by pea and rice concentrate protein on growth, nutrient utilization and fillet quality in gilthead seabream (Sparus aurata, L.). Aquaculture 298:83-89. https://doi.org/10.1016/j.aquaculture.2009.09.028 Stickland, N. C. 1983. Growth and development of muscle fibers
in the rainbow trout (Salmo gairdneri). Journal of Anatomy 137:323-333.
Stone, D.; Allan, G. and Anderson, A. 2003. Carbohydrate utilization by juvenile silver perch, Bidyanus bidyanus (Mitchell). III. The protein‐sparing effect of wheat starch‐based carbohydrates. Aquaculture Research 34:123-134. https://doi.org/10.1046/j.1365-2109.2003.00774.x
Talbot, C. and Hole, R. 1994. Fish diets and the control of eutrophication resulting from aquaculture. Journal of Applied Ichthyology 10:258-270. https://doi.org/10.1111/j.1439-0426.1994.tb00165.x Tantikitti, C. and Chimsung, N. 2001. Dietary lysine
requirement of freshwater catfish (Mystus nemurus Cuv. and Val.). Aquaculture Research 32:135-141. https://doi.org/10.1046/j.1355-557x.2001.00011.x
Tibaldi, E. and Kaushik, S. J. 2005. Amino acid requirements of Mediterranean fish species. Cahiers Options Méditerranéennes 63:59-65.
Tveiten, H.; Mayer, I.; Johnsen, H. and Jobling, M. 1998. Sex steroids, growth and condition of Arctic charr broodstock during an annual cycle. Journal of Fish Biology 53:714-727. https://doi.org/ 10.1111/j.1095-8649.1998.tb01827.x
Veggetti, A.; Mascarello, F.; Scapolo, P. A.; Rowlerson A. and Carnevali, C. 1993. Muscle growth and myosin isoform transitions during development of a small teleost fish, Poecilia reticulata (Peters) (Atheriniformes, Poeciliidae): a histochemical,
imunohistochemical, ultrastructural and morphometric study. Anatomy and Embryology (Berlin) 187:353-361. https://doi.org/10.1007/BF00185893
Wang, S.; Liu, Y-J.; Tian, L-X.; Xie, M-Q.; Yang, H-J.; Wang, Y. and Liang, G-Y. 2005. Quantitative dietary lysine requirement of juvenile grass carp Ctenopharyngodon idella. Aquaculture 249:419-429. https://doi.org/10.1016/j.aquaculture.2005.04.005 Wilson, R. P. 2002. Amino acids and proteins. p.144-175. In: Fish
nutrition. 3rd ed. Halver, J. E. and Hardy, R. W., eds. Academic Press, San Diego.
Wilson, R. P. 2003. Amino acid requirements of finfish and crustaceans. p.427-447. In: Amino acids in animal nutrition. D`Mello, J. P. F., ed. CABI Publishing, Edinburgh.
Wu, G. 2013. Amino acids: biochemistry and nutrition. CRC Press, New York.
Zhang, C.; Ai, Q.; Mai, K.; Tan, B.; Li, H. and Zhang, L. 2008. Dietary lysine requirement of large yellow croaker, Pseudosciaena crocea R. Aquaculture 283:123-127. https://doi.org/10.1016/j.aquaculture.2008.06.035
Zhou, F.; Shao, J.; Xu, R.; Ma, J. and Xu, Z. 2010. Quantitative L‐lysine requirement of juvenile black sea bream (Sparus macrocephalus). Aquaculture Nutrition 16:194-204. https://doi.org/10.1111/j.1365-2095.2009.00651.x
Zhou, F.; Shao, Q-J.; Xiao, J-X.; Peng, X.; Ngandzali, B-O.; Sun, Z. and Ng, W-K. 2011. Effects of dietary arginine and lysine levels on growth performance, nutrient utilization and tissue biochemical profile of black sea bream, Acanthopagrus schlegelii, fingerlings. Aquaculture 319:72-80. https://doi.org/10.1016/j.aquaculture.2011.06.001