Vol.51, n. 1 : pp. 49-56, January-February 2008
ISSN 1516-8913 Printed in Brazil BRAZILIAN ARCHIVES OF
BIOLOGY AND TECHNOLOGY
A N I N T E R N A T I O N A L J O U R N A L
Lysine Requirement of Starting Barrows from Two Genetic
Groups Fed on Low Crude Protein Diets
Alessandro Luís Fraga1 “in memoriam”, Ivan Moreira2*, Antonio Claudio Furlan2 , Alexandre Orio Bastos3, Ricardo Pinto de Oliveira4 and Alice Eiko Murakami2
1
Universidade Federal do Mato Grosso; Campus de Rondonópolis; Mato Grosso - MT - Brasil. 2Departamento de Zootecnia; Universidade Estadual de Maringá; Av. Colombo, 5790; 87020-900; imoreira@uem.br; Maringá - PR - Brasil. 3Ministério da Agricultura, Pecuária e Abastecimento; Curitiba - PR - Brasil. 4Multimix S.A.; Campinas - SP - Brasil
ABSTRACT
A trial was carried out to determine the lysine requirement for starting barrows fed on ideal protein concept-based diets. Thirty-two pigs from a commercial crossbred genetic group (CCGG, BW=15.9 ± 1.4 kg) and 32 pigs from a dam line one (DLGG, BW= 14.8 ± 1.0 kg) were used. Pigs were allotted to 4 treatments with diets containing increasing levels of total lysine (0.80, 1.00, 1.20 and 1.40%). Methionine+cystine, threonine and tryptophan were adjusted according to ideal protein profile. Data from performance, plasma urea nitrogen (PUN) and carcass composition were analyzed. CCGG showed higher daily feed intake, daily weight gain, PUN and protein:fat ratio in carcass, while DLGG showed higher fat carcass content and nitrogen retention. Fat content and protein:fat ratio in carcass for CCCGG and PUN and crude protein carcass content for DLGG showed quadratic response to increasing total lysine levels. Derivations of the quadratic equations indicated the total lysine requirement for CCGG starting barrows is 1.15% and for DLGG starting barrows is 1.09%.
Key words: Carcass composition, crystalline amino acids, nitrogen excretion, nutrition, lean meat
* Author for correspondence
INTRODUCTION
Environmental pollution is an increasing concern in the pig production, mainly due to nitrogen in the slurry. Low crude protein diets formulated with crystalline amino acids are an effective way to decrease nitrogen excretion from the pigs (Canh et al., 1998, Moreira et al., 2004, Oliveira et al.,
2004). According to the ideal protein concept, animals are fed on the exact amino acid amounts required by them, or rather, with no excess or lack of amino acids in the diet (Baker, 1996). When a diet is formulated according to ideal protein
concept, the requirement of essential amino acid is obtained according to lysine requirements. Amino acids requirements are shown as amino acid to lysine ratio (Penz Junior, 1996). Genetic factors, gender, body weight and environmental conditions influence lysine requirement. There are different lysine requirement values of starting pig in the literature. In a review Ferreira et al. (1996) found
1.09% as an average requirement, while Benati (1996) reported 1.15% as the average lysine level used by the Brazilian pig industry. International (National Research Council, 1998) and Brazilian (Rostagno et al., 2005) requirement indicate 1.05
The aim of this study was to determine the dietary total lysine requirement of starting barrows from two genetic groups, fed on low crude protein diets, formulated according to the ideal protein concept.
MATERIALS AND METHODS
Animals and housing
Sixty-four barrow pigs (thirty-two from each genetic group) were used. Groups consisted of a commercial crossbred genetic group (CCGG), formed by the Duroc boar x [Landrace x Large-White crossbreed sow] crossbreeds (15.9 ± 1.4 kg; 45 to 73 d of age), and a dam line genetic group (DLGG), formed by crossbreeds (14.8 ± 1.0 kg; 44
to 72 d of age) from a swine improvement company. Thus, DLGG resulted from a selection process from dam line while CCGG was not from improvement process. Two pigs/pen were housed in an open-sided house. Pens were equipped with two self-feeders and two drinker nipples. The Food and the water were given ad libitum. Mean
temperature inside the building ranged from 19.0 ± 2.9 to 30.5 ± 3.3oC during the trial.
Experimental diets
As shown in Table 1, four experimental dietswere used: one basal diet with 0.8% total lysine and three diets with increasing lysine levels (1.0, 1.2 and 1.4% total lysine).
Table 1 - Centesimal, chemical and energetic composition of experimental diets containing graded levels of lysine
(as-fed basis)
Total lysine levels (%) Item
0.80 1.00 1.20 1.40
Ingredients (%)
Yellow corn 78.55 78.55 78.55 78.55
Soybean meal 13.09 13.09 13.09 13.09
Soybean oil 3.16 3.16 3.16 3.16
Dicalcium phosphate 1.46 1.46 1.46 1.46
Limestone 0.73 0.73 0.73 0.73
Salt 0.40 0.40 0.40 0.40
Vitamin and mineral premix † 0.50 0.50 0.50 0.50
Growth promoter ‡ 0.10 0.10 0.10 0.10
Corn starch 1.70 1.16 0.63 0.09
L-lysine HCl (78.8%) 0.182 0.436 0.690 0.994
DL- methionine (99%) 0.053 0.168 0.282 0.396
L- threonine (98%) 0.096 0.229 0.360 0.492
L-tryptophan (98%) 0.000 0.038 0.074 0.112
Total 100.00 100.00 100.00 100.00
Nutrients
Digestible energy (kcal/kg) 3,400 3,408 3,416 3,424
Crude protein (%) 13.13 13.56 13.99 14.42
Calcium (%) 0.65 0.65 0.65 0.65
Total phosphorus (%) 0.55 0.55 0.55 0.55
Na + K - Cl§ (meq/kg) 116.3 102.5 89.0 75.2
Lysine (%) 0.80 1.00 1.20 1.40
Methionine + cystine (%) 0.453 0.566 0.679 0.792
Threonine (%) 0.517 0.647 0.776 0.905
Tryptophan(%) 0.145 0.182 0.218 0.255
† The vitamin and trace mineral premix supplied per kg of diet: Vit. A - 10.000 UI; Vit. D3 - 2.000 UI; Vit. E – 25.0 UI; Vit K3 –
2.0 mg; Vit. B1 – 2.0 mg; Vit B2 – 6.0 mg; Vit. B6 – 3.0 mg; Vit. B12 – 30.0 µg; Niacin – 30.0 mg; Pantothenic acid – 12.0 mg;
Biotin - 0.1 mg; Folacin - 1.0 mg; Selenium - 0.3 mg; Choline - 150.0 mg; Lysine - 1.170.0 mg; Growth promoter - 50.0 mg; Antioxidant – 100 mg; Iodine - 1.5 mg; Cobalto – 1.0 mg; Cooper – 175.0 mg; Zinc – 100.0 mg; Iron – 100.0 mg; Manganese – 40.0 mg.
‡ Tylosin phosphate + sulfamethazine (10% each).
Crystalline lysine HCl, Dmethionine, L-threonine and L-tryptophan were added to diets, at the expense of corn starch, to maintain a similar
amino acid pattern (lysine 100:
methionine+cystine 57: threonine 65: tryptophan 18), as indicated by NRC (1998) for barrows with 300 g of daily lean gain, 22.5 kg body weight and 3,400 kcal of DE/kilogram of diet.
The yellow corn and soybean meal used in the experimental diets were previously analyzed for the crude protein and gross energy. Values of digestible energy and amino acid content of these ingredients were calculated according to feedstuffs composition (crude energy digestible coefficient and amino acids proportion) indicated by Empresa Brasileira de Pesquisas Agropecuárias (1991).
Experimental protocols
Pigs and feed were weighed on 0 and 28 days of the trial to calculate daily feed intake (DFI), daily weight gain (DWG) and feed: gain ratio (FG). Pigs were bled by vena cava cranialis in heparinized tubes at the beginning and the end of the experiment. Plasma urea concentrations were determined by the enzymatic method (Kit Ecoline
25 MERCK®). Values of plasma urea
concentration were multiplied by 0.467 (Newman and Price,1999) to calculate the plasma urea nitrogen (PUN). The initial PUN (pretreatment period) was used as a covariate to correct the final PUN for the individual animal differences.
Three pigs from each genetic group were slaughtered at the beginning of the trial to determine initial body composition. At the end of the trial, two pigs from the each treatment were slaughtered. Pigs were fasted for 24 h with access to water for 6 h before slaughter. Half carcasses from each slaughtered pig were frozen (-12oC),
and then ground by electrical grinder, powered by a 1700-rpm engine, with a 4 mm-round hole perforated plate. Samples of approximately 1.0 kg were taken and stored at -12oC for chemical
analysis later.
Approximately 200 g of each sample was defrosted, pre-dried during 72 h and the fat was pre-extracted for 4 h by "Soxlhet" extractor. Pre-dried and pre-fat extracted samples were ground with "ball" grinder and then kept refrigerated until the analysis (Association of Official Analytical
Chemists, 1975). Carcasses were analyzed for the protein, water, fat and ash contents. Values obtained during the pre-drying and pre-fat extraction were used for calculating values in whole carcasses. Deposition of protein and fat by pigs and the retention percentage of intake nitrogen were also estimated by the following formula:
Daily Protein Accretion = (APEC – APIC) / EP,
where, APEC and APIC were respectively the
amount (gram) of protein in the carcass at the end and at the beginning of the trial; EP was the experimental period (days). APEC was obtained by
multiplying the carcass weight of one particularly pig by its respective crude protein content, while APIC was obtained by multiplying the body weight
of this respective pig by the average carcass dressing and the crude protein content of its genetic group (average of three pigs slaughtered at the beginning of the trial).
Daily Fat Accretion = (AFEC – AFIC) / EP,
where AFEC and AFIC were respectively the
amount (gram) of fat in the carcass at the end and at the beginning of the trial; EP was the experimental period (in days). AFEC and AFIC were
obtained as APEC and APIC, considering the fat
content values.
Nitrogen Retention = (nitrogen acretion / nitrogen intake) x 100, where nitrogen accretion and nitrogen intake were, respectively, daily protein accretion / 6.25 and DFI x nitrogen % of the diet, in grams.
Statistical analysis
Pigs were blocked by the body weight and allotted to 4 x 2 factorial treatment arrangement (four lysine levels 0.80, 1.00 1.20 and 1.40% and two genetic groups) in a randomized block design. The eight treatments were replicated four times and two pigs per experimental unit were used. Data were submitted to polynomial regression analysis, according to the following statistic model:
Yijk = µ + Gi+ b1(Lj – L) + b2(Lj – L)2 + eijk ,
where:
Yijk = observed value of variables, referring
to each k pig, fed on j lysine level, within i genetic
µ = general constant;
Gi= genetic group effect on variable Y, i =1,
2;
b1 = linear regression coefficient of lysine
level on variable Y;
b2 = quadratic regression coefficient of
lysine level on variable Y;
Lj = lysine levels in the experimental diets,
with j = 0.80; 1.00; 1.20 and 1.40%;
L= average lysine level (1.1) of experimental diets;
eijk = error in each replicate.
Initial values of PUN and slaughtered weight were used as covariates in the analysis of data from PUN and carcass composition, respectively. Exponential equations obtained for variables with quadratic response were derived to estimate lysine requirement.
RESULTS AND DISCUSSION
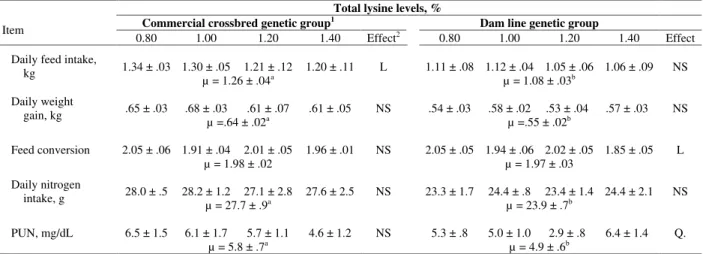
Performance and PUN data of two genetic groups fed on increasing lysine levels are given in Table 2 and carcass composition in Table 3. Lysine estimating equations are shown in Table 4. About performance traits, there were differences (P<0.05) between the genetic groups: the CCGG had higher feed and nitrogen intake, weight gain and PUN than the DLGG. Probably the lower feed intake was the reason for other differences (nitrogen intake, weight gain and PUN values) of the DLGG. According to Moreira (1998), modern pig genotypes generally show lower feed intake, when compared with pigs not submitted to selection programs.
Feed intake decreased for the CCGG with the increase of lysine levels (P<0.05). However, when contrast test was made comparing 0.80 plus 1.00 against 1.20 plus 1.40% of total lysine content, difference (P<.05) for the CCGG and for the DLGG (P=0.055) was found. This observation revealed the negative effect of high levels of crystalline lysine-HCl over the consumption by the pigs. Decrease of DFI caused by increasing lysine levels could be explained by decreasing in Na+K-Cl value, owing to L-lysine HNa+K-Cl inclusion, although the decrease in the Na+K-Cl value in this trial was from 116 to 75 meq/kg (from 0.80 to 1.40% of total lysine diet) and this range was not higher than the range (341 to 0 meq/kg) proposed by Patience et al. (1987) as necessary to reduce the
feed intake. The DLGG showed linear improve (P<.05) for feed conversion with the increase of lysine levels. The PUN, the result of amino acid catabolism, indicates the capacity of utilization of intake nitrogen by the animal (Brown and Cline, 1974). It’s used for amino acid requirement determinations (Coma et al., 1995). In this trial,
the DLGG showed quadratic response of the PUN (P=0.05). The derivation of the polynomial regression indicated 1.09 as the best level of total lysine for the lowest PUN value, or for the minimum nitrogen excretion by the urine. Although the CCGG showed a high numerical reduction in PUN values with the increasing lysine levels, no statistical difference (P>0.1) was observed among the diets.
PUN generally shows a high variance (Coma et al., 1995) and in some studies, PUN was not efficient to determine the lysine requirement (Fontes et al,.1999; Gasparotto et al., 2001; Hannas et al.,
2000; Moreira et al., 2002, Moreira et al., 2004).
indicated 1.08% of total lysine content for the maximum protein content of the carcass.
Based on the averages of the values of total lysine indicated by the polynomial equations, the CCGG
and DLGG requirements of total lysine found in this trial were 1.15 and 1.09 %, respectively.
Table 2 – Performance and nitrogen urea values of starting barrow pigs from two genetic groups fed increasing total
lysine levels
Total lysine levels, %
Commercial crossbred genetic group1 Dam line genetic group Item
0.80 1.00 1.20 1.40 Effect2 0.80 1.00 1.20 1.40 Effect
1.34 ± .03 1.30 ± .05 1.21 ± .12 1.20 ± .11 L 1.11 ± .08 1.12 ± .04 1.05 ± .06 1.06 ± .09 NS Daily feed intake,
kg µ = 1.26 ± .04a µ = 1.08 ± .03b
.65 ± .03 .68 ± .03 .61 ± .07 .61 ± .05 NS .54 ± .03 .58 ± .02 .53 ± .04 .57 ± .03 NS Daily weight
gain, kg µ =.64 ± .02a µ =.55 ± .02b
2.05 ± .06 1.91 ± .04 2.01 ± .05 1.96 ± .01 NS 2.05 ± .05 1.94 ± .06 2.02 ± .05 1.85 ± .05 L Feed conversion
µ = 1.98 ± .02 µ = 1.97 ± .03
28.0 ± .5 28.2 ± 1.2 27.1 ± 2.8 27.6 ± 2.5 NS 23.3 ± 1.7 24.4 ± .8 23.4 ± 1.4 24.4 ± 2.1 NS Daily nitrogen
intake, g µ = 27.7 ± .9a µ = 23.9 ± .7b
6.5 ± 1.5 6.1 ± 1.7 5.7 ± 1.1 4.6 ± 1.2 NS 5.3 ± .8 5.0 ± 1.0 2.9 ± .8 6.4 ± 1.4 Q. PUN, mg/dL
µ = 5.8 ± .7a µ = 4.9 ± .6b
1 Means with different superscripts (a,b) within a row differ (P<0.05) between groups. 2 NS - Not significant; L – Linear effect of
total lysine levels (P<0.05); Q – Quadratic effect of total lysine levels (P=0.05).
Considering the genetic difference between the groups, the distance of the optimal lysine levels observed for them was smaller than could be expected. Thus, an effect of the crude protein reduction of the experimental diets could be thought. For the protein synthesis, the animals require not only a correct amount of essential amino acids, such as lysine, but they are necessary non-essential amino acids too (Baker, 1996). High reduction on the crude protein content of diets added synthetic amino acids can limit the availability of non-essential amino acids for the animal protein synthesis. For finishing pig diets, the limit of this reduction is around 4.0 points (Tuitoek et al., 1997; Canh et al., 1998; Kendall et
al. 1998).
In this trial, the crude protein content of the basal diet (0.80% total lysine content) was 5.6 points below of the indicated by NRC (1998) when a corn-soybean meal is used. Consequently, the requirements determined in this study could be limited by the lack of some essential or non-essential amino acids that could limit other amino
acid utilization, making lysine (and other adjusted amino acids) surplus. Exceeding amino acids were degraded and led to quadratic PUN response for the DLGG.
However, Ferreira et al. (1996) suggested 1.09% of total lysine as requirement for barrow pigs from 15 to 30 kg of body weight. Additionally, NRC (1998) indicated 1.07% for medium lean growth barrows (325 g/d of lean deposition). In Brazil, Rostagno et al. (2005) suggested 1.13% for high
lean growth pigs. The requirements determined in this trial were close to the literature values for medium genetic potential that characterizes the CCGG. The DLGG showed a performance not better than a medium genetic potential, hence probably these levels reflected the real capacity of these animal to develop.
Table 3 – Carcass composition and nutrients deposition of starting barrow pigs from two genetic groups fed
increasing total lysine levels
Total lysine levels, %
Commercial crossbred genetic Group1 Dam Line Genetic Group
Item 0.80 1.00 1.20 1.40 Effect2 0.80 1.00 1.20 1.40
Effect
31.0 ± .5 31.0 ± .8 29.8 ± 2.9 28.8 ± .9 NS 29.3 ± 2.0 30.2 ± 1.4 28.9 ± 1.0 29.5 ± 1.2 NS
Slaughter weight, kg
µ = 30.1 ± .7 µ = 29.5 ± .6
65.1 ± .1 65.6 ± .7 66.4 ± .2 65.1 ± .9 NS 63.8 ± .9 64.0 ± .5 65.2 ± .9 64.7 ± .1 NS
Water, %
µ = 65.6 ± .3 µ = 64.4 ± .3
15.4 ± .6 15.6 ± .5 15.6 ± .6 15.6 ± .2 NS 15.4 ± .4 15.9 ± .3 15.7 ± .4 15.4 ± .5 Q* Crude
protein, %
µ = 15.5 ± .2 µ = 15.6 ± .2
16.7 ± .9 15.4 ± 1.3 14.9 ± .9 16.6 ± .6 Q 18.0 ± 1.4 17.8 ± 1.9 16.3 ± .6 16.7 ± .7 NS
Fat, %
µ = 15.9 ± .5b µ = 17.2 ± .5a
3.3 ± .1 3.5 ± .0 3.3 ± .1 3.2 ± .1 NS 3.5 ± .2 3.0 ± .3 3.5 ± .5 3.5 ± .3 NS
Ash, %
µ = 3.3 ± .0 µ = 3.4 ± .1
.93 ± .09 1.03 ± .12 1.06 ± .10 .94 ± .02 Q .87 ±.09 .90 ± .07 .96 ± .06 .93 ± .09 NS
Protein:fat
ratio µ =.99 ± .04a µ =.91 ± .03b
59 ± 1 67 ± 11 68 ± 2 72 ± 0 L* 67 ± 7 75 ± 6 70 ± 4 68 ± 0
NS
Daily protein acretion, g
µ = 66 ± 3 µ = 70 ± 2
97 ± 11 89 ± 22 91 ± 11 107 ± 4 NS 107 ± 17 109 ± 15 94 ± 11 96 ± 7 NS
Daily fat acretion, g
µ = 96 ± 6 µ = 102 ± 6
33.2 ± .5 37.7 ± 6.0 40.2 ± 1.1 41.9 ± .2 L 46.3 ± 4.8 48.9 ± 4.0 48.1 ± 2.6 44.4 ± 0.0 NS
Nitrogen retention, %
µ = 38.2 ± 1.7b µ = 46.9 ±1.4a
1 Means with different superscripts (a,b) within a row differ (P<0.05) between groups. 2 NS - Not significant; L – Linear effect of
total lysine levels (P<0.05), L* - (P=0.07); Q – Quadratic effect of total lysine levels (P=0.05), Q* - (P=0.08)
Table 4 - Quadratic equations according to the effects indicated on Table 3
Variable b0 b1 b2 R2 Best lysine
level, %
Commercial crossbred genetic group
Fat content 17.6 -4.5 +1.9 .944 1.18
Protein:fat ratio 2.6 -3.0 +1.4 .971 1.11
Dam line genetic group
Plasma urea nitrogen 68 -110 +51 .717 1.09
Crude protein content 10.2 +10.5 -4.9 .895 1.08
ACKNOWLEDGEMENTS
The authors would like to thank AJINOMOTO BIOLATINA for supplying the amino acids; to RAÇALTO BRASIL AGROPECUÁRIA LTDA for providing the animals; to Ms. Marlene Leiko Doi Sakuno for urea analysis and to CNPq-Brazil for scholarships given to authors.
RESUMO
PV= 14,8 kg) foram alimentados com quatro dietas contendo níveis crescentes de lisina total (0,80; 1,00; 1,20 e 1,40%). Metionina + cistina, triptofano e treonina foram adicionados às dietas para manter constante o padrão de proteína ideal. Foram analisados dados de desempenho, nitrogênio da uréia plasmática (NUP) e carcaça. Suínos do grupo CC apresentaram maior consumo diário de ração, ganho diário de peso, NUP e relação proteína: gordura na carcaça, enquanto que os animais do grupo LM apresentaram maiores teores de gordura na carcaça e retenção de nitrogênio. Teor de gordura e relação proteína:gordura na carcaça para o grupo CC e NUP e teor de proteína bruta na carcaça para o grupo LM apresentaram resposta quadrática aos níveis de lisina. Derivações das equações indicaram a exigência de lisina total de suínos machos castrados do grupo cruzamento industrial de 1,15% e do grupo linhagem materna de 1,09%.
REFERENCES
Association of Official Analytical Chemists - AOAC (1975), Official methods of analysis. AOAC, Washington, D.C.
Baker, D. H. (1996), Advances in amino acid nutrition and metabolism of swine and poultry. In-Nutrient Management of Food Animals to Enhance and Protect the Environment, ed. E. T. Kornegay. CRC Press, Boca Raton, pp. 41-53.
Benati, M. (1996), Níveis nutricionais utilizados nas dietas de suínos. Paper presented at International Symposium on Nutritional Requirements of Poultry and Swine, 24 – 26 September. Viçosa, Minas Gerais. Brown, J.A. and Cline, T.R. (1974), Urea excretion in the pig: an indicator of protein quality and amino acid requirements, J. Nutr., 104, 542-545.
Canh, T.T., Aarnink, A.J.A., Schutte, J.B., Sutton, A., Langhout, D.J., Verstegen, M.W.A. (1998), Dietary protein affects nitrogen excretion and ammonia emission from slurry of growing-finishing pigs, Livest. Prod. Sci., 56, 181-191.
Coma, J., Carrion, D., Zimmerman, D.R. (1995), Use plasma urea nitrogen as a rapid response criterion to determine the lysine requirement of pigs, J. Anim. Sci., 73, 472-481.
Den Hartog, L.A., Vesseur, P.C. (1994), Nutrition – reproduction interactions in sows. In-Principles of Pig Science, ed. D.J. Cole, J. Wiseman, M.A. Varley. Nottingham University Press, Leicestershire, pp.215-224.
Empresa Brasileira de Pesquisas Agropecuárias -EMBRAPA (1991), Tabela de Composição Química e Valores Energéticos de Alimentos para Suínos e Aves. EMBRAPA/CNPSA, Concórdia.
Ferreira, A.S., Pupa, J.M.R., Souza, A.M. (1996), Exigências nutricionais para suínos determinadas no Brasil. Paper presented at International Symposium on Nutritional Requirements of Poultry and Swine, 24 – 26 September. Viçosa, Minas Gerais.
Fontes, D. O, Donzele, J. L., Ferreira, A.S. (1999), Efeito dos níveis de lisina sobre o teor de uréia no soro e sobre a composição de carcaça de leitoas, dos 15 aos 30 kg. Paper presented at 36a
Reunião Anual da Sociedade Brasileira de Zootecnia, Porto Alegre, Rio Grande do Sul.
Gasparotto, L.F., Moreira, I., Furlan, A.C. et al. (2001), Exigência de lisina, com base no conceito de proteína ideal, para suínos machos castrados de dois grupos genéticos, na fase de crescimento. Rev. Soc. Bras. Zoot.,30, 1742-1749.
Hannas, M.I., Oliveira, R.F.M., Donzele, J.L. et al. (2000), Proteína bruta para suínos machos castrados mantidos em ambiente de conforto térmico dos 15 aos 30 kg, Rev. Soc. Bras. Zoot.,29, 476-484.
Kendall, D. C., Lemenager, K. M., Richert, B. T. et al. (1998), Effects of Intact Protein Diets Versus Reduced Crude Protein Diets Supplemented with Synthetic Amino Acids on Pig Performance and Ammonia Levels in Swine Buildings <http://www.ansc.purdue.edu/
swine/swineday/sday98/psd20-98.htm
Mongin, P., Sauveur, B. (1977), Interrelationship between mineral nutrition, acid-base balance, growth and cartilage abnormalities. In-Growth and Poultry Meat Production, ed. K. N. Boorman, B. J. Wilson. Br. Poultry Science, Edinburgh, pp.235-247.
Moreira, I. (1998), Nutrição de rebanhos de suínos geneticamente melhorados. Paper presented at II Simpósio Nacional de Melhoramento Animal, Uberaba, Minas Gerais.
Moreira, I., Fraga, A.L., Paiano, D. at al. (2004) Nitrogen balance of starting barrow pigs fed on increasing lysine levels. Braz. Arch of Biol. And Techoln. 47, 85-91.
Moreira, I., Gasparotto, L.F., Furlan, A. C. et al. (2002) Exigência de lisina para machos castrados de dois grupos genéticos de suínos na fase de terminação, com base no conceito de proteína ideal. Rev. Soc. Bras. Zoot.,31, 96-103.
Moreira, I., Kutschenko, M., Furlan, A.C. et al. (2004), Exigência de lisina para suínos em crescimento e terminação, alimentados com rações de baixo teor de proteína, formuladas de acordo com o conceito de proteína ideal. Acta Scien.,26, 537-542
Newman, D .J., Price, C. P. (1999), Renal function and nitrogen metabolites. In-Tietz Textbook of Clinical Chemistry, ed. C. A. Burtis, E. R. Ashwood. W.B. Saunders Company, Philadelphia, pp.1204-1270. Oliveira, G.C., Moreira, I., Furlan, A.C. et al. (2004),
Efeito das dietas de baixo teor de proteína bruta, suplementadas com aminoácidos, para leitões machos castrados (15 a 30 kg). Rev. Soc. Bras. Zoot., 33,
1747-1757 (Supl. 1).
Ollivier, L. (1998), Genetic improvement of the pig. In-The Genetics of the Pig, ed. M.F. Rothschild, A. Ruvinsky. CAB international, New York, pp.511-540.
Patience, J.F., Austic, R.E., Boyd, R.D. (1987), Effect of dietary electrolyte balance on growth and acid-base status in swine, J. Anim. Sci., 64, 457-466.
Penz Junior, A.M. (1996), O conceito de proteína ideal para monogástricos. Paper presented at Congresso Internacional de Zootecnia, Porto Alegre, Rio Grande do Sul.
Rostagno, H. S., Albino, L. F. T., Donzele, J. L. et al. (2005), Tabelas Brasileiras para Aves e Suínos: Composição de Alimentos e Exigências Nutricionais. Departamento de Zootecnia/UFV, Viçosa.
Tuitoek, K., Young, L.G., de Lange, D.F.M., Kerr, B.J. (1997), The effect of reducing excess dietary amino acids on growing-finishing pig performance: an evaluation of the ideal protein concept. J. Anim. Sci.,
75, 1575-1583.