Ciência Rural, v.48, n.3, 2018.
Post-weaning feeding levels on feeding behavior, growth and
development in Holstein dairy heifers
Efeito dos níveis de alimentação pós-desmame sobre o comportamento ingestivo, crescimento e desenvolvimento em novilhas leiteiras da raça Holandês
Emanuel De La Quintana1 Alejandro Mendoza1, 2* Cecilia Cajarville3 Oscar Bentancur4 José Luis Repetto2
ISSNe 1678-4596
Received 12.09.16 Approved 01.08.18 Returned by the author 02.22.18
INTRODUCTION
The rearing of dairy heifers has a significant importance in the total costs of the farm, and it can represent the second source of expenses following the costs associated with the feeding of lactating cows (HEINRICHS, 1993). However, in the Southern region of America, this activity is generally disregarded in dairy farms, and this leads to long periods of life of the animals that involve spending and investing without generating incomes. In a field
survey conducted in Uruguay, COSTA et al. (2010) reported that age at first calving of heifers was 33.2 months, ranging from 29 to 39 months; although, some authors have reported that extending the age of first calving above 24 months reduces life-time milk production (CURRAN et al., 2013).
Although, there is not a single explanation for the slow growth evidenced by heifers in our country, it is probably related to the feeding levels that animals receive during this stage. For example, COSTA et al. (2010) reported that native pastures 1Programa de Producción de Leche, Instituto Nacional de Investigación Agropecuaria, Ruta 50 km 12, 70002, Colonia, Uruguay. E-mail:
[email protected]. *Corresponding author.
2Departamento de Bovinos, Facultad de Veterinaria, Universidad de la República, San José, Uruguay. 3Departamento de Nutrición, Facultad de Veterinaria, Universidad de la República, San José, Uruguay.
4Departamento de Biometría, Estadística y Computación, Facultad de Agronomía, Universidad de la República, Paysandú, Uruguay.
ABSTRACT: To study the effect of post-weaning feeding levels on the growth of dairy heifers, 40 animals with 77.7 ± 8.1 days of age and 77.5 ± 9.2kg of body weight were grouped in 10 pens, and each pen was randomly assigned to one of the following treatments for 120 days: feeding level to achieve a body weight gain of 600 (TMEDIUM) or 800 (THIGH) g/day based on a total mixed ration. After this period all heifers were managed as a single group for 150 days. Nutrient intake, behavior, body weight and other morphological measures were recorded in each animal. As a result of the experimental design THIGH heifers had a higher nutrient intake than TMEDIUM heifers, which was reflected in a higher daily weight gain, withers height, heart girth and hip width. However, treatments had no effect on these traits during the residual period.
Key words: heifer, feeding level, growth.
RESUMO: Para estudar o efeito dos níveis de alimentação pós-desmame sobre o crescimento de novilhas da raça Holandês, 40 animais com 77,7 ± 8,1 dias de idade e 77,5 ± 9,2kg de peso corporal foram agrupados em 10 canetas, sendo que cada caneta foi aleatoriamente designada para um dos seguintes tratamentos por 120 dias: nível de alimentação para atingir um ganho de peso corporal de 600 (TMEDIO) ou 800 (TALTO) g/dia com base em uma ração total misturada. Após este período, todas as novilhas foram tratadas como um único grupo por 150 dias. A ingestão de nutrientes, o comportamento animal, o peso corporal e outras medidas morfológicas foram registrados em cada animal. Como resultado do delineamento experimental, as novilhas TALTO tiveram maior ingestão de nutrientes do que as novilhas TMEDIO, o que refletiu em maior ganho diário de peso corporal, altura dos gomos, circunferência do coração e largura do quadril. No entanto, os tratamentos não tiveram efeito sobre estas variáveis durante o período residual.
Palavras-chave: novilha, nível de alimentação, crescimento.
were the basis for feeding heifers in their study, occupying an average of 49% of the total available area, which suggests that these animals may not fulfill their nutrient requirements. This could have a negative effect on their growth and development, with negative consequences on long-term performance.
Increasing the feeding level in the prepubertal stage of these heifers can have positive effects on different traits, such as an earlier attainment of puberty (BORTONE et al., 1994) or increased milk production at first lactation (SOBERON & VAN AMBURGH, 2013). However, when high-energy diets are used in an attempt to achieve high weight gains before puberty, there is an excessive fat deposition that could adversely affect the mammary gland development (SILVA et al., 2002). For example, WELLER et al. (2016) reported that 3-month old heifers fed to achieve an average daily weight gain (ADWG) of 1.0kg had a higher mammary fat pad mass and a lower mammary parenchyma mass than heifers with an ADG of 0.5kg.
For this reason, it has been suggested that for Holstein cows with an adult weight of around 630kg, the maximum ADWG that animals could achieve in the prepubertal stage without compromising their future performance would be between 800 to 900g (ZANTON & HEINRICHS, 2005). However, if heifers are simultaneously provided with an adequate level of protein this may minimize the adverse effects of feeding a high amount of energy. Recently, ALBINO et al. (2015) reported that in prepuberal heifers fed to achieve an ADWG of 1000g, using a low dietary metabolisable protein: metabolizable energy ratio induced an excessive fat accumulation in the parenchymal area of mammary gland compared with higher ratios. This may explain why heifers can achieve higher ADWG than those recommended by ZANTON & HEINRICHS (2005) without having an impaired mammary development (SILVA et al., 2002).
Therefore, an experiment was carried out to gain insight and quantify the direct and residual effects of different post-weaning feeding levels on behavior and performance of dairy heifers.
MATERIALS AND METHODS
Location, selection of animals and experimental design
The experiment was carried out at the Experimental Station of the National Agricultural Research Institute (Colonia, Uruguay). Forty Holstein calves, born during March at the Dairy Unit and with
no record of diseases during the nursing stage were used. After weaning calves had 77.7 ± 8.1 days of life, and weighed 77.5 ± 9.2kg (average ± standard deviation) and were put together into groups of 4, trying to be homogeneous with respect to age and live weight. Each group was randomly assigned to one of two treatments, resulting in 5 repetitions (pens) of 4 animals per treatment. The following treatments were evaluated for 120 consecutive days: feeding level to achieve an ADWG of 600g/d (TMEDIUM), or feeding level to achieve an AGWD of 800g/d (THIGH).
Each group of 4 animals was handled in a pen with an area of 100m² per animal, with a water trough and a collective feeder, and were fed with a total mixed ration (TMR) which was the same for all treatments (Table 1). The TMR was supplied once a day at 1000h. To achieve the desired results, the amount of TMR offered to each group was adjusted (to be totally consumed) fortnightly according to the weight and age of the animals in each one. After the treatments were applied, all animals were managed as a single group for 150 consecutive days. During this residual period the animals were fed pastures based on alfalfa (Medicago
sativa) with a DMI equivalent to 3% of LW and a forage
availability of not less than 1500kg DM/ha. They were also offered a commercial concentrate, which was offered at a rate of 1% of LW (on a fresh matter basis), and alfalfa haylage ad libitum (Table 1).
Measurements
During the treatment period, the nutrient intake of each pen was recorded every 2 months (i.e. at the middle and at the end of that period) during 4 consecutive days, as the difference between the amount of feed offered and refused (if any) in 24 hours. A composite sample of the TMR offered and orts was taken each day, and were dried at 60°C for 48h, ground to 1 mm, and analyzed for: DM, ash, CP (AOAC, 1990; methods 934.01, 942.05, and 955.04, respectively); NDF using heat stable α-amylase and sodium sulfite; ADF (VAN SOEST et al., 1991), expressed exclusive of residual ash. Organic matter was determined as the difference between DM and ash content. The metabolizable energy (ME) content was estimated using the equations proposed by the NRC (2001). During the treatment period the DM intake rate (DMIR) was determined every 2 months (i.e. at the middle and at the end of that period) for 2 consecutive days each time. The DMIR was estimated as the difference between the amount of DM offered and refused every 2 hours during 8 consecutive hours after 1000h.
middle and at the end of that period), for 2 consecutive days each time. Behaviors were recorded by 2 observers for 8 consecutive hours after 1000h, using scan sampling of all animals in each treatment as the sampling rule, and instantaneous sampling as the recording rule, and with a sample interval of 4 minutes (MARTIN & BATESON, 1993). The 2 observers were trained together before each recording period to get familiarized with the ethogram and to test the consistency across them in the evaluation of the behaviors. Behaviors were defined as follows: eating (the animal ingests and chews TMR), ruminating (the animal chews regurgitated feed bolus), drinking (the animal has the mouth inside the water trough), resting while standing (the animal does not perform any obvious activity while maintaining an upright position with legs extended), resting while lying (the animal does not perform any obvious activity and is lying on the floor), and others (does not perform any of the activities described). Results of each behavior were expressed as a fraction of the total observations per 2 hours.
During the treatment period, the LW of every animal was recorded every 15 days using a digital scale (True test, EC2000, Auckland, New Zealand), and withers height, hips height, hips width, and heart girth were measured using a measuring tape. During the residual evaluation period the same measurements were taken every 30 days.
Statistical analysis
The results were analyzed with pen as the experimental unit (ST-PIERRE, 2007), and were conducted using SAS (SAS Institute Inc., Cary, NC, USA). Data from the treatment period and the residual period were analyzed separately. Covariate adjustments were made only when the same parameters as those being adjusted were available at the beginning of the experiment (ROBINSON et al., 2006).
Weight data and body measurements were analyzed by linear regression with a model that included the following effects: treatment (1 degree of freedom [df]), the day of measurement (as a continuous independent variable) (1df), the interaction of treatment per day of measurement (1df), pen nested within treatment, and animal nested within pen x treatment. These two last effects were considered random. Values measured at the beginning of the experiment were used as a covariate for the respective trait. Effects of the treatments on regression slopes of the fitted lines were evaluated as described by KAPS & LAMBERSON (2004).
Nutrient intake was analyzed with a mixed linear model (mixed procedure) that included the fixed effect of treatment (1df) and the random effect of pen nested within treatment. The Kenward-Rogers procedure was used to adjust the denominator degrees of freedom, and the error term used for testing the
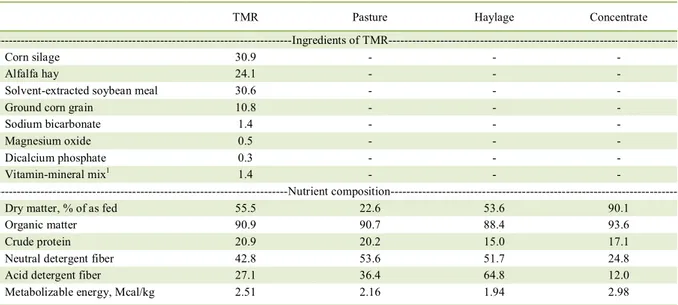
Table 1 - Ingredients and nutrient composition of TMR, pasture, haylage and concentrate (% of dry matter, unless otherwise indicated).
TMR Pasture Haylage Concentrate
---Ingredients of
TMR---Corn silage 30.9 - - -
Alfalfa hay 24.1 - - -
Solvent-extracted soybean meal 30.6 - - -
Ground corn grain 10.8 - - -
Sodium bicarbonate 1.4 - - -
Magnesium oxide 0.5 - - -
Dicalcium phosphate 0.3 - - -
Vitamin-mineral mix1 1.4 - - -
---Nutrient composition---
Dry matter, % of as fed 55.5 22.6 53.6 90.1
Organic matter 90.9 90.7 88.4 93.6
Crude protein 20.9 20.2 15.0 17.1
Neutral detergent fiber 42.8 53.6 51.7 24.8
Acid detergent fiber 27.1 36.4 64.8 12.0
Metabolizable energy, Mcal/kg 2.51 2.16 1.94 2.98
1Provided (per kg of dry matter): 230g of Ca; 20 g of Mg; 120g of Na; 180g of Cl; 3,2 of Cu; 9,8g of Zn; 5,9g of Mn; 355000IU of vitamin
treatment effect was treatment by group was pen nested within treatment.
Behavioral data were analyzed as repeated measures with logistic regression with the GLIMMIX procedure assuming an AR(1) covariance structure. The model included the effects of: treatment (1df), time of measurement (3df), interaction between treatment and moment of measurement (3df), pen nested within treatment, animal nested within pen x treatment, and time of measurement nested x pen nested within treatment. Pen nested within treatment, animal nested within pen x treatment, and time of measurement nested x pen nested within treatment were random effects whereas all others were considered fixed. The error term used for testing the treatment effect was treatment by group was pen nested within treatment. The Kenward-Rogers procedure was used to adjust the denominator degrees of freedom.
Dry matter intake rate was analyzed as repeated measures with a mixed linear model (MIXED procedure) assuming an AR(1) covariance structure, that included the same effects reported in the previous model. Pen nested within treatment, animal nested within pen x treatment, and time of measurement nested x pen nested within treatment were random effects whereas all others were considered fixed. The error term used for testing the treatment effect was treatment by group was pen nested within treatment.
Means were compared with a Tukey test. Data from 2 TMEDIUM calves and 2 THIGH calves were removed from the analysis because they died
or became ill due to causes unrelated to treatments. Statistical significance was established with P≤0.05, and trends were discussed when 0.05<P≤0.10.
RESULTS AND DISCUSSION
As a result of the experimental design, THIGH consumed an average of 46% more DM, and 45% more CP and ME than TMEDIUM during the treatment period (Table 2). Treatments had a significant effect on behavior of the animals. In the measurements performed at day 60 and 120 of the treatment period, the proportion of time spent eating tended to be higher in THIGH than TMEDIUM (Table 3). It should be noted that in both treatments and periods of measurements, after an initial feeding session were all animals spent a high proportion of available time eating, it sharply decreased thereafter (Figure 1). Particularly during measurements recorded at day 120 of the treatment period, average proportion of time eating at hour 6 after the initial feeding was less than 0.04 in both treatments. Conversely, average proportion of available time spent ruminating was low in both treatments and periods of measurements.
In both periods, DMIR was higher in THIGH than TMEDIUM (Table 3). In the measurements performed at day 60 of the treatment period, DMIR decreased similarly as the feeding session progressed in both treatments, but in the measurements performed at day 120 of this period, DMIR decreased more rapidly in THIGH than
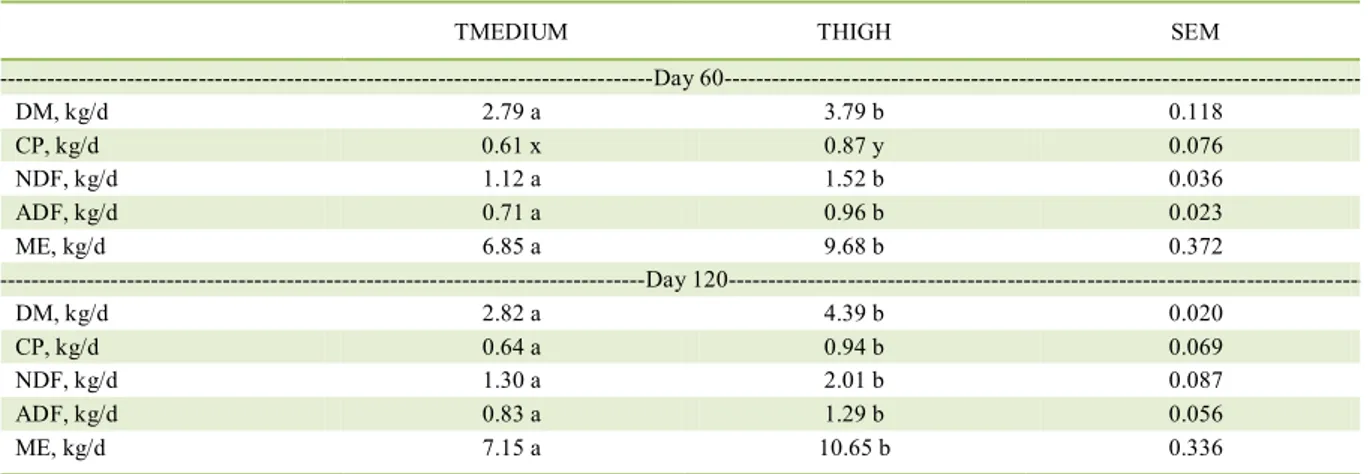
Table 2 - Nutrient intake at day 60 and 120 from the beginning of the experiment.
TMEDIUM THIGH SEM
---Day
60---DM, kg/d 2.79 a 3.79 b 0.118
CP, kg/d 0.61 x 0.87 y 0.076
NDF, kg/d 1.12 a 1.52 b 0.036
ADF, kg/d 0.71 a 0.96 b 0.023
ME, kg/d 6.85 a 9.68 b 0.372
---Day
120---DM, kg/d 2.82 a 4.39 b 0.020
CP, kg/d 0.64 a 0.94 b 0.069
NDF, kg/d 1.30 a 2.01 b 0.087
ADF, kg/d 0.83 a 1.29 b 0.056
ME, kg/d 7.15 a 10.65 b 0.336
Different letters in the same row indicate significant differences between treatments (P < 0.01). Different letters in the same row indicate
significant differences between treatments (P < 0.10). TMEDIUM = feeding level to achieve a weight gain of 600g/d; THIGH = feeding
level to achieve a weight gain of 800g/d; SEM = standard error of the mean; DM = dry matter; CP = crude protein; NDF = neutral detergent
TMEDIUM (Figure 1). In this experiment, heifers were limit-fed with a single nutrient-dense TMR to achieve the preplanned ADWG, which was offered once a day, as a result, animals consumed the TMR very quickly and in a short period in both treatments. This feeding pattern is coincident with that reported by KITTS et al. (2011) for heifers fed with a similar system. A high DMIR has been negatively correlated with ruminal pH (GIGER-REVERDIN, 2017), and MOODY et al. (2007) reported a lower mean pH in heifers that were limit-fed with a TMR with a low compared with a high forage content. However, the effect of the high DMIR recorded at the beginning of the feeding session, especially in THIGH, coupled with the low proportion of available time ruminating, on the prevalence of subacute ruminal acidosis and nutrient digestion in the present experiment is unknown and deserves additional research.
Treatments had no effect on the other behavioral traits but during the measurements performed at day 120 of the treatment period, an interaction between treatment and time of measurement for resting while standing was detected (Table 3). In both treatments, the proportion of this behavior was low at the beginning of the feeding session and increased progressively, reaching its peak between 7 and 8 hours after the TMR supply. However, during hours 1 and 2 this proportion was higher in TMEDIUM than THIGH (0.066±0.003 and 0.006±0.004, respectively).
Despite this, it is noteworthy that in both treatments, the proportion of time that the animals spent resting while standing increased rapidly from the first hours after the TMR supply, which may be indicative of a restricted feed supply, as well as an indicator of poor animal welfare (GRETER et al., 2015). Other authors have reported this behavior in heifers managed with a restricted feed supply, and observed that these animals vocalize more frequently, possibly as a sign of hunger (HOFFMAN et al., 2007).
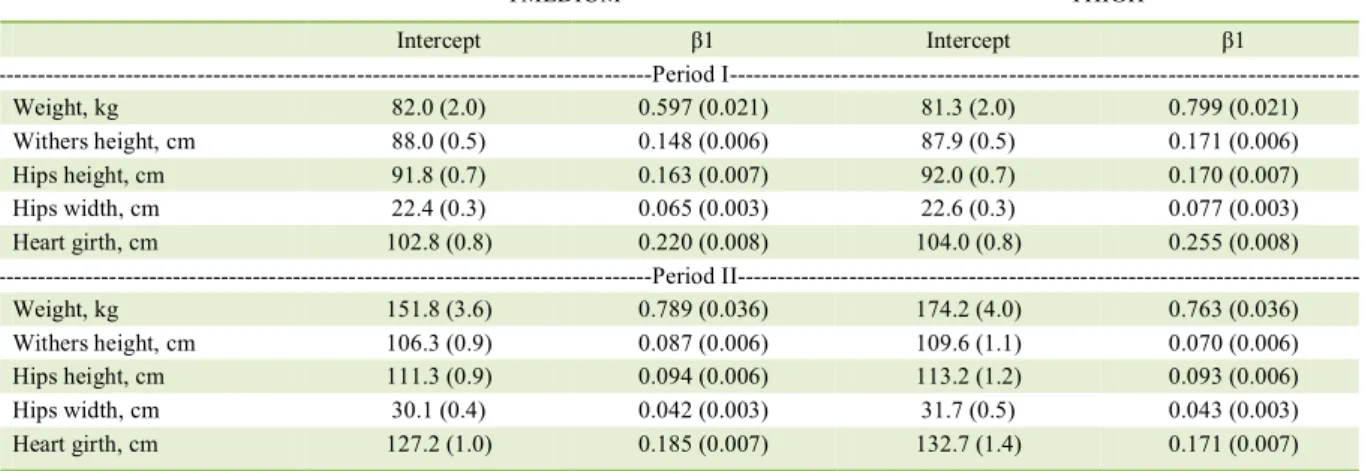
As expected, the ADWG was lower for TMEDIUM than THIGH (597 vs. 799g/day), and also the rate of gain of withers height, hearth girth and hips width were greater in THIGH than in TMEDIUM (Table 4 and 5). Weight gains observed in this study are higher than those reported in a survey in Uruguay carried out by COSTA et al. (2010), which were 416g/d, and this may be because the main feed given to the animals in the latter study was low-quality native pastures, whereas in our study we offered a TMR adjusted specifically to fulfill the nutrient requirements of the heifers. Our results are coincident with ABENI et al. (2000), who fed 150kg heifers for 7 months with contrasting nutrient levels and observed a higher ADWG, as well as higher withers height and heart girth in animals handled with a greater nutrient supply. Higher growth and development in THIGH compared to TMEDIUM during the treatment application period is directly related to the
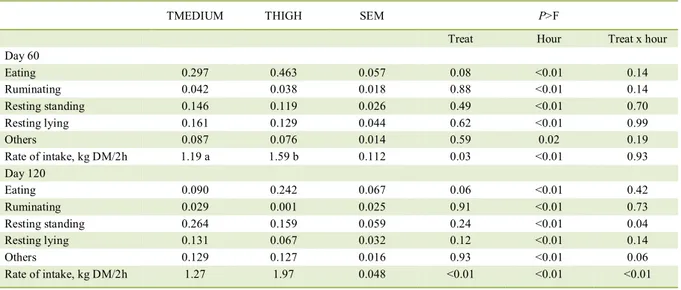
Table 3 - Behavioral variables (expressed as a proportion of total observations per 2h) and rate of intake of dry matter (DM) at day 60 and
120 from the beginning of the experiment.
TMEDIUM THIGH SEM P>F
Treat Hour Treat x hour
Day 60
Eating 0.297 0.463 0.057 0.08 <0.01 0.14
Ruminating 0.042 0.038 0.018 0.88 <0.01 0.14
Resting standing 0.146 0.119 0.026 0.49 <0.01 0.70
Resting lying 0.161 0.129 0.044 0.62 <0.01 0.99
Others 0.087 0.076 0.014 0.59 0.02 0.19
Rate of intake, kg DM/2h 1.19 a 1.59 b 0.112 0.03 <0.01 0.93
Day 120
Eating 0.090 0.242 0.067 0.06 <0.01 0.42
Ruminating 0.029 0.001 0.025 0.91 <0.01 0.73
Resting standing 0.264 0.159 0.059 0.24 <0.01 0.04
Resting lying 0.131 0.067 0.032 0.12 <0.01 0.14
Others 0.129 0.127 0.016 0.93 <0.01 0.06
Rate of intake, kg DM/2h 1.27 1.97 0.048 <0.01 <0.01 <0.01
TMEDIUM = feeding level to achieve a weight gain of 600g/d; THIGH = feeding level to achieve a weight gain of 800g/d; SEM = standard
higher nutrient intake in that treatment. In addition, increased nutrient intake stimulates hepatic IGF-I secretion, which promotes body growth through cell proliferation stimulation in most cells in the animal body, including muscles and bones (KOPCHICK &
CIOFFI, 1991), and several authors have reported that prepubertal heifers handled with a higher feeding level have higher concentrations of plasma IGF-I (LAMMERS et al., 1999). It is noteworthy that THIGH not only had a greater weight gain but also a
Figure 1 - Dry matter (DM) intake rate of heifers during the measurements performed at day 60 (A) or 120 (B) of the treatment period, and eating behavior (expressed as a proportion of total observations per 2h) during the measurements performed at day 60 (C) or 120 (D) of the treatment period. TMEDIUM = feeding level to achieve a body weight gain of 600g/d; THIGH = feeding level to achieve a body weight gain of 800g/d. Vertical bars represent ± mean standard error . In each time-point, at least one difference between treatments (P <0.05) is indicated with an asterisk.
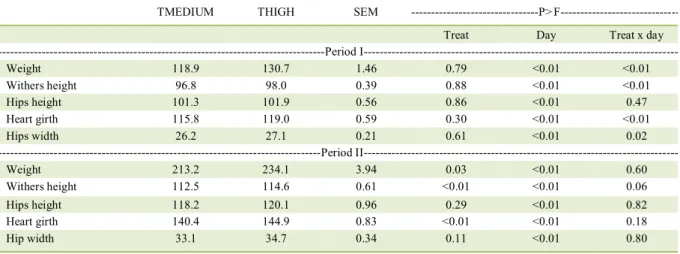
Table 4 - Body weight and morphological variables measured during the treatment period (period I) or during the residual period (period II).
TMEDIUM THIGH SEM ---P>F
---Treat Day Treat x day
---Period
I---Weight 118.9 130.7 1.46 0.79 <0.01 <0.01
Withers height 96.8 98.0 0.39 0.88 <0.01 <0.01
Hips height 101.3 101.9 0.56 0.86 <0.01 0.47
Heart girth 115.8 119.0 0.59 0.30 <0.01 <0.01
Hips width 26.2 27.1 0.21 0.61 <0.01 0.02
---Period
II---Weight 213.2 234.1 3.94 0.03 <0.01 0.60
Withers height 112.5 114.6 0.61 <0.01 <0.01 0.06
Hips height 118.2 120.1 0.96 0.29 <0.01 0.82
Heart girth 140.4 144.9 0.83 <0.01 <0.01 0.18
Hip width 33.1 34.7 0.34 0.11 <0.01 0.80
TMEDIUM = feeding level to achieve a weight gain of 600g/d; THIGH = feeding level to achieve a weight gain of 800g/d; SEM = standard
greater body development than TMEDIUM during the treatment period. Therefore, this higher growth would not have negatively affected the development of the mammary gland, which is coincident with the values recommended by ZANTON & HEINRICHS (2005).
However, there was no effect of the treatments on the gain of weight and other morphological traits during the residual period, except for the withers height, which tended to be higher in TMEDIUM compared to THIGH (Table 4 and 5). This lack of differences may be due to the fact that during this period all animals had access to the same feed supply, so it could be supposed that feed intake and hence the supply of precursors to support body growth would also have been similar between treatments. In opposition to our results, LAMMERS et al. (1999) reported that; although, dairy heifers managed with a high feeding level between weeks 19 and 39 of life had a higher weight gain and a higher wither and hips height during the treatment period than heifers managed with a low feeding level, the latter gained more weight between week 39 and calving, suggesting that these animals may have experienced compensatory growth. Although, cattle exposed to a previous nutritional restriction can compensate a lower ADWG by growing at faster rates once they are offered a greater amount of feed (DROUILLARD et al., 1991), in our study this was not observed, and it is possible that the magnitude, the duration, or both, of the dietary restriction in TMEDIUM was not enough to elicit an acceleration of the ADWG characteristic of that compensatory growth.
In conclusion; although, a higher plane of nutrition applied after weaning for 4 months increased weight gain and body development of heifers, these effects did not persist during a residual period of 5 months when all animals were managed with the same feeding level. Limit feeding of heifers was an adequate tool to accurately provide the amount of feed needed to achieve preplanned weight gains, but the effects on animal behavior and eventually welfare need to be elucidated.
BIOETHICS AND BIOSSECURITY COMMITTEE APPROVAL
All procedures involving animals were approved by the Bioethics Committee on the Use of Animals of the National
Agricultural Research Institute (Protocol INIA 2015.40).
ACKNOWLEDGEMENTS
The authors thank Diego Appoloni, Agustina Bosch, Germán Noguera and Marcelo Pla for help with animal care. This work was supported by Instituto Nacional de Investigación Agropecuaria (INIA) (Project PL_07_0_00).
REFERENCES
ABENI, F. et al. Effects of daily gain in pre- and postpubertal replacement dairy heifers on body condition score, body size, metabolic profile, and future milk production. Journal of Dairy Science, v.83, p.1468-1478, 2000. Available from: <https://doi.
org/10.3168/jds.S0022-0302(00)75019-3>. Accessed: Oct. 6, 2016. doi: 10.3168/jds.S0022-0302(00)75019-3.
Table 5 - Equations for the evolution of weight and other morphological measurements during during the treatment period (period I) or
during the residual period (period II). Y = intercept + β1 x day. The values between brackets correspond to the standard error of
each parameter for the corresponding equation.
---TMEDIUM--- ---THIGH
---Intercept β1 Intercept β1
---Period
I---Weight, kg 82.0 (2.0) 0.597 (0.021) 81.3 (2.0) 0.799 (0.021)
Withers height, cm 88.0 (0.5) 0.148 (0.006) 87.9 (0.5) 0.171 (0.006)
Hips height, cm 91.8 (0.7) 0.163 (0.007) 92.0 (0.7) 0.170 (0.007)
Hips width, cm 22.4 (0.3) 0.065 (0.003) 22.6 (0.3) 0.077 (0.003)
Heart girth, cm 102.8 (0.8) 0.220 (0.008) 104.0 (0.8) 0.255 (0.008)
---Period
II---Weight, kg 151.8 (3.6) 0.789 (0.036) 174.2 (4.0) 0.763 (0.036)
Withers height, cm 106.3 (0.9) 0.087 (0.006) 109.6 (1.1) 0.070 (0.006)
Hips height, cm 111.3 (0.9) 0.094 (0.006) 113.2 (1.2) 0.093 (0.006)
Hips width, cm 30.1 (0.4) 0.042 (0.003) 31.7 (0.5) 0.043 (0.003)
Heart girth, cm 127.2 (1.0) 0.185 (0.007) 132.7 (1.4) 0.171 (0.007)
ALBINO, R.L. et al. Mammary gland development of dairy heifers fed diets containing increasing levels of metabolisable protein: metabolisable energy. Journal of Dairy Research,
v.82, p.113–120. 2015. Available from: <https://doi.org/10.1017/
S0022029914000697>. Accessed: Nov. 23, 2017. doi:10.1017/ S0022029914000697.
AOAC. Official Methods of Analysis. Arlington: AOAC International, 4 v.
BORTONE, E.J. et al. Growth of heifers fed 100 or 115% of
national research council to 1 year of age and then changed
to another treatment. Journal of Dairy Science, v.77,
p.270-277, 1994. Available from: <https://doi.org/10.3168/jds.S0022-0302(94)76951-4>. Accessed: Jun. 4, 2016. doi: 10.3168/jds.
S0022-0302(94)76951-4.
COSTA, M. et al. Custom rearing farms in Uruguay: Resource management and contractual alternatives [In Spanish]. Agrociencia
(Uruguay), v.14, p.66-76, 2010. Available from: <http://www. scielo.edu.uy/scielo.php?script=sci_issuetoc&pid=2301-154820100002&lng=es&nrm=iso>. Accessed: Aug. 23, 2016.
CURRAN, R.D. et al. Relationships between age at first calving; herd management criteria; and lifetime milk, fat, and protein
production in Holstein cattle. The Professional Animal Scientist,
v.29, p.1-9, 2013. Available from: <https://doi.org/10.15232/ S1080-7446(15)30188-1>. Accessed: Jul. 17, 2016. doi: 10.15232/
S1080-7446(15)30188-1.
DROUILLARD, J.S. et al. Compensatory growth following metabolizable protein or energy restrictions in beef steers. Journal of Animal Science, v.69, p.811-818, 1991. Available from:
<https://doi.org/10.2527/1991.692811x>. Accessed: Oct. 22, 2016. doi: 10.2527/1991.692811x.
GIGER-REVERDIN, S. 2017. Recent advances in the understanding of subacute ruminal acidosis (SARA) in goats, with focus on the link to feeding behavior. Small Ruminant Research (In Press). Available from: <http://dx.doi.org/10.1016/j.
smallrumres.2017.08.008>. Accessed: Nov. 15, 2017. doi: 10.1016/j.smallrumres.2017.08.008.
GRETER, A.M. et al. Short communication: Limit feeding affects behavior patterns and feeding motivation of dairy heifers. Journal of Dairy Science, v.98, p.1248–1254, 2015. Available from:
<http://dx.doi.org/10.3168/jds.2014-8879>. Accessed: Oct. 13, 2016. doi: 10.3168/jds.2014-8879.
HEINRICHS, A.J. Raising dairy replacements to meet the needs
of the 21st Century. Journal of Dairy Science, v.76,
p.3179-3187, 1993. Available from:
<https://doi.org/10.3168/jds.S0022-0302(93)77656-0>. Accessed: Nov. 1, 2016. doi: 10.3168/jds. S0022-0302(93)77656-0.
HOFFMAN, P.C. et al. Limit feeding of gravid Holstein heifers: Effect on growth, manure nutrient excretion, and subsequent early lactation performance. Journal of Dairy Science, v.90, p.946–954, 2007.
Available from: <https://doi.org/10.3168/jds.S0022-0302(07)71578-3>. Accessed: Jun. 14, 2016. doi: 10.3168/jds.S0022-0302(07)71578-3.
KAPS, M.; LAMBERSON, W.R. Biostatistics for animal science.
Wallingford : CABI Publishing, 2004. 445 p.
KITTS, B.L. et al. Effect of the provision of a low-nutritive feedstuff on the behavior of dairy heifers limit fed a high-concentrate ration.
Journal of Dairy Science, v.94, p.940-950, 2011. Available from:
<https://doi.org/10.3168/jds.2010-3767>. Accessed: Jun. 14, 2016.
doi: 10.3168/jds.2010-3767.
KOPCHICK, J.; CIOFFI, J. Exogenous and endogenous effects of growth hormone in animals. Livestock Production Science, v.27,
p.61-75, 1991. Available from:
<https://doi.org/6226(91)90046-S>. Accessed: Aug. 22, 2016. doi: 10.1016/0301-6226(91)90046-S.
LAMMERS, B. et al. The effects of accelerated growth rates and estrogen implants in prepubertal Holstein heifers on estimates of mammary development and subsequent reproduction and milk production. Journal of Dairy Science, v.82, p.1753-1764,
1999. Available from: <https://doi.org/10.3168/jds.S0022-0302(99)75406-8>. Accessed: Jul. 9, 2016. doi: 10.3168/jds.
S0022-0302(99)75406-8.
MARTIN, P.; BATESON, P. Measuring behavior: an introductory
guide. 2 ed. Cambridge: Cambridge University Press, 1993. 222 p.
MOODY, M.L. et al. Nutrient utilization of differing forage-to-concentrate ratios by growing Holstein heifers. Journal of Dairy Science, v.90, p.5580–5586, 2007. Available from: <https://
doi.org/10.3168/jds.2007-0570>. Accessed: Nov. 22, 2017. doi: 10.3168/jds.2007-0570.
NRC. National Research Council. Nutrient requirements of dairy cattle. 7 ed. Washington: National Academy Press, 2001. 381p.
ROBINSON, P.H. et al. Some experimental design and statistical criteria for analysis of studies in manuscripts submitted for consideration for publication. Animal Feed Science and Technology, v.129, p. 1–11, 2006. Available from: <https://doi.
org/10.1016/j.anifeedsci.2006.05.011>. Accessed: Nov. 23, 2017. doi: 10.1016/j.anifeedsci.2006.05.011.
SILVA, L.F.P. et al. Short communication: Relationship between body growth and mammary development in dairy heifers. Journal of Dairy Science, v.85, p. 2600-2602, 2002. Available from:
<https://doi.org/10.3168/jds.S0022-0302(02)74344-0>. Accessed: Nov. 14, 2017. doi: 10.3168/jds.S0022-0302(02)74344-0.
SOBERON, F.; VAN AMBURGH, M. Lactation biology symposium: The effect of nutrient intake of preweaned dairy calves on lactation milk yield as adults: A meta-analysis of current
data. Journal of Animal Science, v.91, p.706-712, 2013. Available
from: <https://doi:10.2527/jas2012-5834>. Accessed: May 30,
2016. doi: 10.2527/jas2012-5834.
ST-PIERRE, N.R. Design and analysis of pen studies in the animal
sciences. Journal of Dairy Science, v.90(E. Suppl.), p.E87–E99,
2007. Available from: <https://doi.org/10.3168/jds.2006-612>.
Accessed: Nov. 23, 2017. doi: 10.3168/jds.2006-612.
VAN SOEST, P.J. et al. Methods for dietary fiber, neutral detergent fiber, and nonstarch polysaccharides in relation to animal nutrition.
Journal of Dairy Science, v.74, p.3583-3597, 1991. Available from:
<https://doi.org/10.3168/jds.S0022-0302(91)78551-2>. Accessed: Nov. 14, 2017. doi: 10.3168/jds.S0022-0302(91)78551-2.
WELLER, M. M. D. C. A. et al. Effects of nutrient intake level on mammary parenchyma growth and gene expression in crossbred (Holstein × Gyr) prepubertal heifers. Journal of Dairy Science, v.99,
p.9962–9973, 2016. Available from:
ZANTON, G.I.; HEINRICHS, A.J. Meta-analysis to assess effect of prepubertal average daily gain of Holstein heifers on
first-lactation production. Journal of Dairy Science, v.88,