of dairy heifers of different breed compositions
Carlos Alberto Alves Oliveira Filho(1), Fernanda Samarini Machado(2), Alexandre Lima Ferreira(2),
Thierry Ribeiro Tomich(2), Rogério Martins Maurício(3), Mariana Magalhães Campos(2), Camilla Flávia
Portela Gomes da Silva(4), José Augusto Gomes de Azevêdo(5) and Luiz Gustavo Ribeiro Pereira(2)
(1)Universidade Estadual do Sudoeste da Bahia, BR 415, Km 03, s/no, Campus Universitário, CEP 45700-000 Itapetinga, BA, Brazil.
E-mail: carlos.uesb@hotmail.com (2)Embrapa Gado de Leite, Avenida Eugênio do Nascimento, no 610, CEP 36038-330 Juiz de Fora,
MG, Brazil. E-mail: fernanda.machado@embrapa.br, axellfire@hotmail.com, thierry.tomich@embrapa.br, mariana.campos@embrapa.br,
luiz.gustavo@embrapa.br (3)Universidade Federal de São João del-Rei, Praça Dom Helvécio, no 74, Campus Dom Bosco, CEP 36301-160
São João del Rei, MG, Brazil. E-mail: rogeriomauricio@ufsj.edu.br (4)Instituto Federal de Educação, Ciência e Tecnologia Baiano, BR 420,
s/no, CEP 45320-000 Santa Inês, BA, Brazil. E-mail: camilla.silva@si.ifbaiano.edu.br (5)Universidade Estadual de Santa Cruz, Rodovia
Jorge Amado, Km 16, CEP 45662-900 Ilhéus, BA, Brazil. E-mail: zeguto00@gmail.com
Abstract – The objective of this work was to evaluate the effects of nutritional plans and breed composition on nutrient intake and digestibility, nitrogen balance, and performance of dairy heifers in tropical conditions. Thirty-six heifers – 12 Holstein, 12 Gyr, and 12 Gyrolando F1 (½ Holstein × ½ Gyr) – were housed in a tie-stall system and randomly distributed, adopting a completely randomized design in a 3×3 factorial arrangement (nutritional plans and breed composition). The diets were formulated to enable weight gains of 200, 400, and 800 g per day, corresponding to the nutritional plans 11, 14, and 19 g kg-1 body weight (BW), respectively. The intake of dry matter, fibrous fractions (g kg-1 BW-0.75), and metabolizable energy (kcal-1 BW-0.75) in the
11-g kg-1 plan were greater for Gyr heifers than for Gyrolando and Holstein heifers. Ether extract digestibility
was 13.85% higher for Gyr heifers compared with Gyrolando F1 in the 19-g kg-1 plan. The increase in the
nutritional plans shows a quadratic response to nutrient intake and a linear response to average daily gain,
but does not affect the digestibility coefficients. Gyr and Gyrolando F1 heifers present similar nutritional efficiency to that of Holstein heifers.
Index terms: Gyr, Gyrolando, ingestion, nitrogen balance, weight gain.
Planos alimentares no consumo, na digestibilidade e no desempenho
de novilhas leiteiras de distintos grupos raciais
Resumo – O objetivo deste trabalho foi avaliar os efeitos do plano alimentar e do grupo racial sobre o consumo e a digestibilidade de nutrientes, o balanço de nitrogênio e o desempenho de novilhas leiteiras em condições tropicais. Trinta e seis novilhas – 12 Holandês, 12 Gir e 12 Girolando F1 (½ Holandês × ½ Gir) – foram alojadas em sistema “tie-stall” e distribuídas aleatoriamente, tendo-se adotado delineamento inteiramente casualizado, em arranjo fatorial 3x3 (planos alimentares e grupos raciais). As dietas foram formuladas para possibilitar ganhos de peso de 200, 400 e 800 g por dia, correspondentes aos planos alimentares de 11, 14 e 19 g kg-1 de
peso corporal (PC), respectivamente. As novilhas Gir dentro do plano de 11 g kg-1 consumiram mais matéria seca, fração fibrosa (g kg-1 de PC-0,75) e energia metabolizável (kcal de PC-0,75) do que as novilhas Girolando
e Holandês. A digestibilidade do extrato etéreo foi 13,85% superior para as novilhas Gir, em comparação às Girolando F1 no plano de 19 g kg-1. O aumento do plano nutricional tem efeito quadrático no consumo de nutrientes e linear no ganho de peso médio diário, mas não influencia o coeficiente de digestibilidade. Novilhas Gir leiteiras e Girolando F1 apresentam eficiência nutricional semelhante à das novilhas Holandês.
Termos para indexação: Gir, Girolando, ingestão, balanço de nitrogênio, ganho de peso.
Introduction
Monitoring dairy heifer growth rates during the
rearing period to optimize efficiency and productivity
gains, as well as reducing age at puberty, may
represent a strategy to reduce production costs in dairy farming.
favoring the efficient use of nutrients by the animal,
can generate economic and quality returns in milk production systems, since feeding the herd is the most important cost of production (Collard et al., 2000).
In the third edition of BR-Corte, the Brazilian table of nutritional requirements for pure and crossbred Zebu cattle (Valadares Filho et al., 2016), the prediction of dry matter (DM) intake was increased by 8% for the Holstein breed and by 4% for crossbred animals of the Holstein and British breeds, according to the adjustments proposed by Fox et al. (1988) and present in NRC (2000). However, the table does not include information for dairy Zebu animals.
DM intake is the main determinant of animal performance (Waldo & Jorgense, 1981), and the effect of genotypes on this characteristic has already been shown for at least one of the variables related to intake or performance in dairy cows (Beecher et al., 2014). However, it is not known whether the effect of genotypes on these variables covers all categories of animals, such as growing heifers.
Information on the nutritional and performance parameters of Zebu, Taurine and Crossbred females, reared in tropical conditions, is necessary to determine the nutritive value of diets, energy partition, and nutrition requirements. These data are fundamental for the establishment of nutrition requirements for dairy animals, aiming to guide the formulation of more
accurate diets, improving the bioeconomic efficiency
of milk production systems.
In Brazil, the animals most adapted to the tropical environment make it possible to produce milk at a lower cost. Although about 80% of the milk produced in the country comes from cows with the Gyr and Holstein breeds in their genetic composition (Silva et al., 2016), national producers still use data from international committees for the formulation and adjustment of diets, since the available information on the nutritional requirements of Zebu and Crossbred dairy animals is still scarce. Recently, the advances in the investigation of calorimetry-respirometry measurements for dairy cattle (Machado et al., 2016) made it possible to determine nutritional requirements and energy
efficiency without the need for animal sacrifice, one of
the limiting factors of this type of study due to the high cost of specialized animals for milk production.
The objective of this work was to evaluate the effects of the growth nutritional plans and breed composition
on the intake, digestibility, nitrogen balance, and performance of dairy heifers in tropical conditions.
Materials and Methods
The study was conducted in the bioenergetics laboratory, located at the multi-use complex for
livestock bioefficiency and sustainability, of Embrapa
Gado de Leite, in Coronel Pacheco, in the state of Minas Gerais, Brazil, from March to September 2014, during 171 consecutive days. All animal care and handling procedures were approved by the ethics committee on animal use of Embrapa Gado de Leite, protocol CEUA-EGL 01/2012.
Thirty-six heifers of different breed composition groups were used: 12 Holstein (H), 12 Gyr (G), and 12 Gyrolando F1 (½ Holstein × ½ Gyr). The initial body weight (BWi) was 402±88, 302±96, and 456±79 kg, respectively, for each composition. Throughout the study, heifers were housed in a tie-stall system with free access to water. They were fed a diet consisting of corn silage and concentrate with a forage:concentrate
ratio of 707:293 g kg-1, based on DM (Table 1).
The diet was formulated based on NRC... (2001), for a standard animal with average body weight of 370 kg and weight gain estimate of 800 g per day, and was given once daily at 9:00 a.m. A single diet was used, varying only the amount of feed offered to the animals,
with proportions of: 11, 14, and 19 g kg-1 body weight
(BW), which corresponded to the predicted weight gains of 200, 400, and 800 g per day, respectively.
The feed offered and refused was weighed to determine the total daily intake of DM during the experiment. The concentrate ingredients were collected for analysis, and representative samples of silage, concentrate, and orts were collected daily and pooled weekly for the chemical analysis.
During the experimental period, three digestibility trials were performed: at the beginning (53 days), at the middle (102 days), and at the end of the experimental period (151 days). The metabolizable energy (ME, in
Mcal kg-1) of the diets was calculated by the relationship
between ME intake (Mcal per day) and DM intake (kg
per day). Each digestibility assay lasted eight days: five
days of adaptation to the management and three days of total collection of faeces (Rotta et al., 2014).
on the first and second days of total collection of faeces,
using a Folley-type catheter (Valadares et al., 1997). After the second digestibility assay, at 110 days of the experimental period, the procedures to determine
the energy loss in the form of methane (CH4) by the
animals were started, in order to determine the ME of the diet. Two respirometric chambers were used,
adopting the procedures and system specifications
described by Machado et al. (2016).
The quantification of the energy loss by CH4
production was computed assuming the value of 9.45
kcal L-1 methane (Brouwer, 1965). ME intake was
determined by subtracting the gross energy (GE) of
faeces, urine, and CH4 from GE intake.
The partition of nitrogenous compounds was calculated by the difference between ingested nitrogen and excreted nitrogen in urine and faeces. Data on the consumption of DM, ME, and nutrients, as well as nitrogen balance were expressed as kg per day, g per day, kcal per day or Mcal per day, or in units relative to
live metabolic weight (kg BW)-0.75.
The intermediate weighings were performed every 15 days, for two consecutive days, always at 7:00 a.m. The mean daily weight gain (MDG) was determined as a function of the 171 experimental days. Feed
efficiency was calculated by the ratio between body
weight gain and DM intake.
The following parameters were determined: DM, by method 934.01 (Helrich, 1990); ash, by method 942.05 (Helrich, 1990); crude protein (BW), by method 984.13 (Helrich, 1990); and GE (Cunniff, 1995), all according
to Association of Official Analytical Chemists. Neutral detergent fiber (NDF) was obtained by the sequential
method of Van Soest et al. (1991), adapted to the conditions of the Ankom 220 apparatus, without the use of sodium sulphite and corrected for residual ash
(Mertens, 2002), acid detergent fiber (ADF) (Helrich,
1990), and ether extract (EE) [Helrich (1990), method 920.39]. The correction of NDF and ADF for nitrogen compounds, as well as the estimation of insoluble nitrogen in neutral detergent and acid detergent, followed the recommendations of Licitra et al. (1996).
Data was analyzed as a completely randomized design in a 3x3 factorial arrangment using the Mixed procedure of SAS, version 9.1.3 (SAS Institute, Cary, NC, USA), according to the model: Yij = M + Cov + Gi
+ Nj + GNij + εij, where M is the general mean; Cov is the effect of BWi on the intercept; Gi is the fixed effect of the breed composition group; Nj is the fixed effect of the food plan; GNij, the fixed effect of the interaction
between breed composition and the nutritional plan;
and εij is the random error. When the effect of the
interaction between breed composition and nutritional
plan was significant, decomposition was performed
and the averages for the breed composition group factor were compared by Tukey’s test, adopting the sum of the squares analysis in orthogonal contrasts related to linear and quadratic effects, at 5% probability.
Results and Discussion
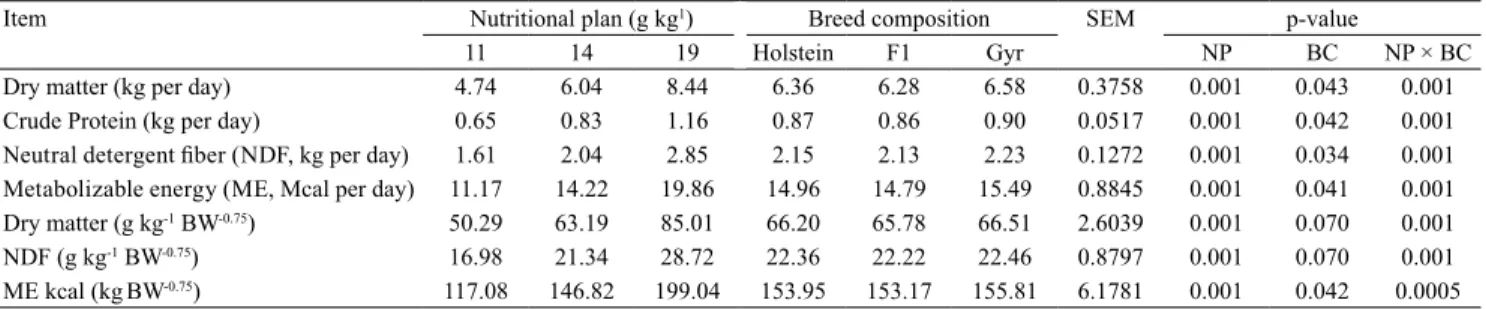
A significant interaction between the nutritional
plan and breed composition group was observed for DM, CP, and NDF intake, expressed in kg per day; DM
and NDF, in g kg-1 BW-0.75; and ME, expressed in Mcal
per day and kcal (kg BW-0.75) (Table 2).
In the 11-g kg-1 plan, the intake of DM and NDF
(g kg-1 BW-0.75) was, respectively, 2.56 and 3.98%; and
2.54 and 3.95% higher for Gyr heifers compared with Holstein and Gyrolando F1 heifers (Table 3). In this
plan, the intake of ME in kcal (kg BW-0.75) by Gyr
heifers was 5.01% higher than that by Gyrolando F1
heifers. In the 14 and 19-g kg-1 plans, the intakes of DM
Table 1. Formulation and chemical composition of the experimental diet.
Ingredient g kg-1
Corn silage 707.53
Ground corn 129.73
Soybean meal 156.58
Mineral mix(1) 3.67
NaCl 2.49
Chemical composition g kg-1
Dry matter 488.69
Crude protein 143.76
Ether extract 40.35
Neutral detergent fiber 347.84
Acid detergent fiber 217.61
Non-fibrous carbohydrates 407.65
Hemicellulose 130.23
Total carbohydrate 755.49
Ash 54.26
Mcal kg-1
Gross energy 4.14
Metabolizable energy 2.43
(1)Composition (minimum): 190 g kg-1 Ca; 60 g kg-1 P; 70 g kg-1 Na; 20 g
kg-1 Mg; 15 mg kg-1 Co; 700 mg kg-1 Cu; 1.600 mg kg-1 Mn; 19 mg kg-1 Se;
and NDF (g kg-1 BW-0.75) and ME in kcal (kg BW-0.75)
did not differ between Holstein, Gyrolando F1, and Gyr heifers.
DM intake is affected by several factors, among which BW is a determining one. Galyean & Hubbert (1992) observed that BW accounted for 59.8% of the DM intake variation in diets with net energy for
maintenance between 1.0 and 2.4 Mcal kg-1.
In the present study, the ME was 2.43 Mcal kg-1.
DM intake (g kg-1 BW-0.75) was higher for Gyr animals
in the 11-g kg-1 plan, probably due to their lower
initial BW. As the nutritional plans were fixed and
heifers were kept under the same environmental and management conditions, the variations found between breed composition groups were lower than 5.1% for
DM, NDF (g kg-1 BW-0.75), and ME kcal (kg BW-0.75)
intake (Table 3). DM and nutrient intake did not differ between breed composition groups.
Pancoti (2015) reported variation in DM intake of up to 37.02% in heifers of different genetic groups. Rennó et al. (2005) found variation of up to 27%
when working with young bulls. The lowest variation observed in the present study may be related to the number of animals evaluated (n = 12, for each breed composition group), which was higher than the number assessed in the mentioned studies (n = 6 and 4, respectively). It may also be related to the type of diet (silage × concentrate) and the different experimental strategies used to change the levels of intake.
The similar values between the breed composition groups for the consumption of DM, CP and NDF
(kg per day), DM and NDF (g kg-1 BW-0.75), and ME
in kcal (kg BW-0.75), obtained with the 14 and 19-g kg-1
plans (Table 3), indicate that Zebu animals can be
nutritionally more efficient under conditions of higher
nutritional restriction (nutritional plan with less availability of nutrients). However, in nutritional plans with greater availability of nutrients, Holstein, Gyr,
and crossbred animals show similar efficiency.
The quantitative increase in the nutritional plan resulted in a quadratic response for the intakes of: DM, CP, and NDF (kg per day); DM and NDF
Table 2. Intake of dry matter, crude protein, fibrous fraction, and metabolizable energy by Holstein, Gyrolando F1, and Gyr heifers(1).
Item Nutritional plan (g kg1) Breed composition SEM p-value
11 14 19 Holstein F1 Gyr NP BC NP × BC
Dry matter (kg per day) 4.74 6.04 8.44 6.36 6.28 6.58 0.3758 0.001 0.043 0.001
Crude Protein (kg per day) 0.65 0.83 1.16 0.87 0.86 0.90 0.0517 0.001 0.042 0.001
Neutral detergent fiber (NDF, kg per day) 1.61 2.04 2.85 2.15 2.13 2.23 0.1272 0.001 0.034 0.001
Metabolizable energy (ME, Mcal per day) 11.17 14.22 19.86 14.96 14.79 15.49 0.8845 0.001 0.041 0.001
Dry matter (g kg-1 BW-0.75) 50.29 63.19 85.01 66.20 65.78 66.51 2.6039 0.001 0.070 0.001
NDF (g kg-1 BW-0.75) 16.98 21.34 28.72 22.36 22.22 22.46 0.8797 0.001 0.070 0.001
ME kcal (kgBW-0.75) 117.08 146.82 199.04 153.95 153.17 155.81 6.1781 0.001 0.042 0.0005
SEM, standard error of the mean; NP, nutritional plan; and BC, breed composition group.
Table 3. Sliced interaction of the effect of the breed composition group within the nutritional plan, regarding the intake of
dry matter, crude protein, fibrous fraction, and metabolizable energy by Holstein, Gyrolando F1, and Gyr heifers(1).
Item 11 g kg1 14 g kg1 19 g kg1
Holstein F1 Gyr Holstein F1 Gyr Holstein F1 Gyr
Dry matter (kg per day) 4.62b 4.37b 5.25a 5.96a 5.86a 6.30a 8.50a 8.62a 8.10a
Crude protein (kg per day) 0.63b 0.60b 0.72a 0.82a 0.80a 0.87a 1.17a 1.18a 1.12a
Neutral detergent fiber (NDF, kg per day) 1.56b 1.48b 1.78a 2.01a 1.98a 2.13a 2.88a 2.91a 2.77a
Metabolizable energy (ME, Mcal per day) 10.86b 10.30b 12.36a 14.02a 13.79a 14.84a 20.01a 20.29a 19.28a
Dry matter (g kg-1 BW-0.75) 50.09b 49.40b 51.37a 63.11a 62.60a 63.85a 85.41a 85.33a 84.30a
NDF (g kg-1 BW-0.75) 16.92b 16.69b 17.35a 21.32a 21.15a 21.57a 28.86a 28.83a 28.47a
ME(Mcal per day) 10.86b 10.30b 12.36a 14.02a 13.79a 14.84a 20.01a 20.29a 19.28a
ME kcal (kgBW-0.75) 116.6b 114.5b 120.2a 146.6a 145.0a 148.8a 198.6a 200.0a 198.5a
(g kg-1 BW-0.75); and ME in Mcal per day and kcal
(kg BW-0.75), regardless of the breed composition group
evaluated (Table 4). The results presented high and
close coefficients of determination for both models. The coefficient of determination (R2), considered in
isolation, is not an adequate criterion for the discussion
of model fit, since, in nonlinear models, it is common
to obtain asymptotic and high R2 values with little
variation (Cerrato & Blackmer, 1990). As to the choice of the best model, it is preferable to opt for the nonlinear model, due to its greater practicality related to the ease of interpretation of parameters a and b.
The interaction between the nutritional plan and breed composition group for the digestibility
coefficients was significant only for EE (Table 5). In
the nutritional plan with 11 and 14 g kg-1, Holstein,
Gyr and Gyrolando F1 heifers did not differ regarding
EE digestibility. For the 19-g kg-1 plan, Gyr heifers
presented EE digestibility similar to that of Holstein
heifers (870.28 vs 828.96 g kg-1); and these values
were 13.85% higher than that of the Gyrolando F1
heifers (764.39 g kg-1). This variation of 13.85% in
EE digestibility was higher than that observed by Rennó et al. (2005), who reported a 6.8% variation in EE utilization, in steers of different genetic groups (Holstein, ½Holstein × Guzerá, ½Holstein × Gyr, and pure Zebu). Beecher et al. (2014) found variations of 2.3, 2,8, and 3%, for DM, organic matter, and NDF digestibility in Jersey, crossbred Jersey × Holstein × Friesian, and Holstein × Friesian cows fed perennial ryegrass. The authors attributed the superiority of the Jersey animals, in the evaluated digestive parameters, to their relatively larger gastrointestinal tract (GIT), as well as to the higher frequency and number of chews and rumination (Prendiville et al., 2010).
The increase in the relative size of the GIT indicates that there will be greater area available for nutrient absorption, which will allow greater absorption of nutrients and, therefore, increase the digestibility (Van Soest, 1994). Chewing already plays a physical role in the digestion of feed (McAllister et al., 1994). In the present study, the frequency and time spent in the intake process, and the size and weight of the organs of the GIT were not evaluated. Therefore, the digestibility of the nutrients cannot be inferred from the isolated effect of the genetic base of the animals. For this reason, it is suggested that the measurement
of these parameters be done in future studies to Ta
b le 4 . E ff ec t o f t he nu tr iti on al pl an w ith in th e br ee d com po sit io n gr ou p on th e in ta ke of dr y m at te r, to ta l p ro tei n, fib ro us fr ac tio n, me ta bo liz ab le ene rg y, an d n it ro g e n b al a n ce b y H o ls tei n , G y ro la n d o F 1 , a n d G y r h ei fe rs (1). Item Holstein p-value F1 p-value Gyr p-value Equation R 2 L Q Equation R 2 L Q Equation R 2 L Q Intake
Dry matter (kg per day)
Y= -1.32 + 4.89x + 0.39x²
0.88
0.001
0.008
Y= -4.02 + 9.35x – 0.91x²
0.87
0.001
0.005
Y= -2.68 + 6.07x – 0.47x²
0.68
0.001
0.005
T
otal protein (kg per day)
Y= -0.18 + 0.67x + 0.06x²
0.88
0.001
0.001
Y= -0.55 + 1.29x – 0.12x²
0.87
0.001
0.005
Y= -0.40 + 0.88x – 0.08x²
0.68
0.001
0.006
NDF (kg per day)
Y= -0.43 + 1.63x + 0.14x²
0.88
0.001
0.006
Y= -1.37 + 3.19x – 0.32x²
0.86
0.001
0.004
Y= -0.91 + 2.06x – 0.16x²
0.68
0.001
0.006
ME (Mcal per day)
Y= -3.16 + 1
1.61x + 0.89x²
0.88
0.001
0.001
Y= -9.48+ 22.06x – 2.17x²
0.86
0.001
0.004
Y= -6.32 + 14.29x – 1.1
1x²
0.68
0.001
0.006
Dry material (g kg
-1 BW
-0.75
)
Y= -3.20 + 46.84x + 1.03x²
0.99
0.001
0.001
Y= -8.45 + 56.18x – 1.76x²
0.99
0.001
0.001
Y= -10.31 + 54.26x – 2.67x²
0.96
0.001
0.001
NDF (g kg
-1 BW
-0.75
)
Y= -1.07+ 15.80x + 0.36x²
0.99
0.001
0.001
Y= -2.86 + 18.98x – 0.60x²
0.99
0.001
0.001
Y= -3.54 + 18.41x – 0.93x²
0.96
0.001
0.001
ME kcal (kg BW
-0,75
)
Y= -3.62 + 104.47x + 4.02x²
0.98
0.001
0.001
Y= -9.14+ 1
14.61x + 2.34x²
0.98
0.001
0.001
Y= -9.61 + 105.29x + 1.70x²
0.96
0.001
0.001
Nitrogen balance
N ingested (g per day)
Y= 1
10.04 - 13.99x + 17.53x²
0.79
0.001
0.001
Y= 97.36 + 21.42x + 9.77x²
0.79
0.001
0.004
Y= 49.27 + 35.48x
0.64
0.001
0.759
N faecal (g per day)
Y= 39.01 - 13.81x + 7.77x²
0.71
0.001
0.001
Y= 31.52 – 2.49x + 5.87x²
0.76
0.001
0.015
Y=14.66 + 9.14x
0.55
0.001
0.244
N retained (g per day)
Y= 88.01 - 53.29x + 21.67x²
0.54
0.001
0.024
Y= 31.75 + 25.21x
0.39
0.004
0.477
Y=23.02 + 14.46x
0.19
0.015
0.475
N ingested (g kg
-1 BW
-0.75
)
Y= 1.1
1 - 0.02x + 0.1
1x²
0.95
0.001
0.001
Y= 1.07 + 0.09x + 0.09x²
0.95
0.001
0.001
Y= 0.80 + 0.32x
0.86
0.001
0.969
N faecal (g kg
-1 BW
-0.75
)
Y= 0.39 - 0.10x + 0.06x²
0.80
0.001
0.004
Y= 0.34 - 0.05x + 0.05x²
0.81
0.001
0.028
Y= 0.23 + 0.09x
verify the magnitude of the effect of genotypes on the digestibility of diet components.
The breed composition groups responded differently to the nutritional plan used, with respect
to the EE digestibility coefficient. This variable
decreased linearly with the increase in diet supply (Y = 925.89 - 90.93x, p=0.002) in Gyrolando F1 heifers (Table 6). In Gyr heifers, a quadratic response was observed (Y = -1,402.61 - 826.81x + 271.66x², p=0.034); and, in Holstein heifers, there was no linear or quadratic adjustment, with an average value of 810.27
g kg-1. It is expected that digestibility decrease with
the increase in DM intake due to the higher passage rate and the lower retention time of the nutrients by the rumen microorganisms (NRC, 2001). Similarly, lower DM intake is generally associated with greater nutrient use (NRC, 2001).
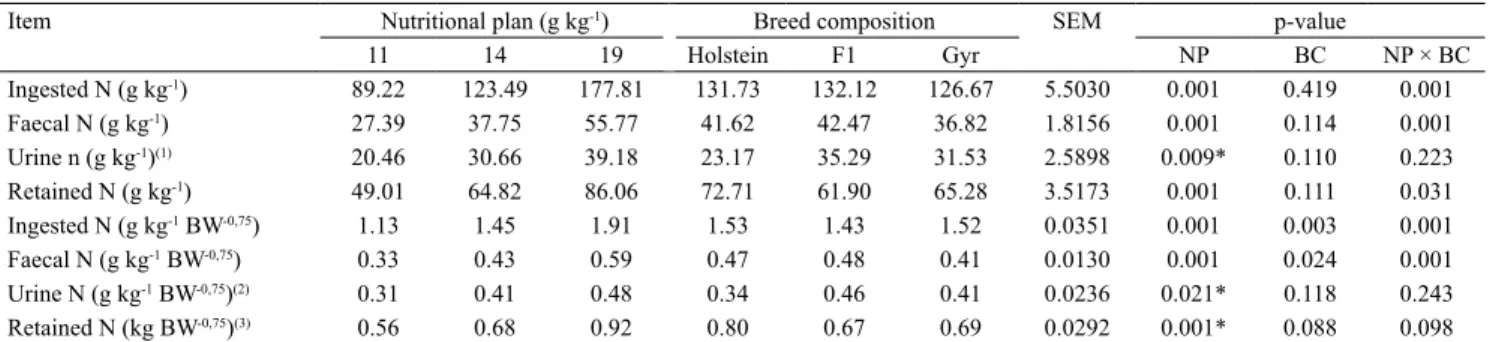
The interaction between the nutritional plan and
breed composition group was significant for the retained
N (g per day), but the effect of breed composition group
was not significant within each nutritional plan (Table
7). This result suggests that the breed composition of the animals does not interfere with N balance. In the
11 and 14-g kg-1 plans, DM intake and faecal excretion
of N (g per day and g kg-1 BW-0.75) did not differ among
the different breed composition groups evaluated.
However, for the 19-g kg-1 plan, Gyrolando F1 and
Holstein heifers presented higher intake (14.35%) and excretion (19.16%) of N compared with Gyr heifers.
The lower values of DM intake and faecal N excretion
by Gyr heifers in the 19-g kg-1 plan, in addition to the
similar N values (g per day), indicate that Zebu cattle
seem to be more efficient in the use of dietary N.
This probably resulted in greater N recycling under nutritional plans with greater availability of nutrients, since the pool of urea in the metabolism is under physiological homeostatic control and tends to remain constant, according to Van Soest (1994).
Table 5. Nutrient and gross energy digestibility coefficients for Holstein, Gyrolando F1, and Gyr heifers subjected to nutritional plans, with different nutrient availibility(1).
Item Nutritional plan (g kg-1) Breed composition SEM p-value
11 14 19 Holstein F1 Gyr NP BC NP × BC
Dry matter (g kg-1) 713.00 704.61 701.25 712.72 702.88 703.41 3.1439 0.303 0.363 0.097
Organic matter (g kg-1) 737.96 727.87 720.50 733.28 725.52 727.54 3.1063 0.076 0.554 0.059
Gross energy (g kg-1) 719.17 708.54 701.95 713.77 704.68 711.20 3.2299 0.101 0.562 0.065
Crude protein (g kg-1) 721.96 712.35 702.61 707.40 704.55 724.98 3.5741 0.102 0.290 0.073
NDF (g kg-1) 491.57 478.20 485.31 490.25 490.17 474.66 6.1737 0.682 0.752 0.674
Ether extract (g kg-1) 860.96 858.76 821.21 834.21 819.05 871.55 6.5521 0.014 0.073 0.019
NFC (g kg-1) 920.98 913.84 896.87 919.03 908.68 903.98 3.3523 0.010
L 0.187 0.126
(1)SEM, standard error of the mean; NP, nutritional plan; BC, breed composition group; NDF, neutral detergent fiber; and NFC, non-fibrous carbohydrates
(y = 975.21 - 35.86x).
Table 6. Nitrogen balance in Holstein, Gyrolando F1, and Gyr heifers subjected to nutritional plans, with different nutrient availibility.
Item Nutritional plan (g kg-1) Breed composition SEM p-value
11 14 19 Holstein F1 Gyr NP BC NP × BC
Ingested N (g kg-1) 89.22 123.49 177.81 131.73 132.12 126.67 5.5030 0.001 0.419 0.001
Faecal N (g kg-1) 27.39 37.75 55.77 41.62 42.47 36.82 1.8156 0.001 0.114 0.001
Urine n (g kg-1)(1) 20.46 30.66 39.18 23.17 35.29 31.53 2.5898 0.009* 0.110 0.223
Retained N (g kg-1) 49.01 64.82 86.06 72.71 61.90 65.28 3.5173 0.001 0.111 0.031
Ingested N (g kg-1 BW-0,75) 1.13 1.45 1.91 1.53 1.43 1.52 0.0351 0.001 0.003 0.001
Faecal N (g kg-1 BW-0,75) 0.33 0.43 0.59 0.47 0.48 0.41 0.0130 0.001 0.024 0.001
Urine N (g kg-1 BW-0,75)(2) 0.31 0.41 0.48 0.34 0.46 0.41 0.0236 0.021* 0.118 0.243
Retained N (kg BW-0,75)(3) 0.56 0.68 0.92 0.80 0.67 0.69 0.0292 0.001* 0.088 0.098
(1)Y
Urine N = 17.74 + 11.13x. (2)YUrine N = 0.2398 + 0.08x. (3)YRetained N = 0.340 + 0.187x. SEM, standard error of the mean; NP, nutritional plan; and BC, breed
The values of metabolizable protein for the
maintenance of 1.72 and 4.28 g kg-1 BW-0.75 for Nellore
and Holstein steers, respectively, obtained by Ezequiel (1987), suggest that the loss through excretion of
endogenous metabolites in Nellore cattle (Bos indicus)
is lower than that of Holstein cattle (Bos taurus). This
would be in alignment with the findings of the present
study, in which a lower faecal excretion of N (g kg-1
BW-0.75) in Gyr animals was observed (Table 7).
The variation of 17 and 38% for ingested and faecal
N (g kg-1 BW-0.75), respectively, was lower than the 32.9
and 46.3% variation reported by Pancoti (2015) in Holstein, Gyr and Gyrolando, fed the same diet. This can be attributed to the lower variation in CP intake, which, in the present study, was up to 4.65%, while in Pancoti (2015) it was 38.2%.
The losses of urinary N (g per day and g kg-1 BW-0.75)
were affected by the nutritional plan used (Table 6), which is in agreement with Higgs et al. (2012), who found that this variable is associated with N intake. Protein intake and N excretion by faeces and urine present high correlation (Sinclair et al., 2014). Increased N excretion in the urine due to increased CP ingestion (Table 4) and rapid ruminal degradation of N leads to ammonia production greater than the microbial demand for the nutrient in the rumen. This excess ammonia is absorbed in the rumen and converted to
urea in the liver, and results in increased plasmatic urea concentration. As the excess of N excreted in the urine is not desirable from the economic and environmental point of view, restrictive nutritional plans that do not cause great impact on animal performance are highly desirable.
When the breed composition group was analyzed separately, N losses presented some disparity with the values reported in the literature (Rennó et al., 2008). When different breed composition groups were subjected to the same diet and the same nutritional
plan, it was verified that losses of endogenous N (mmol
kg-1 BW-0.75) for Zebu were lower than those for Bos
taurus animals (Rennó et al., 2008). This suggests
that Zebu animals are more efficient in the use of N
than Taurine breeds. In the present study, the breed composition group had no effect on N losses via urine
(g per day and g kg-1 BW-0.75) (Table 6).
The quadratic response observed for the intake of DM and nutrients according to the nutritional plan (Table 4)
was also verified for faecal intake and excretion of N for
Holstein and Gyrolando F1 heifers. However, for Gyr heifers, there was an increasing linear response to DM intake and faecal excretion of N.
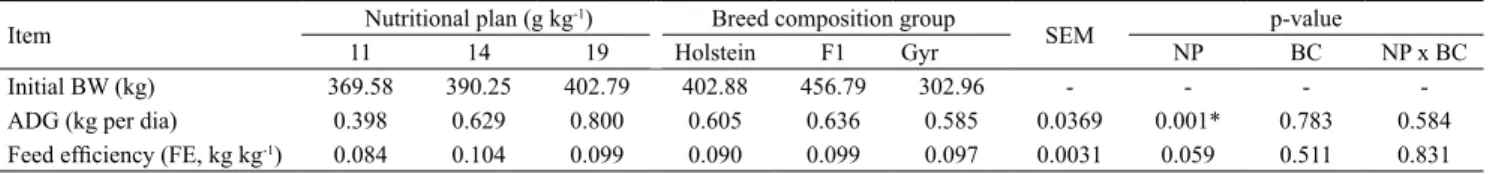
The ADG was affected by the nutritional plan (Table 8), regardless of the breed composition group evaluated, and increased linearly with the increase of
Table 7. Sliced interaction of the breed composition group within the nutritional plan, regarding nitrogen balance in Holstein, Gyrolando F1, and Gyr heifers(1).
Item 11 g kg
-1 14 g kg-1 19 g kg-1
Holstein F1 Gyr Holstein F1 Gyr Holstein F1 Gyr
Ingested N (g kg-1) 87.05a 83.23a 97.37a 121.47a 123.37a 125.62a 186.66a 189.75a 157.01b
Faecal N (g kg-1) 28.32a 25.56a 28.28a 36.77a 37.98a 38.51a 59.78a 63.87a 43.67b
Retained N (g kg-1) 50.14a 37.73a 55.63a 59.49a 64.98a 60.96a 110.2a 79.88a 78.10a
Ingested N (g kg-1 BW-0,75) 1.13a 1.13a 1.12a 1.45a 1.47a 1.43a 1.99a 1.99a 1.74b
Faecal N (g kg-1 BW-0,75) 0.35a 0.34a 0.31a 0.43a 0.44a 0.43a 0.62a 0.65a 0.48b
(1)Means followed by equal letters, in the comparison of breed composition groups in each nutritional plan, do not differ by Tukey’s test, at 5% probability.
Table 8. Performance of Holstein, Gyrolando F1, and Gyr heifers subjected to different nutritional plans in relation to body weight(1).
Item Nutritional plan (g kg
-1) Breed composition group
SEM p-value
11 14 19 Holstein F1 Gyr NP BC NP x BC
Initial BW (kg) 369.58 390.25 402.79 402.88 456.79 302.96 - - -
-ADG (kg per dia) 0.398 0.629 0.800 0.605 0.636 0.585 0.0369 0.001* 0.783 0.584
Feed efficiency (FE, kg kg-1) 0.084 0.104 0.099 0.090 0.099 0.097 0.0031 0.059 0.511 0.831
(1)SEM, standard error of the mean; NP, nutritional plan; BC, breed composition group; BW, body weight; and ADG, average daily weight gain
diet supply. Despite the differences in the intake of DM and nutrients among Holstein, Gyrolando F1, and Gyr heifers, the breed composition group did not affect
ADG. Feed efficiency also did not differ between
Holstein, Gyrolando F1, and Gyr heifers, nor between the nutritional plans.
The results of animal performance in the present study showed that the recommendations proposed by NRC (2001) for feeding of heifers of the Holstein breed, with 370 kg, also allow weight gains of 800 g per day for Zebu and crossbreed heifers subjected to a nutritional plan of higher DM and nutrient intake (19
g kg-1). In the absence of nutritional recommendations
for the formulation of diets for dairy haifers raised
in tropical conditions, these findings may be more
appropriate for crossbred females, since NRC (2000)
suggests that Bos taurus animals need more energy
for maintenance and weight gain than the Bos indicus,
with intermediate values for net energy requirements for the maintenance of crossbred animals (NRC, 2001).
Conclusions
1. The nutritional plans show a quadratic response to nutrient intake and a linear response to average daily
gain, but do not affect the digestibility coefficients.
2. In tropical conditions, Zebu (Gyr) and crossbred dairy heifers (Gyrolando F1) subjected to nutritional plans with more or less feed supply show nutritional
efficiency similar to that of Holstein heifers.
Acknowledgments
To Empresa Brasileira de Pesquisa Agropecuária (Embrapa), to Conselho Nacional de Desenvolvimento
Científico e Tecnológico (CNPq), to Fundação de
Amparo à Pesquisa do Estado de Minas Gerais (Fapemig), and to Coordenação de Aperfeiçoamento
de Pessoal de Nível Superior (Capes), for financial
support.
References
BEECHER, M.; BUCKLEY, F.; WATERS, S.M.; BOLAND, T.M.; ENRIQUEZ-HIDALGO, D.; DEIGHTON, M.H.; O’DONOVAN, M.; LEWIS, E. Gastrointestinal tract size, total-tract digestibility,
and rumen microflora in different dairy cow genotypes. Journal
of Dairy Science, v.97, p.3906-3917, 2014. DOI:
10.3168/jds.2013-7708.
BROUWER, E. Report of sub-committee on constants and factors. In: SYMPOSIUM ON ENERGY METABOLISM, 3rd, 1964, Scotland. Proceedings… London: Academic Press, 1965. p.441-443. (European Association for Animal Production. Publication nº 11).
CERRATO, M.E.; BLACKMER, A.M. Comparison of models for describing; corn yields response to nitrogen fertilizer. Agronomy
Journal, v.82, p.138-143, 1990. DOI: 10.2134/agronj1990.000219
62008200010030x.
COLLARD, B.L.; BOETTCHER, P.J.; DEKKERS, J.C.M.; PETITCLERC, D.; SCHAEFFER, L.R. Relationship between energy balance and health traits of dairy cattle in early lactation.
Journal of Dairy Science, v.83, p.2683-2690, 2000. DOI: 10.3168/
jds.S0022-0302(00)75162-9.
CUNNIFF, P. (Ed.). Official methods of analysis of AOAC
International. 16th ed. Washington: Association of Official
Analytical Chemistry, 1995. v. 1.
EZEQUIEL, J.M.B. Exigências de proteína e minerais de
bovídeos: frações endógenas. 1987. 131p. Tese (Doutorado) –
Universidade Federal de Viçosa, Viçosa.
FOX, D.G.; SNIFFEN, C.J.; O’CONNOR, J.D. Adjusting nutrient requirements of beef cattle for animal and environmental variations. Journal of Animal Science, v.66, p.1475-1495, 1988. DOI: 10.2527/jas1988.6661475x.
GALYEAN, M.L.; HUBBERT, M.E. Predicting intake by
beef cattle: relationship of dry matter intake to initial weight.
New Mexico: Agricultural Experiment Statiom, 1992. (Clayton Livestock Research Center Report, nº 80).
HELRICH, K. (Ed.). Official methods of analysis of the
Association of Official Analytical Chemist. 15th ed. Arlington:
Association of Official Analytical Chemists, 1990. 1117p.
HIGGS, R.J.; CHASE, L.E.; VAN AMBURGH, M.E. Development and evaluation of equations in the Cornell Net Carbohydrate and Protein System to predict nitrogen excretion in lactating dairy cows. Journal of Dairy Science, v.95, p.2004-2014, 2012. DOI: 10.3168/jds.2011-4810.
LICITRA, G.; HERNANDEZ, T.M.; VAN SOEST, P.J. Standardization of procedures for nitrogen fractionation of ruminant feeds. Animal Feed Science and Technology, v.57, p.347- 358, 1996. DOI: 10.1016/0377-8401(95)00837-3.
MACHADO, F.S.; TOMICH, T.R.; FERREIRA, A.L.; CAVALCANTI, L.F.L.; CAMPOS, M.M.; PAIVA, C.A.V.; RIBAS, M.N.; PEREIRA, L.G.R. Technical note: a facility for respiration measurements in cattle. Journal of Dairy Science, v.99, p.1-8, 2016. DOI: 10.3168/jds.2015-10298.
MCALLISTER, T.A.; BAE, H.D.; JONES, G.A.; CHENG, K.J. Microbial attachment and feed digestion in the rumen. Journal
of Animal Science, v.72, p.3004-3018, 1994. DOI:
10.2527/1994.72113004x.
MERTENS, D.R. Gravimetric determination of amylase-treated
neutral detergent fiber in feeds with refluxing in beaker or
NRC. National Research Council. Nutrient requirements of
beef cattle. 7th ed. Washington: National Research Council, 2000.
249p.
NRC. National Research Council. Nutrient requirements of
dairy cattle. 7th rev. ed. Washington: National Research Council,
2001. 381p.
PANCOTI, C.G. Exigências nutricionais de energia de
novilhas Gir, Holandês e F1 – Holandês x Gir. 2015. 121p.
Tese (Doutorado) – Universidade Federal de Minas Gerais, Belo Horizonte.
PRENDIVILLE, R.; LEWIS, E.; PIERCE, K.M.; BUCKLEY, F. Comparative grazing behavior of lactating Holstein-Friesian, Jersey, and Jersey × Holstein-Friesian dairy cows and its association
with intake capacity and production efficiency. Journal of Dairy
Science, v.93, p.764-774, 2010. DOI: 10.3168/jds.2009-2659.
RENNÓ, L.N.; VALADARES FILHO, S. de C.; PAULINO, M.F.; LEÃO, M.I.; VALADARES, R.F.D.; RENNÓ, F.P.; PAIXÃO, M.L. Níveis de uréia na ração de novilhos de quatro grupos genéticos: parâmetros ruminais, uréia plasmática e excreções de uréia e creatinina. Revista Brasileira de Zootecnia, v.37, p.556-562, 2008. DOI: 10.1590/S1516-35982008000300022.
RENNÓ, L.N.; VALADARES FILHO, S. de C.; VALADARES, R.F.D.; CECON, P.R.; BACKES, A.A.; RENNÓ, F.P.; ALVES, D.D.; SILVA, P.A. Níveis de uréia na ração de novilhos de quatro grupos genéticos: consumo e digestibilidades totais. Revista
Brasileira de Zootecnia, v.34, p.1775-1785, 2005. DOI: 10.1590/
S1516-35982005000500039.
ROTTA, P.P.; VALADARES FILHO, S.C.; DETMANN, E.; COSTA E SILVA, L.F.; PAULINO, M.F.; MARCONDES, M.I.; LOBO, A.A.G.; VILLADIEGO, F.A.C. Digesta sampling sites and marker
methods for estimation of ruminal outflow in bulls fed different
proportions of corn silage or sugar cane. Journal of Animal Science, v.92. p.2996-3006, 2014. DOI: 10.2527/jas.2013-7364.
SILVA, M.V.G.B.; MARTINS, M.F.; CEMBRANELLI, M. de A.R.; PANETTO, J.C. do C.; FREITAS, A.F. de; PAIVA, L. de C.; GONÇALVES, G.S.; ALVES, B.R.C. Programa de melhoramento genético da raça girolando – avaliação genética
de vacas – junho/2016. Juiz de Fora: Embrapa Gado de Leite,
2016. 40p. (Embrapa Gado de Leite. Documentos, 192).
SINCLAIR, K.D.; GARNSWORTHY, P.C.; MANN, G.E.; SINCLAIR, L.A. Reducing dietary protein in dairy cow diets: implications for nitrogen utilization, milk production, welfare and fertility. Animal, v.8, p.262-274, 2014. DOI: 10.1017/ S1751731113002139.
VALADARES FILHO, S.C; COSTA E SILVA, L.F.; GIONBELLI, M.P.; ROTTA, P.P.; MARCONDES, M.I.; CHIZZOTTI, M.L.; PRADOS, L.F. Exigências nutricionais de zebuínos puros e
cruzados: BR-CORTE. 3.ed. Viçosa: Ed. da UFV, 2016. p.163-190.
VALADARES, R.F.D.; GONCALVES, L.C.; RODRÍGUEZ, N.M.; SAMPAIO, I.B.; VALADARES FILHO, S.C. Metodologia de coleta de urina em vacas utilizando sondas de Folley. Revista
Brasileira de Zootecnia, v.26, p.1279-1282, 1997.
VAN SOEST, P.J. Nutritional ecology of the ruminant. 2nd ed. Ithaca: Cornell University Press, 1994. 476p.
VAN SOEST, P.J.; ROBERTSON, J.B.; LEWIS, B.A. Methods for
dietary fiber, neutral detergent fiber, and nonstarch polysaccharides
in relation to animal nutrition. Journal of Dairy Science, v.74, p.3583-3597, 1991. DOI: 10.3168/jds.S0022-0302(91)78551-2.
WALDO, D.R.; JORGENSEN, N.A. Forages for high animal production: nutritional factors and effects of conservation.
Journal of Dairy Science, v.64, p.1207-1229, 1981. DOI: 10.3168/
jds.S0022-0302(81)82697-5.