SCRS/2016/072 Collect. Vol. Sci. Pap. ICCAT, 73(8): 2911-2923 (2017)
FISHERY INDICATORS FOR THE SHORTFIN MAKO SHARK
(ISURUS OXYRINCHUS) CAUGHT BY THE PORTUGUESE PELAGIC LONGLINE
FISHERY IN THE ATLANTIC: NOMINAL CPUES, CATCH-SIZE AND
AT-HAULBACK MORTALITY
Rui Coelho1*, Daniela Rosa1 and Pedro G. Lino1SUMMARY
This paper provides an overview of fishery indicators for the shortfin mako shark captured by the Portuguese pelagic longline fishery in the Atlantic, in terms of catch-at-size, nominal CPUEs and at-haulback mortality. The analysis is based on data from fishery observers, port sampling and skippers logbooks (self sampling), from 1997-2015. In general, there was a large variability in the nominal CPUE trends for the north Atlantic, with a slight increase during the period. For the catch-at-size there were no major trends in the time series, but the sizes tended to be larger in the South Atlantic and with a larger variability. The at-haulback mortality was similar between sexes, with a trend for decreasing mortality rates with increasing specimen size. The data presented in this working document should be considered preliminary and is presented in preparation for the 2017 shortfin mako stock assessment in the Atlantic Ocean.
RÉSUMÉ
Le présent document a donné un aperçu des indicateurs de la pêche du requin-taupe bleu capturé par la pêcherie palangrière pélagique portugaise opérant dans l'Atlantique, en termes de prises par taille, CPUE nominale et mortalité à la remontée. L'analyse se fonde sur les données collectées par les observateurs des pêcheries, l’échantillonnage au port et les carnets de pêche des capitaines (auto-échantillonnage), entre 1997 et 2015. En général, il y a eu une grande variabilité dans les tendances de la CPUE nominale pour l'Atlantique Nord, avec une légère augmentation au cours de la période. Pour la prise par taille, aucune forte tendance ne s'est dégagée dans les séries temporelles, mais les tailles avaient tendance à être plus grandes dans l'Atlantique Sud et présentent une plus grande variabilité. La mortalité à la remontée était similaire entre les sexes, et une tendance a fait apparaître des taux de mortalité décroissante au fur et à mesure que la taille du spécimen augmentait. Les données présentées dans ce document de travail devraient être considérées comme préliminaires et sont présentées en vue de préparer l'évaluation de stock de requin-taupe bleu de 2017 dans l'océan Atlantique.
RESUMEN
En este documento se presenta una visión general de los indicadores pesqueros para el marrajo dientuso capturado por la pesquería de palangre pelágico portuguesa en el Atlántico, en términos de captura por talla, CPUE nominales y mortalidad durante la virada. El análisis se basó en datos recopilados por los observadores pesqueros, en los muestreos en puerto y en los cuadernos de pesca de los patrones (automuestreo), recopilados entre 1997 y 2015. En general, se observó una gran variabilidad en las tendencias de la CPUE nominal para el Atlántico norte, con un ligero aumento durante el periodo. Para la captura por talla no se constataron tendencias claras en la serie temporal, pero las tallas tendían a ser mayores en el Atlántico sur donde presentaban también una mayor variabilidad. La mortalidad durante la virada era similar para ambos sexos y se observó una tendencia descendente en las tasas de mortalidad a medida que se incrementaba la talla de los ejemplares. Los datos presentados en este documento de trabajo deberían considerarse preliminares. Dichos datos se presentan con miras a la preparación de la evaluación de stock del marrajo dientuso del Atlántico de 2017.
1 IPMA - Portuguese Institute for the Ocean and Atmosphere. Av. 5 de Outubro s/n, 8700-305 Olhão, Portugal. * Corresponding author: Rui Coelho; e-mail: rpcoelho@ipma.pt
KEYWORDS
At-haulback mortality, bycatch, catch-at-size, fishery indicators, nominal CPUE, pelagic longline fishery
1. Introduction
Pelagic sharks are commonly by-catch in pelagic longline fisheries (e.g., Mejuto et al., 2009; Coelho et al., 2012; Santos et al., 2014). The Portuguese pelagic longline fishery started in the late 1970’s. In the North Atlantic area the fishery started to develop mainly after 1986, while in the South Atlantic it gained importance after 1989 (Santos et al., 2002). The Portuguese fleet usually deploys a pelagic drift longline for targeting mainly swordfish (Xiphias gladius). Still, this is a multi-species fishery, where some other bony fishes as well as pelagic sharks (mainly blue shark Prionace glauca, and shortfin mako Isurus oxyrinchus) are frequently captured. In recent year, mostly as a consequence of changes on the market which increased the demand and value of shark products, there has been higher catches of pelagic sharks in the ICCAT Convention area.
These facts have raised wide-world concern and ICCAT has adopted a number of Recommendations and Resolutions regarding sharks. Moreover, the SCRS Shark working group has consistently been carrying out stock assessments for the main shark species, and has been addressing the need for improved data and biological information required to produce better assessments for the different shark species that are of concern to ICCAT. For 2017, the SCRS has planned to carry out a shortfin mako shark stock assessment. In preparation for that, preliminary fishery indicators have been requested to be provided by national scientists during 2016. As such, the aims of this paper are to present preliminary information on the catch-at-size distribution and time series, nominal CPUE series, and at-haulback mortality rates for the shortfin mako shark captured by the Portuguese pelagic longline fishery operating in the Atlantic Ocean.
2. Materials and methods
2.1 Data collection
The data used for this study was collected by IPMA (Portuguese Institute for the Ocean and Atmosphere) from several different sources, namely 1) fishery observers onboard Portuguese pelagic longline vessels, 2) landings on Portuguese ports, and 3) skippers logbooks (self sampling) voluntarily provided to IPMA.
The fishery observer data is usually the most complete and detailed, as apart from set data there is also the collection of individual information on the catch sizes and sex for all specimens. During the landings, detailed information is also collected, although due to some procedure logistics sometimes it is difficult to collected individual size and/or sex data for the major species caught (e.g. blue shark). The skippers’ logbooks have the data recorded and reported voluntarily by the vessel skippers, and usually also have detailed information regarding the catch, effort and location of the fishing sets. For some species, including the major fishery species (i.e. swordfish, tunas and sharks as blue and shortfin mako) detailed individual specimen information is usually also recorded, including individual specimen sizes or weights.
2.2 Data analysis
The data analyzed in this work refers to data from the fishery between 1997 and 2015 for the Atlantic Ocean. The CPUE analysis was restricted to the North Atlantic (separated by the 5ºN, as used in the ICCAT shark
In terms of catch-at-size, data from both hemispheres was analyzed. The size data was analyzed with exploratory size frequency plots and time series of the mean sizes in each stock. Size data was tested for normality with Kolmogorov-Smirnov tests with Lilliefors correction (Lilliefors, 1967) and for homogeneity of variances with Levene tests (Levene, 1960). Catch sizes were compared between years, quarters, sampling areas and stocks using non-parametric k-sample permutation tests (Manly, 2007) given that the data was not normally distributed and the variances were heterogeneous.
At-haulback mortality was calculated and compared between sexes with contingency tables and Pearson’s Chi-square tests. An exploratory GAM model was used to test for size related effects in the mortality rates. The effect of the specimen sizes in the odds-ratios of mortality was determined with a univariate Generalized Linear Model (GLM) with binomial error distribution and logit link function. The response variable was coded as a binary variable in which: 1 = specimen dead at-haulback and 0 = specimen alive at-haulback. The mortality odds-ratios of increasing 10cm FL in specimen size, with the respective 95% confidence intervals, were calculated.
Data analysis for this paper was carried out in the R language for statistical computing 3.2.0 (R Core Team, 2015). The plots were designed using library "ggplot2" (Wickham, 2009) and the maps using libraries "maps" (Richard et al., 2014), "maptools" (Bivand and Lewin-Koh, 2013), "mapplots" (Gerritsen, 2014) and "shapefiles" (Stabler, 2013). Additional libraries used in the analysis included "gam" (Hastie, 2015), "gmodels" (Warnes, 2013), "classInt" (Bivand, 2013), "nortest" (Gross and Ligges, 2012), "car" (Fox and Weisberg, 2011) and "perm" (Fay and Shaw, 2010).
3. Results and Discussion
3.1 Distribution and trends in the sizes
Size data for shortfin mako sharks was available for 17,356 specimens, with the sizes ranging between 50 and 340 cm FL.
The size distribution data was not normally distributed (Lilliefors test: D = 0.076, p-value < 0.001) and there was heterogeneity of variances between sampling areas (Levene test: F = 103.5; df = 4; p-value < 0.001), stocks (Levene test: F = 443.8; df = 1; p-value < 0.001) and quarters of the year (Levene test: F = 158.1; df = 3; p-value < 0.001). Significant differences in the size distributions were detected between years (Permutation test: chi2 =
3072.4; df = 17; p-value < 0.001), sampling areas (Permutation test: chi2 = 1377.3; df = 4; p-value < 0.001),
stocks (Permutation test: chi2 = 513.1; df = 1; p-value < 0.001), and quarters of the year (Permutation test: chi2 =
375.5; df = 3 p-value < 0.001).
Mapping the catch by size classes seems to indicate that the smaller specimens occur mostly in more temperate waters of both the north and south Atlantic, while the larger specimens are more captured in tropical and equatorial regions (Figure 1). This is similar to the patterns found for other pelagic sharks, as for example the blue shark (Coelho et al., 2015), but contrary to other pelagic species as for example the bigeye thresher (Fernandez-Carvalho et al., 2015).
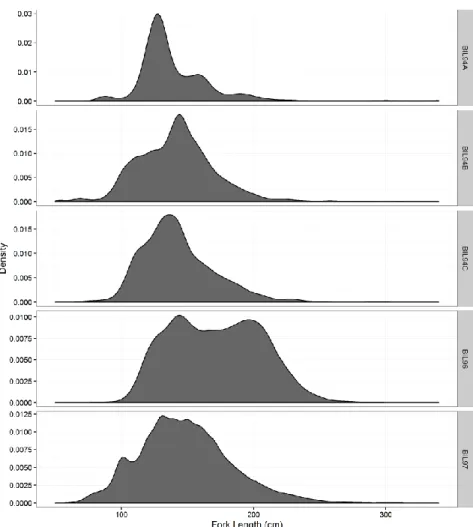
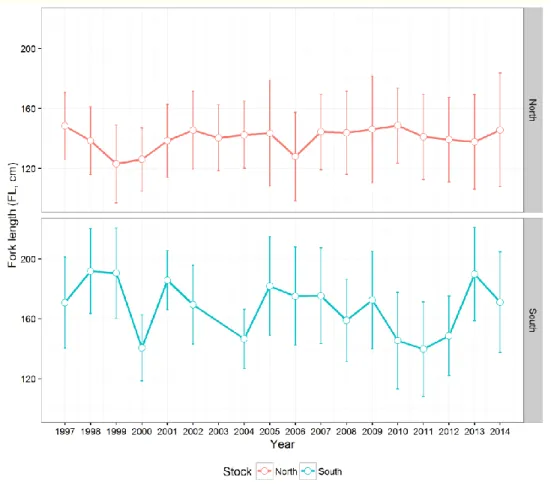
There was some variability observed in the size frequency distribution of shortfin mako sharks in the Atlantic regions. In some areas such as the BIL94C the size distribution was mostly unimodal, while in other areas such as BIL96 there was some evidence of bimodal distributions (Figure 2). This is an issue that will need further investigation in the future and a possible revision of the sampling areas, in order to define areas with more unimodal distributions of the size classes that can more easily be used in integrated stock assessment models. The time series of the catch at size distribution for the Portuguese fleet was mostly stable both for the north and south Atlantic stocks (Figure 3). However, in general, the variability was higher in the south Atlantic when compared to the north, and the mean sizes tended to be larger in the south (Figure 3). In terms of size frequencies distribution, there was some inter-annual variability but no evidence of any major trends towards smaller or larger sizes during the period for any of the two stocks (Figure 4).
3.2 Nominal CPUEs for the North Atlantic
The shortfin mako shark nominal CPUEs in the North Atlantic were mainly concentrated in temperate waters of the central north region west of the Azores islands, and also in more tropical waters of the northeast Atlantic, closer to the African continent (Figure 5). Such spatial distribution of the nominal CPUEs might be related with the species spatial and seasonal trends, but also with the spatial and seasonal dynamics of the fleet.
For the nominal CPUE time series there was a general and slight overall increase in the series between 1999 and 2015 (Figure 6). There is one year with very high CPUEs, specifically 2007. The interpretation of this nominal series and trends should be careful, as this CPUE series is not standardized and as such depends on the spatial and seasonal patterns of the fleet, as well as other fishery-dependant factors that can change between years. 3.4. At-haulback mortality
Detailed at-haulback mortality data was available for 1,613 specimens with sizes ranging between 66 and 305 cm FL. The overall at-haulback mortality rate was 36.6%.
The at-haulback mortality was very similar between sexes, specifically 36.5% for females and 37.2% for males, with these small differences statistically not significant (proportion test: Chi2 = 0.043; df = 1, p-value = 0.836)
By the contrary, specimen size influenced the at-haulback mortality rates, with the smaller specimens tending to have higher mortalities than the larger specimens (Figure 7) and with these trends similar for both sexes (Figure
8). Using a categorization of the size classes by the 0.2 quantiles, it was possible to detect significant differences
in the mortality rates (proportion test: Chi2 = 17.56; df = 4, p-value < 0.001).
In terms of odds ratios, it was possible to estimate that for each 10cm FL increase in the size of the sharks, the odds of being dead at time of haulback decreased 4.9%, with the 95% confidence intervals varying between 2.1% and 7.7%.
4. Final remarks
This working paper presents new data and information on fishery indicators from the catches of shortfin mako shark by the Portuguese pelagic longline fleet operating in the Atlantic Ocean, specifically in terms of catch-at-size distribution, time series trends, nominal CPUEs and at-haulback mortality.
The data and information presented in this document should be considered preliminary. An update of this work with final data and updated analysis, including the production of standardized CPUE series, will be prepared and presented for the 2017 ICCAT shortfin mako stock assessment session.
Acknowledgments
Sampling and data collection from the Portuguese fishery were mainly obtained and funded by PNAB -
Programa Nacional de Amostragem Biologica, within the scope of the EU Data Collection Framework (DCF).
The authors wish to thank the fishery observers for the onboard data collection, and the skippers for participating in the self sampling data collection program. Additional data and samples were obtained through project "MAKO-WIDE: A wide scale inter-hemispheric and inter-disciplinary study aiming the conservation of the
shortfin mako shark in the Atlantic Ocean (Ref FAPESP/19740/2014, funded by FCT and FAPESP)". Rui
Coelho is supported by an Investigador-FCT contract from the Portuguese Foundation for Science and Technology (FCT, Fundação para a Ciência e Tecnologia) supported by the EU European Social Fund and the Programa Operacional Potencial Humano (Ref: IF/00253/2014).
References
Bivand, R. 2013. classInt: choose univariate class intervals. R package version 0.1-21. http://CRAN.R-project.org/package=classInt.
Bivand, R., Lewin-Koh, N. 2013. maptools: Tools for reading and handling spatial objects. R package version 0.8-27. http://CRAN.R-project.org/package=maptools.
Coelho R., Fernandez-Carvalho J., Lino P.G. & Santos M.N. 2012. An overview of the hooking mortality of elasmobranchs caught in a swordfish pelagic longline fishery in the Atlantic Ocean. Aquatic Living
Resources, 25: 311-319.
Coelho, R., Mejuto, J., Domingo, A., Liu, K-M., Cortés, E., Yokawa, K., Hazin, F., Arocha, F., Silva, C., Mwilima, A.M., García-Cortés, B., Ramos-Cartelle, A.M., Lino, P.G., Forselledo, R., Mas, F., Ohshimo, S., Tsai, W-P-, Carvalho, F., Santos, M.N. 2015. Distribution patterns of the blue shark Prionace glauca in the Atlantic Ocean, from observer data of the major fishing fleets. Standing Committee on Research and
Statistics Document, SCRS/2015/039. 24pp.
Fay, M.P., Shaw, P.A. 2010. Exact and asymptotic weighted logrank tests for interval censored data: the interval R package. J. Stat. Softw., 36 (2): 1-34.
Fernandez-Carvalho, J., Coelho, R., Mejuto, J., Cortés, E., Domingo, A., Yokawa, K., Liu, K.M., García-Cortés, B., Forselledo, R., Ohshimo, S., Ramos-Cartelle, A.M., Tsai, W.P., Santos, M.N. 2015. Pan-Atlantic distribution patterns and reproductive biology of the bigeye thresher, Alopias superciliosus. Reviews in Fish
Biology and Fisheries, 25: 551–568.
Fox, J., Weisberg, S. 2011. An R Companion to Applied Regression, Second Edition. Thousand Oaks CA: Sage. Gerritsen, H. 2014. mapplots: Data Visualisation on Maps. R package version 1.5.
http://CRAN.R-project.org/package=mapplots.
Gross, J., Ligges, U. 2012. nortest: tests for normality. R package version 1.0-2. http://CRAN.R-project.org/package=nortest.
Hastie, T. 2015. gam: Generalized Additive Models. R package version 1.12. http://CRAN.R-project.org/package=gam
Levene, H. 1960. Robust tests for equality of variances. In: Olkin, I., Ghurye, S.G., Hoeffding, W., Madow, W.G., Mann, H.B. (Eds) Contributions to Probability and Statistics: Essays in Honor of Harold Hotelling. Stanford University Press, pp 278-292.
Lilliefors, H.W. 1967. On the Kolmogorov-Smirnov test for normality with mean and variance unknown. J Am
Statist Assoc, 62: 399-402.
Manly, B. 2007. Randomization Bootstrap and Monte Carlo Methods in Biology, 3rd ed. Chapman & Hall/CRC, New York.
Mejuto, J., García-Cortés, B., Ramos-Cartelle, A., Serna, J.M. 2009. Scientific estimations of by-catch landed by the Spanish surface longline fleet targeting swordfish (Xiphias gladius) in the Atlantic Ocean with special reference to the years 2005 and 2006. Collect Vol Sci Pap ICCAT, 64: 2455-2468.
R Core Team. 2015. R: A language and environment for statistical computing. R Foundation for Statistical Computing, Vienna, Austria. URL http://www.R-project.org/.
Richard, A. Becker, R.A., Wilks, A.R., Brownrigg, R., Minka, T.P. 2014. maps: Draw Geographical Maps. R package version 2.3-9. http://CRAN.R-project.org/package=maps.
Santos, M.N., Garcia, A. and Pereira, J.G. 2002. A historical review of the by-catch from the Portuguese surface long-line fishery: observations on blue shark (Prionace glauca) and short-fin mako (Isurus oxyrinchus). Col.
Santos, M.N., Coelho, R., Lino, P.G. & Fernandez-Carvalho, J. 2014. Preliminary observations on the elasmobranchs bycatch-at-size and sex-ratios on the Portuguese pelagic longline fishery in the Atlantic Ocean. Collect Vol Sci Pap ICCAT, 70(5): 2416-2432.
Stabler, B. 2013. shapefiles: read and write ESRI shapefiles. R package version 0.7. http://CRAN.R-project.org/package=shapefiles.
Warnes, G.R., Bolker, B., Lumley, T., Johnson, R.C. 2013 gmodels: various R programming tools for model fitting. R package version 2.15.4.1. http://CRAN.R-project.org/package=gmodels.
Figure 1. Location and catch-at-size (FL, cm) of the shortfin mako shark (Isurus oxyrinchus) recorded by the
Portuguese pelagic longline fleet in the Atlantic. The size classes are categorized by the 0.2 quantiles and colour coded. The ICCAT sampling areas for sharks (BIL areas) are represented. For visualization purposes, the data points are jittered by 1º * 1º degrees so the positions shown are approximate within each 1º *1º square degree.
Figure 2. Size-frequency distributions of shortfin mako sharks (Isurus oxyrinchus), caught in the ICCAT
Figure 3. Time series of the mean sizes of shortfin mako sharks (Isurus oxyrinchus) caught by the Portuguese
Figure 4. Variation of the yearly size-frequency distributions of shortfin mako sharks (Isurus oxyrinchus),
Figure 5. Map of the North Atlantic shortfin mako shark (Isurus oxyrinchus) nominal CPUEs (all years
combined, data between 1999 and 2015) in areas of operation of the Portuguese pelagic longline fleet. The squares are in 5*5º and the CPUEs are in Kg/1000 hooks.
Figure 6. Nominal CPUE series (Kg/1000 hooks) for shortfin mako shark (Isurus oxyrinchus) caught by the
Portuguese pelagic longline fishery in the North Atlantic Ocean, between 1999 and 2015. The error bars represent the 95% confidence intervals.
Figure 8. At-haulback mortality rates of shortfin mako shark (Isurus oxyrinchus) by size class (FL, categorized