2018
UNIVERSIDADE DE LISBOA
FACULDADE DE CIÊNCIAS
DEPARTAMENTO DE ENGENHARIA GEOGRÁFICA, GEOFÍSICA E ENERGIA
Community energy microgrids: the role of energy exchange
between prosumers
Maria Beatriz Piedade Moreira de Moura Ildefonso
Mestrado Integrado em Engenharia da Energia e do Ambiente
Dissertação orientada por:
Professor Alberto Borghetti
Professor Pedro Nunes
ii
Acknowledgements
I would like to thank ISA (Intelligent Sensing Anywhere) for providing me with the required data for this project.
To professor Alberto Borghetti for all the support during my stay in Bologna, for making me feel welcome and being available to help me and guide my project in the right direction. And of course, a huge thank you to Camilo and Stefano, without whom I wouldn’t have been able to succeed in the software conundrums.
To professor Pedro Nunes, for all the attention to my small (and not so small) mistakes, for helping me shape this dissertation from scratch, with all the patience it required.
To all my friends, the old ones and the new ones, for hearing me complain infinitely and encouraging me.
To my family, with whom I can always count on for motivation and support.
To my dear, for being the only one who can actually understand my thoughts and always be by my side.
iii
Abstract
In the European Union, the current energy paradigm promotes the deployment and integration of renewables, particularly of the distributed kind, as a way to increase the share of clean energy in the global energy mix. Investments made in this sense have simultaneously been allowing and leading towards the integration of energy produced at the local level on the distribution grid. Recent price drops in small and micro scale energy generation systems have allowed residential consumers to invest in small scale units for self-production. Due to its low maintenance requirements and modularity, photovoltaic panels are the preferred choice when it comes to small energy generation.
However, as solar energy alone cannot match all daily consumption needs, only by investments in energy storage units one can further decrease the dependency on the main grid. In this dissertation a second option is suggested – energy exchange between local prosumers in a smart microgrid.
The hypothesis was studied through the simulation, in AIMMS software, of an energy system intended to reproduce a typical urban neighborhood, composed by six prosumers of different activity sectors and, hence, having different daily load profiles. Considering that at least some of those will have an energy surplus during a part of the day, the idea of a local energy market for trading such surplus is introduced. For the management of this virtual energy market, two models were proposed: a centralized management model, which is intended to simulate a microgrid controlled by a single entity holding access to all data regarding production and demand of the microgrid participants, and a decentralized management model, simulating a scenario where prosumers individually manage their energy trades. Both models were optimized with mixed integer linear programming for cost minimization and simulated for four day-types, with hourly time intervals: winter week- and days and summer week- and weekend-days. A base scenario with no energy exchange between the prosumers, only with the main grid, serves as a reference for comparison. The results were quantified in terms of self-consumed power and financial balance analyses. Finally, a contextualization for the Portuguese legislation regarding self-consumption was made, in order to determine if this case-study and corresponding results could be adequate for the national legal situation.
The results show that very similar outcomes of self-consumption are obtained for both management approaches, with a maximum daily divergence of 2,3%. Considering the overall average for the daily self-consumption values obtained, the difference between the two models is below 1%. When comparing with the base scenario it was verified that, on average, an overall 10% increase in self-consumption is obtained for the micro-grid as a whole.
Regarding the financial outcomes, the application of a local energy market for energy exchange between microgrid prosumers resulted in an energy surplus valorization of 135%, on average for the day types simulated, compared to the value stipulated by the Portuguese legislation for self-consumption units. As a logical consequence of this result, an average of 21,6% increase in overall revenues for the prosumers was verified, compared with the revenues in the base scenario. The highest increases on the revenues are verified in the winter week-day scenario, in particular for the office. On average, the individual costs’ reduction is 1,2%, mostly due to savings during the summer.
An overall economic analysis on the expected electricity bill of each prosumer and for the microgrid as a whole, revealed that the local energy market can cause a bill reduction of 3,3% for the winter week, and 5,3% for the summer. It can be concluded that, when considering the whole microgrid, the overall economic benefits in terms of economic savings are not so relevant as the results obtained in terms of self-consumed energy, for this particular case-study, although a more profound economic evaluation
iv
would be interesting to fully acknowledge the impacts of the observed financial benefits on the overall implied investment.
When analyzing the results under the Portuguese legal framework it was concluded that 3 of the production units were oversized in terms of resulting connection power.
v
Resumo
No atual contexto de descarbonização da rede energética e da sua transição para um modelo de funcionamento mais distribuído e flexível, tem sido dado uma ênfase crescente ao papel que as micro redes poderão desempenhar na integração de fontes de energia descentralizadas e de pequena escala nas redes nacionais.
Por outro lado, o paradigma atual é de desruralização e crescimento e densificação das cidades, criando necessidade de fomentar a produção de energia próxima do consumo em ambiente urbano, mesmo com todas as limitações associadas, e.g. de espaço.
Uma das formas de aproveitamento descentralizado de energia mais utilizadas na atualidade é a conversão de energia solar em energia elétrica através de painéis solares fotovoltaicos. A nível global tem-se assistido a uma grande adesão a esta tecnologia, que pode ser explicada pelas políticas económicas de incentivo à sua utilização e constantes desenvolvimentos na tecnologia que levaram a uma queda no seu preço de mercado, tornando-a competitiva mesmo sem subsídios. Isto levou a que utilizadores e investidores de pequena escala apostassem em unidades para autoconsumo ou pequena produção, com ou sem ligação à rede elétrica nacional.
As pequenas unidades urbanas de produção de energia solar fotovoltaica têm vindo portanto a ganhar destaque, embora a sua curva de produção coincida com a da radiação solar disponível a cada instante, tornando indispensável o recurso a sistemas de armazenamento de energia, como baterias, ou a esquemas de venda de energia à rede em horas de produção excessiva, eventualmente beneficiando de tarifas subsidiadas, e à compra em horas de défice.
Uma terceira alternativa é exposta nesta dissertação – a da troca de energia entre consumidores-produtores (para os quais foi criada a designação de ‘prosumers’) de uma micro-rede. Neste trabalho analisa-se um caso em que dado conjunto de prosumers com painéis fotovoltaicos instalados no espaço disponível da cobertura dos respetivos edifícios consumem em primeira instância a energia que produzem, sendo o excesso disponibilizado num mercado local de energia para venda aos restantes prosumers.
Para demonstrar os hipotéticos benefícios desta alternativa, dois cenários com modos diferentes de gestão de micro-redes, com troca de energia, foram comparados com um cenário base, sem troca de energia. Os cenários foram montados para o mesmo sistema energético, constituído por seis prosumers (dois prédios residenciais, um restaurante, uma escola, um pequeno escritório, e um banco). Os dois diferentes modelos de gestão são: (1) gestão centralizada , que pretende simular um cenário em que existe uma unidade central gestora que tem total conhecimento e acesso aos perfis de produção e consumo dos participantes da micro-rede durante o dia todo, e com essa informação gere os recursos; (2) gestão descentralizada, que simula uma situação em que cada prosumer gere a energia que compra no mercado energético consoante o preço desta em comparação com a da rede nacional. Os dois modelos incluem uma otimização matemática do balanço entre custos e receitas, com vista à minimização da conta da energia para os prosumers da micro rede em estudo.
Para fins de simulação, os consumidores foram considerados clientes da EDP, e divididos em escalões de potência contratada, de maneira a definir os preços a pagar pela energia da rede nacional. Os dados de consumo dos consumidores residenciais (dois prédios com vários apartamentos) e do banco foram cedidos pela Intelligent Sensing Anywhere, referentes a consumidores de Lisboa, com formatação de intervalos de quinze em quinze minutos. Os restantes perfis foram retirados de uma base de dados de
vi
perfis padrão criada pelo Departamento de Energia dos Estados Unidos da América, com intervalos de tempo horários. Assim dos perfis anuais foram escolhidas semanas representativas da época de Verão e Inverno para cada consumidor, e destas foram selecionados dois dias representativos, um dia de semana e um dia de fim-de-semana.
Referentemente à produção fotovoltaica, foram feitos dimensionamentos dos sistemas fotovoltaicos com base na média do consumo diário para os dias considerados, permitindo, de acordo com as áreas consideradas como sendo utilizáveis para o efeito, determinar o número de painéis a instalar e a capacidade instalada para cada um.
De acordo com os resultados das simulações foi possível verificar as diferenças entre os modelos de gestão do mercado local e o cenário base sem troca de energia, em termos de autoconsumo, individual e coletivo, e balanço financeiro, bem como uma análise detalhada aos custos e receitas obtidos por cada um.
A análise das simulações permitiu verificar que as diferenças obtidas entre os modelos centralizado e descentralizado são pouco significativas– uma análise comparativa dos valores de autoconsumo do sistema para os dois casos demonstra uma diferença máxima de 2,3 %, no dia de semana de Inverno, sendo que para o dia de verão de fim-de-semana a diferença era inexistente. Para os restantes dias, o nível de autoconsumo no sistema estudado foi superior sob gestão centralizada.
Assumindo uma relação entre o aumento da diferença entre o autoconsumo para cada modelo e a quantidade de energia disponível no mercado local (no Inverno há menos produção pelos painéis fotovoltaicos e os consumos são superiores nos dias de semana), procurou-se demonstrar que estas diferenças podem ser explicadas como uma resposta aos preços praticados. Por outras palavras, no modelo descentralizado havendo menos energia disponível para venda no mercado local da micro-rede, a tendência será para os preços subirem, o que eu comparação com o preço de comprar à rede nacional pode tornar o mercado local uma fonte de energia menos atrativa. Já para o modelo centralizado, onde uma entidade gestora tem informação plena, terá presumivelmente capacidade para atribuir preços mais baixos à energia no mercado local, mesmo quando há pouca energia disponível, de maneira a aumentar o rendimento do sistema no seu todo.
Comparativamente ao cenário base, verificou-se que em termos diários se atingiram aumentos em média de 10% na quantidade de energia autoconsumida pela totalidade do sistema.
Uma análise às trocas de energia entre prosumers da micro-rede permitiu determinar que o restaurante é o que mais beneficia do mercado local de energia em termos de quantidade comprada, seguido pelos edifícios residenciais. Em média as poupanças nos custos rondaram os 1,2% para cada, e o aumento das receitas foi em média 21,6%.
Uma análise financeira revelou que a aplicação de um mercado local de energia resultou numa valorização média de 135% do excedente de energia, em comparação com o valor a este atribuído em linha com a legislação portuguesa referente.
Já para a micro rede como unidade, os balanços financeiros estimados para uma semana inteira de cada estação revelaram que a conta da eletricidade poderia ser reduzida em 3,3% no Inverno e 5,3% no Verão. Embora estes valores não sejam muito elevados, permitem apoiar a ideia defendida nesta dissertação, e quantificar os seus benefícios, na medida em que a implementação de um modelo de troca de energia, quer centralizada quer descentralizada, permite benefícios económicos para os prosumers envolvidos e um maior grau de autoconsumo da energia produzida na micro-rede. Considerou-se importante frisar que para a atual legislação em vigor em Portugal para o que diz respeito a autoconsumo, esta seria uma
vii
maneira de conseguir valorizar o excedente de energia produzida. De maneira geral um mercado local como o sugerido beneficiaria tanto consumidores como produtores, dando opção aos primeiros de comprar energia mais barata do que a vendida na rede nacional, e aos produtores uma opção viável de venda do excedente.
Uma análise crítica aos valores considerados de potência instalada e máximas potências injetadas na rede em comparação com os limites estipulados pelo Decreto-Lei 2014 referente a unidades de autoconsumo permitiu concluir que: 1) no que toca à potência instalada, os valores considerados constituem sobredimensionamentos em 3 casos; 2) relativamente à potência injetada na rede nacional, esta excedeu o limite estipulado apenas nos casos de sobredimensionamento. Com isto se conclui que os benefícios obtidos, em termos de autoconsumo e redução nos custos da eletricidade, poderão ter interesse no contexto nacional, uma vez que para alguns dos participantes da micro rede, não se verificando sobredimensionamento ou excedente de energia injetada na rede, foi possível beneficiar de melhorias no autoconsumo e redução dos custos.
A ter em consideração há que várias simplificações foram feitas neste estudo, tal como a atribuição de uma eficiência de 100% para o sistema de transmissão da micro-rede, ou a assunção de que não existem perdas no inversor e cablagem dos sistemas fotovoltaicos. É também de referir que a utilização de intervalos de tempo com dimensão de uma hora implica maiores erros que numa simulação de escala mais fina, uma vez que não retrata com tão grande aproximação uma situação real de produção e consumo de energia.
Palavras-chave: micro rede, energia renovável, autoconsumo, prosumer, mercado local de energia
viii
Contents
Acknowledgements ... ii Abstract ... iii Resumo ...v Contents ... viii List of figures ...xList of tables ... xiii
List of Notations ...xiv
List of Acronyms ... xv
1. Introduction ...1
1.1 Dissertation goals and outline ...3
2. Framework ...5
2.1 Micro Energy Grids ...5
2.2 Smart-Grids...7
2.2.1 The European framework on Smart-Grids ...8
2.2.2 The Portuguese case ...9
2.3 Self-consumption and the prosumer ... 11
2.3.1 The European framework on self-consumption and prosumers ... 12
2.3.2 The Portuguese framework on self-consumption and prosumers... 14
2.4 Community energy systems ... 14
2.4.1 Management of a Community Smart Grid ... 15
2.4.2 The European framework on community energy systems ... 17
2.4.3 The Portuguese framework on community energy systems... 17
2.5 Distributed renewable energy sources ... 17
2.5.1 The European framework for distributed renewable energy sources ... 18
2.5.2 The Portuguese framework for renewable energy sources in microgrids ... 19
2.5.3 Solar Energy ... 21
2.6 Related work and projects ... 22
3. Methodology: Micro Smart-Grid Energy Exchange Optimization ... 24
3.1 AIMMS Software and the mathematical programming ... 24
3.2 Performance of the system... 24
3.2.1 Centralized model ... 27
3.2.2 Decentralized model ... 27
3.2.3 Analysis of the performance ... 28
3.2.4 PV system’s sizing and performance ... 30
ix
3.3.1 Energy demand profiles ... 32
3.4 Price Structure ... 41
4. Results and Discussion ... 43
4.1 Self-Consumption results comparison ... 46
4.2 Energy flows analysis ... 48
4.3 Financial Analysis ... 51
4.4 Portuguese context... 53
5. Conclusions ... 54
Limitations and future work ... 55
6. References ... 57
7. Annex ... 61
Annex 1: Solar photovoltaic panel datasheet... 61
Annex 2: Price structure ... 62
x
List of figures
Figure 1.1 - Estimated Energy Demand in Cities of the EU-28 ... 2
Figure 2.1 - Microgrid schematic ... 5
Figure 2.2 - Schematic of a microgrid, stakeholders and connections ... 6
Figure 2.3 – Conceptual model of a smart grid ... 7
Figure 2.4 - Daily load profile with PV production and self-consumption ... 12
Figure 2.5 - Small production unit’s (UPP) scheme according to DL-2014 ... 20
Figure 2.6 - Self-consumption unit's (UPAC) scheme according to DL-2014 ... 20
Figure 3.1 – Main execution loop procedure in the Decentralized model ... 28
Figure 3.2 - Daily Solar Irradiation(W/m2) for summer and winter seasons ... 31
Figure 3.3 – Power consumption in kW of Residential building 1 (R1), for a representative Winter and Summer week ... 33
Figure 3.4 - Residential building 1 (R1): daily power consumption profiles for a representative Winter week- and weekend-days, as used for the simulations in the AIMMS software ... 33
Figure 3.5 - Residential building 1 (R1): daily power consumption profiles for a representative Summer week- and weekend-days, as used for the simulations in the AIMMS software ... 33
Figure 3.6 - Residential building 2 (R2): Power consumption in kW for a typical summer and winter week ... 34
Figure 3.7 - Residential building 2 (R2): daily power consumption profiles for a representative Winter week- and weekend-days, as used for the simulations in the AIMMS software ... 34
Figure 3.8 - Residential building 2 (R2): daily power consumption profiles for a representative Summer week- and weekend-days, as used for the simulations in the AIMMS software ... 35
Figure 3.9 – School: Power consumption in kW for a representative Spring and Winter week . 35 Figure 3.10 – School: Daily power consumption profiles for a representative Winter week and weekend-day in kW, as used for simulations in the AIMMS software ... 36
Figure 3.11 - School: Daily power consumption profiles for a representative Summer week and weekend-day in kW, as used for simulations in the AIMMS software ... 36
Figure 3.12 – Bank: Power consumption in kW for a representative Summer and Winter week 37 Figure 3.13 - Bank: Daily power consumption profiles for a representative Winter week and weekend-day in kW, as used for simulations in the AIMMS software ... 37
Figure 3.14 - Bank: Daily power consumption profiles for a representative Summer week and weekend-day in kW, as used for simulations in the AIMMS software ... 37
Figure 3.15 – Restaurant: Power consumption in kW, for a representative Summer and Winter week ... 38
xi
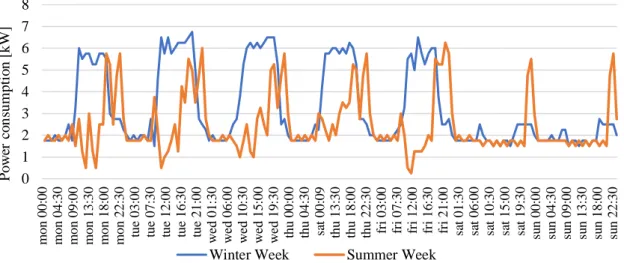
Figure 3.16 – Restaurant: Daily power consumption profiles for a representative Winter week and weekend-day in kW, as used for simulations in the AIMMS software ... 38 Figure 3.17 - Restaurant: Daily power consumption profiles for a representative Summer week and weekend-day in kW, as used for simulations in the AIMMS software ... 39 Figure 3.18 - Power consumption in kW of the Office, for a representative Summer and Winter week ... 39 Figure 3.19 – Office: Daily power consumption profiles for a representative Winter week and weekend-day in kW, as used for simulations in the AIMMS software ... 40 Figure 3.20 - Office: Daily power consumption profiles for a representative Summer week and weekend-day in kW, as used for simulations in the AIMMS software ... 40 Figure 3.21 – Average monthly closing market price as defined by the Iberian Energy Market Operator, and average prices for the winter and summer months, as considered in the simulations ... 42 Figure 4.1- Daily load and production profiles for the microgrid, individual loads and net load, for a) winter week-day,b) winter weekend-day,c) summer week-day and d) summer weekend-day ... 43 Figure 4.2- Winter week-day: Share of energy consumed daily by each prosumer, by source (self-produced PV energy, energy from the main grid or energy from the local energy market), for the centralized (a) and decentralized (b) models ... 44 Figure 4.3 – Winter weekend-day: Share of energy consumed daily by each prosumer, by source (self-produced PV energy, energy from the main grid or energy from the local energy market), for the centralized (a) and decentralized (b) models ... 44 Figure 4.4 – Summer week-day: Share of energy consumed daily by each prosumer, by source (self-produced PV energy, energy from the main grid or energy from the local energy market), for the centralized (a) and decentralized (b) models ... 45 Figure 4.5 - Summer weekend-day: Share of energy consumed daily by each prosumer, by source (self-produced PV energy, energy from the main grid or energy from the local energy market), for the centralized (a) and decentralized (b) models ... 45 Figure 4.6 – Winter week-day: Self-Consumption, in %, of the whole microgrid, for the centralized and decentralized management model and base scenario with no exchange between prosumers ... 46 Figure 4.7 – Winter weekend-day: Self-Consumption, in %, of the whole microgrid, for the centralized and decentralized management model and base scenario with no exchange between prosumers ... 46 Figure 4.8 – Summer week-day: Self-Consumption, in %, of the whole microgrid, for the centralized and decentralized management model and base scenario with no exchange between prosumers ... 46
xii
Figure 4.9 – Summer weekend-day: Self-Consumption, in %, of the whole microgrid, for the centralized and decentralized management model and base scenario with no exchange between prosumers ... 47 Figure 4.10 - Differences in % between the two management models and between the model's self-consumption and the base scenario for the whole microgrid, for each day type ... 47 Figure 4.11 - Winter week-day: Energy flows, in kWh, of the microgrid for the centralized (a) and decentralized (b) models ... 48 Figure 4.12 - Winter weekend-day: Energy flows, in kWh, of the microgrid for the centralized (a) and decentralized (b) models ... 49 Figure 4.13 - Summer week-day: Energy flows, in kWh, of the microgrid for the centralized (a) and decentralized (b) models ... 49 Figure 4.14 - Summer weekend-day: Energy flows, in kWh, of the microgrid for the centralized (a) and decentralized (b) models ... 49 Figure 4.15 - Prosumers buying choices according to local energy market price variation in comparison to the network price, for a) BTN clients and b) BTE clients in the Decentralized model for a winter week-day ... 50 Figure 4.16 - Surplus energy value as established by the DL 153/2014 compared with the value obtained from trades on the local energy market, on an hourly basis ... 51 Figure 4.17 – Individual daily costs’ reduction originated by using an optimization model in comparison with a base scenario of no-exchange ... 51 Figure 4.18 - Individual daily revenue's increase originated by using an optimization model in comparison with a base scenario of no-exchange ... 52 Figure 7.1 - Datasheet of the solar photovoltaic panel model considered for the simulations .... 61 Figure 7.2 - Price structure for BTE clients as used for the simulations ... 62 Figure 7.3 – Winter weekend-day: Comparison between the prices of the surplus energy sold in the local market (LM) with the value of energy sold to the main grid, and daily average ... 64 Figure 7.4 – Summer week-day: Comparison between the prices of the surplus energy sold in the local market (LM) with the value of energy sold to the main grid, and daily average ... 64 Figure 7.5 – Summer week-day: Comparison between the prices of the surplus energy sold in the local market (LM) with the value of energy sold to the main grid, and daily average ... 64
xiii
List of tables
Table 2.1 - Micro-Production in Portugal according to Decree-Law nº 153/2014 ... 21 Table 3.1 – Main execution procedure algorithms for the centralized management model (algorithm 1) and decentralized management model (algorithm 2) ... 25 Table 3.2 - Data used for the PV systems’ sizing calculations ... 30 Table 3.3 - Roof space considerations, as in available, suited and required areas, and resulting PV arrays, for each prosumer ... 30 Table 4.1 - Estimated Week and Monthly Savings for each prosumer of the microgrid ... 52 Table 4.2 - Power specifications for the prosumers regarding connected, contracted and installed power ... 53 Table 4.3 - National specifications regarding self-consumption: compliance check for the microgrid prosumers ... 53 Table 7.1 - Prices for BTN and BTE clients as used for the simulations, by season ... 63
xiv
List of Notations
𝑖, 𝑗 Set of prosumers from the microgrid 𝑡 Set of time-steps, with value of one hour
Δt Time gap
𝐸𝐷𝑒𝑚𝑎𝑛𝑑𝑡,𝑖 Electricity demand of prosumer i, in time-step t
𝑃𝑉𝑜𝑢𝑡𝑝𝑢𝑡𝑡,𝑖 Electricity generated from the PV array of prosumer i, in time-step t
𝐸𝐵𝑜𝑢𝑔ℎ𝑡𝑁𝑒𝑡𝑤𝑜𝑟𝑘𝑡,𝑖 Electricity bought by prosumer i from the main grid, in time-step t
𝐸𝑆𝑜𝑙𝑑𝑁𝑒𝑡𝑤𝑜𝑟𝑘𝑡,𝑖 Electricity sold by prosumer i to the main grid, in time-step t
𝐸𝑆𝑜𝑙𝑑𝑀𝐺𝑡,𝑖 Electricity sold by prosumer i to other prosumers, time-step t
𝐸𝐵𝑜𝑢𝑔ℎ𝑡𝑀𝐺𝑡,𝑖,𝑗 Electricity bought by prosumer i from prosumer j, in time-step t
𝑃𝑟𝑖𝑐𝑒𝑆𝑁𝑒𝑡𝑤𝑜𝑟𝑘 Revenue from selling energy to the main grid
𝑃𝑟𝑖𝑐𝑒𝐵𝑁𝑒𝑡𝑤𝑜𝑟𝑘𝑡,𝑖 Cost paid by prosumer i to buy energy from the main grid, in
time-step t
𝑃𝑟𝑖𝑐𝑒𝑀𝐺𝑡,𝑖 Price of the energy sold by prosumer i within the MG, in time-step t
𝑃𝑉𝑒𝑓𝑓 Photovoltaic panels’ efficiency
𝑃𝑉𝐴𝑟𝑒𝑎𝑖 Area with photovoltaic panels installed, for each prosumer i
𝐸𝐷𝑖𝑓𝑓𝑒𝑟𝑒𝑛𝑐𝑒𝑡,𝑖 Difference between the energy being sold by and bought from
prosumer i, in time-step t
𝐼𝑟𝑟𝑎𝑑𝑖𝑎𝑛𝑐𝑒𝑡 Solar irradiance, in time-step t
𝐶𝑜𝑠𝑡𝑠 Daily financial balance from the costs and revenues of the entire microgrid
𝐸𝐵𝑜𝑢𝑔ℎ𝑡𝐹𝑟𝑜𝑚𝑡,𝑖 Energy bought from prosumer i, in time-step t
𝑇𝐸𝑆𝑜𝑙𝑑𝐵𝑦𝑡,𝑖 Total energy sold by prosumer i, in time-step t
𝑇𝐸𝐵𝑜𝑢𝑔ℎ𝑡𝐵𝑦𝑡,𝑖 Total energy bought by prosumer i, in time-step t
Ppv Number of photovoltaic panels
DailyLoad Daily energy consumption
xv
List of Acronyms
UPP Small production units (Unidades de Pequena produção)
FiT Feed-in Tariffs
SMG Smart Microgrids
P2P Peer to peer
CHP Combined heat and power
MA Multi-agent
TPES Total primary energy supply MILP Mixed integer linear programming
P Power
PR Performance ratio
PSH Peak Sun Hours
GHG Greenhouse gases
EU European Union
PV Photovoltaic
DER Distributed Energy Resources DSO Distribution system operator
LV Low voltage
EMS Energy management system
DL Decree of Law
1
1. Introduction
At a global scale, recent efforts to mitigate global warming and pollutant emissions have led to reinforced investments in cleaner energy sources and energy efficiency technologies. The paradigm is changing from centralized to distributed energy production, and from total dependency on the main grid to self-generation, taking advantage of the continuous developments in available renewable energy technologies, accompanied by their price-falls – the best example is the price drop of photovoltaic (PV) panels, which decreased by as much as 80% since 2009 [1]. These tendencies are pushing towards a new scenario of smaller and smarter energy systems, i.e., mini smart grids.
Current efforts towards the integration of more renewable energy and distributed sources, the implementation of demand response, the optimization of the end-uses of electricity and the flexibility provided by new control technologies and are some of the main drivers for the deployment of smart-grids [2].
However, the existent power system infrastructure, mostly based on old national grids, is not designed to meet the needs of a continuously-changing electricity market, nor to face the increasing demands of a digital society and increasing use of renewable resources [3]. The existing grid model is a one-way channel where balancing of supply and demand in real time is accomplished by adjustments on the supply side [4], meaning that conventional power plants regulate their production in order to deliver nonfluctuating power according to a predefined schedule or real-time contingencies [5]. The non-dispatchability and difficult predictability associated with the production of energy from most of the renewable energy sources – wind, photovoltaics, run-of-river – are still major barriers for its integration in the national grid, since it poses a challenge to its stability and reliability of operation [2].
Nevertheless, there are other approaches that can use renewable and distributed energy sources as a means to improve power reliability: some countries and regions are deploying economic incentives to increase the level of local self- consumption or micro-production as a way to reduce dependency on the main grid, hence having more security of energy supply [6]. These economic incentives come in different forms across the European countries, depending on their policies, but their common goal is to allow businesses and households to increase the consumption of their own energy production, either instantaneously or in a deferred manner, by means of decentralized energy storage. Through the process of 'self-consumption', passive consumers are therefore becoming active 'prosumers', i.e., producers and consumers of renewable energy [7].
As around 75% of the European citizens live in urban areas, accounting for up to 80% of the total energy consumption in Europe and around the same share of CO2 emissions, a lot of focus has been put on
improving energy consumption and production in such areas [6].
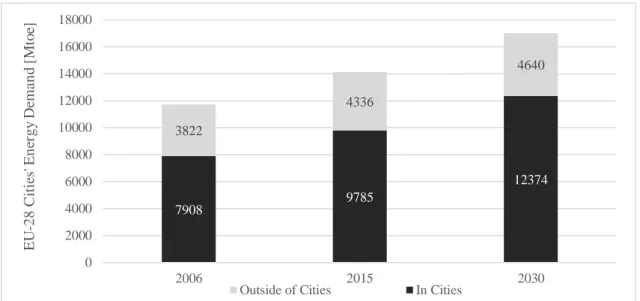
In the European Union (EU), households accounted for 29% of the final energy consumption in the EU-28 by 2014, and around 30% of the total electricity consumption [8], placing the residential sector in the center of energy efficiency policies in the EU [9]. As shown in Figure 1.1 below, energy demand in cities is expected to rise approximately 26% by 2030.
In Portugal, the residential sector was in 2013 responsible for approximately 16% of the final energy consumption, and for 4,4% of the CO2 emissions [10]. Both these values are substantially below the EU
2
According to an EuroStat analysis regarding cities across the EU countries (EU-28) [12], only 14.2% of the population lives in detached houses, against a majority of 59.9% that occupy flats (with more than two thirds of these living in buildings composed of at least ten separate dwellings). Thus, it has become increasingly important to invest in research and innovation towards city-integrated energy efficiency and generation, adapted to the current paradigm of highly concentrated housing, as that is expected to substantially contribute to the environmental, economic and social aspects of urban sustainability [6]. The goal of reaching energy self-sufficiency through renewable energy deployment in the urban context rises some challenges, due to the limited available space for installation [6]. Similarly, there some legal barriers for the installation of PV units on the rooftops of buildings with the intent is to supply energy to only a fraction of the building’s occupants.
Figure 1.1 - Estimated Energy Demand in Cities of the EU-28 (Source: data from International Energy Agency (IEA) 2008)
For the commercial and industrial sector, these emerging self-consumption models open new opportunities for energy related costs’ reduction, allowing them to better control their energy bills [13].
As for the residential sector, many other motivations arise. In this sector, electrification is an important contributor to the increasing power demand. Residential buildings account for about one-fourth of the global final energy consumption, making it a sector with great potential for substantial energy savings, and consequently minimizing its carbon footprint [14]. Moreover, by 31 December 2020, all new buildings in Europe shall be nearly zero-energy consumption buildings [15], meaning that they must be able to produce the amount of energy they consume. This comes as a major drive for adopting a larger portfolio of green energy options. The price fall in PV technology has also allowed for a sharp increase in the installed photovoltaic panel units on residential rooftops [16].
Local governments are starting to line up behind the idea of a decentralized energy future, and to face the challenge of consumers’ communities, setting up private energy sharing alliances and interacting with other grid stakeholders [17]. This can be accomplished by small-scale local production of energy at community/aggregated level, or at individual level [4]. In these cases, the energy produced locally does not always cover entirely the demand, requiring that the system is connected to the distribution grid to fulfill the consumption when the net-load is positive.
7908 9785 12374 3822 4336 4640 0 2000 4000 6000 8000 10000 12000 14000 16000 18000 2006 2015 2030 EU -28 Ci ti es ' E n er gy D em a n d [M to e]
3
Communities in the residential sector could further play a pivotal role in the democratization and decentralization of energy systems [18] . They have good opportunities for economic savings in the electricity bills and revenues from selling the excess production. Currently, in the case of energy excess production, the surplus is either sold to the grid, with a revenue that depends on local policies, or stored in an energy storage system. In this thesis, a third option will be explored: the selling of surplus energy to other consumers in a local energy market, with and without central management.
Considering that four out of five Europeans live in households located in regions where generating solar electricity on their rooftop is cheaper than buying it from the grid [19], it is increasingly more relevant to approach the hypothesis of energy generation near to the site of consumption.
Nevertheless, for a house to become net-zero based on solar PV energy, it will encounter the barrier of mismatch between peak production and peak-consumption [20], as well as no production during night-time when there is no solar radiation. As a way to compensate for that, energy storage units are regularly used, such as batteries.
Recently, mechanisms for energy exchange between prosumers in real time basis, based on blockchain technology, are being tested as another possible solution to enhance the self-consumption level. The idea behind it is that cities are constituted by buildings with different purposes and hence different consumption profiles. Therefore, the energy is used in different times of the day, resulting diverse profiles of excess or lack of energy, in particular when buildings have different purposes (residential, service and commerce purposes). In theory, this would allow for a higher usage of the produced and locally consumed energy. This also allows for a reduction in energy storage size, and hence cost. Buying from a production unit close to the site of consumption would allow for other benefits like reductions in energy losses through the distribution lines which could potentially mean further savings in the energy bill.
The idea of self-produced energy exchange within a local energy market is studied in this dissertation through the simulation of an urban energy system in the AIMMS software environment. The energy system is composed by several energy prosumers, belonging to different sectors (residential, commercial, services), typical of an urban neighborhood.
For the same energy system two models are tested: one with centralized management and the other completely decentralized. The differences between them and their results are analyzed. Finally, for a clearer understanding of the results, a comparison is be made between the outcomes obtained from both energy exchange scenarios and a third scenario for the same energy system but without energy exchange between prosumers.
1.1 Dissertation goals and outline
The research hypothesis of this thesis is that producing energy through renewable energy sources, in this case by the use of photovoltaic units, has more benefits for the prosumers when a group of buildings form a microgrid and exchange their excess energy between them and with the external grid, rather than a one-by-one power exchange of each prosumer with the external grid. Two important aspects here shall be demonstrated in order to support the supposed usefulness of this concept: improved self-consumption and economic benefits.
The improvements will be quantified by comparison with a base scenario with no energy exchange. From the simulation results, special focus will be paid to the relative self-consumption values, energy surplus valorization and revenues obtained, in order to determine if there could be benefits performing
4
energy exchange in urban areas in Portugal. Furthermore, a relevant question to answer is whether this system would comply with the national legislation applied to self-consumption units, in terms of injected power and installed capacity.
Another goal of this dissertation is to compare the outcomes of two different microgrid management models, the centralized and decentralized management approach.
The outline of this dissertation is the following:
2) Framework: a literature review on the concepts of smart microgrids and energy markets at service of community energy systems, including a European and Portuguese contextualization; 3) Methodologies: a chapter with an overview on the AIMMS software environment and mathematical optimization models used for the simulations, a detailed explanation of the methodologies used for data preparation and price structure considered for the financial considerations of this dissertation;
4) Results and discussion: where all relevant results are displayed and briefly discussed;
5) Conclusion: in this chapter an overview of the results of this dissertation is made and a critical discussion is done in order to conclude whether the dissertation goals were positively accomplished.
5
2. Framework
Throughout the literature review all concepts associated to the proposed energy system are introduced, as well as the present European and Portuguese framework.
2.1 Micro Energy Grids
The distributed power generation has emerged as a solution for enhanced deployment of renewable energy sources, which is one of the most important EU targets. As a result of end-users owning and operating DER assets, distribution system operators (DSOs) are looking for ways to adapt to more proactive controls in several parts of the grid [21] . At the time being, grid operators still have to deal with some limitations from the centralized system when it comes to control this increasing number of distributed sources [17], for instance the lack of flexibility from the energy demand side to adapt to the fluctuance of renewable energy production.
The concept of the microgrid was introduced to solve this problem. Although classical microgrid is not designed to operate in parallel with utility supply there is a trend for resourcing to microgrid technology for increasing the interaction between DER within microgrids and the main grid, as this brings benefits such as improved economies due to energy sharing, reserve capacity, and other ancillary services. This has broad implications on microgrid business practices and technical aspects [21].
A microgrid can be defined as a low voltage contiguous section of the grid and its interconnected energy resources (generators, loads, storage devices, electric vehicles) such that they can operate as an independent electrical island if needed, with no degradation of the service [21]. This island feature requires the employment of smart grid tools to optimize energy flows, which is crucial to managing the economic and technical operation parts.
It may range from individual backup power systems of houses to self-sufficient medium voltage systems consisting of multiple generators and stakeholders, as well as one or multiple kinds of renewable power generation centers. It offers the possibility of coordinating the distributed resources in an automated and intelligent way so that they can behave as a controlled entity, with clear contracts defining the roles of the different parties involved, and totally independent of the main grid, if needed. In this way, distributed resources can provide their full advantages in a more consistent way [17][21].
6
There are six types of different strategies for the electricity consumer and/or producer clustering: Embedded Networks, Virtual Power Plants, Prosumers Clustering, Local Prosumers Clustering, Smart Embedded Networks or Microgrid [22]. The classification depends on its components, electric boundaries, off-grid capacity and main grid interaction. The distinguishing trait of a microgrid is the mandatory capability for islanding mode, which is not present in any other strategy [22]. A virtual power plant, often mentioned in conjunction with microgrids, differs from it in that a virtual power plant is typically associated with energy resources but not with specific grid sections [21].
Currently there are over seventy projects identified in the world as fully operational microgrids implemented in urban areas. This kind of projects were first developed in the USA and Japan, motivated mainly by the need for resiliency and energy security [22].
A microgrid system comprises several stakeholders as illustrated in Figure 2.1. Inside the microgrid, four different roles can be distinguished: the owner, the electricity producer, the operator and the final user. These roles can be played by a single actor or many. Outside the microgrid there are interfaces with multiple players: the main grid owner, the main grid operator, regulatory institutions and external electricity retailers. An interface can also be present between the microgrid final users and the external electricity retailer, who could supply them even if the sold electricity is generated outside the microgrid.
Figure 2.2 - Schematic of a microgrid, stakeholders and connections (Source: ENEA Report, 2017 [22])
In short, some of the major benefits associated with microgrids include [21]:
• Provision of energy services tailored to the microgrid end-users’ requirements;
• Enabling of parallel operations with the main grid for improved financial performance through economic exchange of energy and ancillary services between the two;
• Enabling of parallel operations with the main grid for improved service reliability through coordinated response during emergency situations to serve critical loads and to reduce outage impacts;
• Leveraging and/or deferring capital investments on critical energy and grid assets;
• Enabling of innovation of new energy technology and services that have broad societal impact beyond local energy delivery.
3rd party
access Main grid owner
(municipality, …) Main grid operator (DSO, TSO)
MicroGrid Owner Incentive and constraints makers Electricity retail Electricity Suppliers
7
• Reducing main-grid usage by allowing to lower the main-grid capacity due to limiting the peak load, with the help of energy storage.
Microgrids are considered to be one of the most relevant tools in the process of decentralization of the electrical grid. Investments in this technology are expected to change the way distributed energy resources are integrated at urban level [21].
2.2 Smart-Grids
Smart-grids (SGs) are modern electric power grid infrastructures, built for enhanced efficiency and reliability through automated control, high-power converters, modern communications infrastructure, sensing and metering technologies, and modern energy management techniques based on the optimization of demand, energy and network availability [26]. One of the SGs biggest potentials is to allow for a more flexible power system, opening new business opportunities and operational possibilities specially regarding the integration of renewable energy sources (RES) into distributed system, such as microgrids [21].
They are qualified as smart grids because of their higher efficiency and capacity of control and operation, in comparison to the conventional ones, allowing to:
• safely integrate more renewable energy sources, smart buildings and distributed generators into the network;
• deliver power more efficiently and reliably through demand response and comprehensive control and monitoring capabilities;
• use automatic grid reconfiguration to prevent or restore outages (self-healing capabilities); • consumers having greater control over their electricity consumption and to actively participate
in the electricity market, since this technology allows for two-way communication between appliances and the electrical grid [15].
Figure 2.3 – Conceptual model of a smart grid (Source: The Impact of Control Technology flyer: «Control of Renewable energy and Smart-grids» [29])
TRANSMISSION DISTRIBUTION MARKETS Electrical Flows Information Flows Flow POWER CONSUMERS W/ smart meters + smart appliances OPERATIONS AND SERVICE PROVIDER GENERATION
8
Figure 2.2 shows the broad spectrum of entities and stakeholders covered by a smart grid. As it can be observed, the smart grid enables the extension of control to the consumer level [2].
By enabling bidirectional communication and power exchange between suppliers and consumers, through the incorporation of information and communication technologies, smart-grids are in position to shift the traditional paradigm of passive distribution into an active distribution and the consumers into active players [17]. This way, smart-grids also offer an encouraging prospect for the development of reliable and cost effective self-sustainable buildings and communities [15].
2.2.1 The European framework on Smart-Grids
In order to ensure a coordinated effort to drive the study and implementation of smart-grids throughout the EU, several programs have been developed:
• the EU 7th Framework Program, where smart grids solutions aim to be developed through the cooperation of member states;
• the Horizon 2020, where smart grids are addressed under the key challenge named “Secure, clean and efficient energy”;
• the EEGI, an industrial initiative for the development of the Union’s electricity networks, later updated to GRID+ project;
• the Smart Grid Task Force invested in assisting the Commission on policy and regulatory frameworks of Smart Grids;
• the EU energy infrastructure legislative package [2].
Across the EU member stated there were a total of 950 implemented projects on research and development and demonstration of smart grid technology. The European Union’s Grid4EU program has smart grid projects running in six countries, mainly implemented outside large cities, with relatively small number of loads. Their goals are to test the integration of DER generation into the existing distribution grid and the security of energy supply at local level, as well as its reliability when in island mode. Those projects are also useful to test the integration of distributed generation resources and storage management within buildings, and congestion power management in city infrastructures [23].
Regarding the GRID+ project, its white paper report predicts that geographically and topologically segmented markets will emerge as a response to the implementation of dynamic and granular locational marginal pricing on the distribution grid. In consequence, it is expected that occasionally customers will prefer to trade energy locally instead of interacting with wholesale markets. This will be possible by means of blockchain technology, which will facilitate the exchange of energy directly in a peer-to-peer (P2P) manner, rather than the current system of clearing on a centralized market. GRID+ plans to manage these local tradings until regulators make rules for P2P markets generally [23].
The BRIDGE initiative unites some of these programs to create a structured view of focal issues which are encountered in the demonstration projects and may constitute an obstacle to innovation. Since 2014 it has supported 32 projects in the domains of distribution grids, distributed storage, transmission grids, large scale storage and RES [27]. Over the years, it has identified as main barriers:
• the lack of standardized methods for data exchange;
• lack of, or limited, data and information sharing with energy market players;
• lack of market conditions for new services to be delivered, due to existing constraints for market participation, particularly affecting small scale players;
9
• lack of standard solutions and guidelines regarding P2P trading in order to carry out commerce; • lack of appropriate control of data access;
• existing telecommunication infrastructure, whose reliability and robustness to support envisioned energy services is still uncertain, regarding both market applications and network management;
• current security services provisioning still under development and consideration;
• lack of standardized methodology for determining the flexibility potential of new installations. Based on this, the BRIDGE working group has made some recommendations, for example: the creation of a common format for data exchange across Europe to facilitate interoperability of systems; general access of raw, real time data; empowering of households with consent option in cases of transfer of data to players for provision of services and development of privacy protection solutions [27].
According to the Joint Research Center, the United Kingdom is the leading country in what regards investments in SGs research and demonstration projects. It has several pilots to create incentives for higher demand response through smart meters and ancillary services, including the establishment of privacy and data-access arrangements for suppliers and DNOs. Also, a Smart Grid Forum was launched in 2011 to provide leadership to the industry on smart-grid issues [2].
Italy has also placed itself as one of the EU members stated that has been most impacted by the increase of intermittent generation. Its programs to incentive the deployment of smart meters have been a great success with smart meters, currently covering more than 95% of the Italian low-voltage consumer base [2].
As for other examples of municipal initiatives, Latvia and Lithuania’s city capitals have both made available online the annual heat and energy consumption values of some residential buildings, with the aim of encouraging residential building’s renovation and investment in the city, as all owners and tenants can find out how much their building’s energy costs are per year, and how it compares to similar properties in their neighborhood. This online tool allows people looking for a new home to know the most energy efficient options [9].
In summary, European’s current paradigm regarding SMGs application is still in its pilot phase, with limited definitions of what constitute a smart investment, which are still analyzed in a case by case basis, with a great focus on financial aspects [2].
2.2.2 The Portuguese case
In Portugal, the transition to a smarter distribution grid is led by EDP Distribuição, which resulted from a partnership of the DSO with academic institutes, technology and innovation firms, and metering equipment suppliers, resulting in the InovGrid project. It had its first pilot in Évora, called InovCity, through which 31.000 smart meters were installed in 2011. The infrastructure spans the entire municipality, reaching around 33.000 electricity customers [2] [28] .
The Portuguese paradigm is one where the level of renewable energy penetration in primary energy consumption amounts to 21%, and 44% in the electricity production. The incentive scheme supporting smart-grids is attributed in the form of a prize over the cost of capital, implying a sharing of the
10
innovation’s risk by consumers. So, if a project is expected to provide for an overall efficiency gain, the regulator allows the DSO to benefit from the 1.5% prize return on the smart investments.
EDP Distribuição is currently deploying second-generation smart meters to 100.000 customers throughout the country. Concerning the mobility sector, between 2010 and 2011, a charging network for electric vehicles was implemented, with 1.350 smart charging stations accessible to end-users throughout the country [2].
Another project implemented in Portugal’s territory and funded by the Horizon 2020, the SMILE project, is responsible for a pilot in Madeira island. As the amount of solar energy generation increases, so does the difficulty in balancing the electric system. The project envisions an intelligent control and automation system implemented in the existing grid to provide for an overall better management of the distribution network. This involves the implementation of grid balancing and frequency control, installation of smart metering systems, demand side management techniques (including market mechanisms such as dynamic pricing) and storage technologies. Another goal of this project is to evaluate the integration of battery energy storage systems in this island, resourcing to its existing test bed of eighteen micro-production sites. The existing electric vehicle network on the island will moreover be expanded and integrated with the control system via smart charging software [2][29].
Although several pilot programs have been implemented by utilities using smart meters and energy management systems, ranging from simple in-house feedback displays to programmable systems endowed with actuation on loads, Portugal has not yet decided in favor of a large-scale smart meter roll-out. Consequently, demand response programs and direct load control activities have only had an experimental basis with limited results.
According to inquiries to a sample of the Portuguese population, households frequently engage in many different energy usage, control, and investment behaviors, but across all respondents there were two less frequent energy behaviors: providing meter readings to the utility and buying more efficient equipment. Although 76% of respondents stated they read the electricity bill “frequently or even “always”, they rarely provide meter readings to the electricity supplier (only 32.6% stated “frequently” or “always”). According to the Directive 2009/72/EC, 80% of end-users are expected to be equipped with smart metering systems by 2020 [30].
However, most Portuguese end-users still have meters requiring manual readings (either performed by the utility technicians or end-users), supposedly to enable more precise billing.
The transition to smart grids also comprises the increasing adoption by end-users of technologies such as demand-response enabling technologies, electric vehicles and local micro-generation. Results revealed that only 7% of respondents used electricity monitoring devices (e.g. in-house displays). Less than one third (28.7%) currently uses time-of-use controlling functions on their appliances (e.g. programming or time-delaying) [30].
Results from the same study regarding end-user’s availability to accept load control actions over appliances (shifting time-of-use, turning off, redefining operational settings) show that the majority of respondents was not willing to accept direct load control from the utility, even in a hypothetical future scenario of dynamic pricing. Only 34.9% was willing to accept control of their appliances by the utility.
11
2.3 Self-consumption and the prosumer
Since the price has been falling in small scale renewable energy units, it has become common for households to have their own production units, such as solar photovoltaic panels, combined heat and power, etc. These units are usually used to meet internal energy demand, while the surplus generation is sold to the main grid or stored in a decentralized energy storage device [20].
The neologism «prosumer» refers to an electricity consumer that produces part of his power needs from his own power plant and uses the distribution network to inject excess production and to withdraw electricity when self-production is not sufficient to meet his/her own needs [31].
According to some of the reviewed papers, prosumers are proactive energy producers and consumers that want to be in control of their energy generation and use, be it as house-owners or tenants, institutions or small businesses. Their main motivations are to reduce dependence on the main grid, optimize their energy consumption and minimize their energy bills. They are actively engaged in producing more energy than they would utilize in order to trade/share the excess to other prosumers [19] [32].
Prosumers can either act on their own or collectively through aggregators, as energy service companies, contractors or cooperatives, through social enterprises or through other local community energy projects [19].
In a context of continued growth of the number of prosumers, in the necessity to give response increasing connections between those and the existing macro-grids side, some problems arise:
1. The current centralized and restricted market doesn’t allow for profitable business models to arise for small producers;
2. There’s a lack of platforms that allow managing the energy and information flow between local energy producers and bigger scale potential consumers.
3. Problems on a contractual level are expected to arise as a consequence the introduction of decentralized energy producers and small independent energy markets, due to the high complexity for such dynamic and competitive markets.
4. Stability of the electric network may be at risk if there is no optimized management capable of keeping up with the introduction of thousands of micro/mini-producers [19].
It is considered that the use of blockchain technology and of smart-contracts could potentially address challenges for local energy consumption managed at micro grid level, by allowing micro/mini producers to negotiate the sale of the energy they produce in a safe, reliable, fast and flexible way [19]. These tools would imply, for instance, the creation of new platforms for negotiating the purchase and sale of energy, allowing micro-producers to have an additional source of income, and consumers the option of choosing the cheapest supplier [22] [23].
Considering a scenario where solar panels are installed on the rooftop of a multi-apartment building, the electricity generated on site is consumed at least partly by the building’s tenants. That self-produced energy is firstly consumed as electricity delivered via the grid (it is purchased, delivered and billed by an electricity supplier) [19]. This situation poses a barrier to urban prosumers, since as mentioned earlier, most of the population lives in cities, and in multi-apartment buildings, being few of those the ones of have smart-meters at use.
12
For a tenant of a multi-apartment building to be able to access and consume his self-produced solar electricity, four types of situations may occur:
• Segmented self-generation (tenants rent and run a segment of a solar power plant on their own); • Shared self-generation (the shared use of the solar power plant is part of the lease of the flat); • Direct sale by the landlord or by a contractor (tenants are offered an in-house solar electricity tariff); • Direct sale by an electricity supplier (tenants are offered solar electricity and electricity imported
from the grid in one single retail electricity tariff) [19].
An assessment from a consumer perspective shows that direct sale models generally bear a lower risk for tenants. The contractual framework provides a higher level of transparency regarding costs and benefits. Moreover, the administrative burden for the tenant tends to be much lower. However, in legal terms, a broader definition of self-consumption is required to include these models.
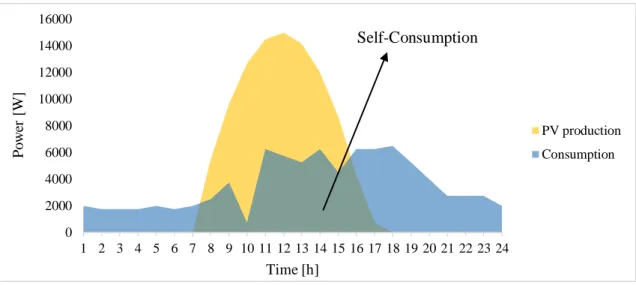
Self-consumption is commonly mistaken with self-sufficiency. While the first describes the local (or remote under some schemes) use of self-produced electricity, the second describes how self- production can cover the needs of the place [31]. In Figure 2.4 the self-consumption appears from the overlapping of the consumption and self-production profile.
2.3.1 The European framework on self-consumption and prosumers
According to the latest studies, around 80% of European households could generate solar electricity at lower price than the cost of buying it form the grid [19]. It is believed that to reach the full potential on self-consumption in urban environment it is essential to align specific regulation and incentive policies [17].
Financial incentives given to prosumers vary across EU territory, as there is no strong harmonized structural approach to prosumer support. Many countries motivate net metering schemes, which means that the energy fed as excess electricity into the grid is deducted from the bill of the owner of the power plant during a certain period in time [34]. Sometimes a country may employ more than one financial incentive; for instance, Denmark employs fixed premiums and net metering; Germany uses guaranteed price feed-in tariff, and Italy adopted guaranteed price feed-in tariff, fixed premiums and net metering.
0 2000 4000 6000 8000 10000 12000 14000 16000 1 2 3 4 5 6 7 8 9 10 11 12 13 14 15 16 17 18 19 20 21 22 23 24 P o w er [W ] Time [h] PV production Consumption Self-Consumption
13
Other options employed are tax reductions and capital subsidies and loans or tradable green certificates [34].
Besides some efforts from some countries to include a friendlier policy for small-scale prosumers, it is considered that, at the moment, there are no real markets for prosumers due to lack of motivation, incentives and information [35].
Nevertheless, some cities around Europe are succeeding at powering through the energy transition towards more sustainable urban environments. Eindhoven for example, is motivating its residents to invest in local renewable energy by encouraging their participation in citizen energy cooperatives. The members of the cooperative produce renewable energy through small-scale installations and the organization’s profits are used to keep people’s energy bills down and fund new renewable projects. The municipality also makes tools available to calculate the return on investment for private solar panel installations [9].
On other way, Barcelona’s strategy is set on two objectives: reducing its greenhouse gas emissions by 40% by 2030 (compared to 2005) and producing enough energy locally to meet municipal needs. In 1999, the municipality adopted a thermal solar ordinance according to which new and retrofitted buildings are required to use at least 60% of solar energy to cover their hot water needs. As a result, the installation of solar panels reached 90.000 m2 by the end of 2012. Currently, the municipality has 50% of its internal needs covered by renewable energy (buildings, lighting, municipal vehicles, etc.) [6].
Barcelona also plans to set up a power supply company, aimed at developing new energy generation units in the city, making energy a public service accessible to all. The “self-sufficient Barcelona” website provides information and advice on local renewable energy production and energy efficiency, helping to raise public awareness for the issue [6].
Another example is the municipality of Frankfurt, aiming to have all its energy needs covered by renewable energy by 2050, which will be achieved by: reducing the energy use by 50% through building retrofitting and the use of new technologies; by renewable energy production within the city supplying 25% of the demand; 25% of the demand supplied by renewable energy produced in the metropolitan area [6].
Venice has joined forces with private investors to redevelop Certosa Island into a low-carbon urban park. The local business that teamed up with the city for this project decided to invest in medium-scale installations for multiple renewable sources (biomass plant, district heating and cooling, solar thermal, PV and micro-wind systems), which, aligned with a general power consumption reduction, has allowed the city of Venice to decrease its gas imports by 100.000 cubic meters and reduced CO2 emissions by 315 tons per year [9].
Nevertheless, it is still frequently mentioned on European reports that there is nearly no legal ground for tenants as far as solar self-generation policies in EU Member States, since the existent legislation is mainly designed for detached houses, it is hard for tenants to access this solar electricity [19][33].
14
2.3.2 The Portuguese framework on self-consumption and prosumers
Portugal’s objective is to achieve as much as 40% of national energy consumption from renewable sources by 2030. For reaching this, most of the new renewable energy projects should focus on small generation, self-consumption generation, solar photovoltaic energy, as well as biomass [36].
Self-consumption in Portugal is regulated by the Decree-Law nº 153/2014, 20th October, Portaria nº 14/2015 and Portaria nº 15/2015. This legislation was specially adapted with the purpose of promoting further deployment of micro-generation renewable energy in Portugal [37].
Regarding financial incentives, the most relevant is a in tariff for existing installations. The feed-in tariff consists of two elements: a guaranteed payment rate and an amount calculated by a set formula. For new small production installations, a remuneration regime has come into force in 2015 (the Decree-Law nº 153/2014). This remuneration regime is based on a bidding model in which producers offer discounts to a reference tariff [38].
According to the Decree-Law nº 153/2014, mini/micro production units are divided into self-consumption units or small production units. The so-called self-self-consumption units (UPAC’s) are meant to satisfy the energy demand locally. The power that is produced is immediately consumed and any exceeding production is fed into the grid, to avoid any losses. The non-self-consumed energy is injected into the national grid and it is paid at 90% of the monthly average rate of the closing market price of energy by the Iberian market operator [38].
According to the Portuguese association for solar photovoltaic energy (APESF), in 2017, the majority of UPAC units in operation were by far photovoltaic ones, specifically units up to 20 kWp installed power (64,2%), followed by 20 to 100 kWp units (24%). In total, from 2015 to 2017, with the implementation of the legislation regarding micro production, a total of 1.714 units of RES for self-consumption were installed, and from the total of power attributed to decentralized production, 69% was of UPAC units. Wind energy and biogas units were installed in a very small proportion [39].
Values of 2018 show that 47% of the total PV installed power in Portugal comes from decentralized generation units, amounting to 269.312 kW by February 2018. It is possible to draw a conclusion that the DL nº 153/2014 had a visible impact on the promotion of decentralized generation in Portugal [39]. Although these results may sound encouraging, by 2017 the number of prosumers is still 11.000, which corresponds to roughly 0,11% of the entire population [30].
2.4 Community energy systems
Recently, a great amount of research has been focusing on finding solutions for decentralized energy systems’ application at the local level. It has become clear that the outcome of such systems may vary in great scale according to economic, technical and environmental factors. It is also been proved pertinent to adapt them appropriately for each distinct scale (individual building, neighborhood or district level) [40].
In this context, the concept of community energy systems is starting to gain attention. According to the organization IRENA [41], community energy is the economic and operational participation and/or ownership by citizens or members of a defined community in a renewable energy project. It is not limited
![Figure 2.2 - Schematic of a microgrid, stakeholders and connections (Source: ENEA Report, 2017 [22])](https://thumb-eu.123doks.com/thumbv2/123dok_br/18523562.903987/21.892.132.739.530.843/figure-schematic-microgrid-stakeholders-connections-source-enea-report.webp)
![Figure 2.3 – Conceptual model of a smart grid (Source: The Impact of Control Technology flyer: «Control of Renewable energy and Smart-grids» [29])](https://thumb-eu.123doks.com/thumbv2/123dok_br/18523562.903987/22.892.128.787.747.1069/figure-conceptual-source-impact-control-technology-control-renewable.webp)

![Figure 3.18 - Power consumption in kW of the Office, for a representative Summer and Winter week 0510152025123456789 10 11 12 13 14 15 16 17 18 19 20 21 22 23 24Power consumption [kW]Time [h]](https://thumb-eu.123doks.com/thumbv2/123dok_br/18523562.903987/54.892.108.745.638.931/figure-power-consumption-office-representative-summer-winter-consumption.webp)