INTRODUCTION
Epimorphic regeneration is the process that leads to full organ or tissue replacement upon injury or amputation, characterized by the generation of a transient structure called blastema (Morgan, 1901). The blastema is a crucial player in the regenerative process and is composed of a pool of proliferative cells that are responsible for the reconstitution of the lost tissue. This type of tissue regeneration has been studied for decades in amphibian and fish appendages; however, despite its major relevance to the regenerative capacity, blastemal cell origin has remained unclear (Kawakami, 2009).
In adult zebrafish, the amputation of the caudal fin leads to a succession of steps (wound healing, blastema formation and regenerative outgrowth) that restore the various tissues of the fin, including blood vessels, nerves, connective tissue, epidermis, pigment cells and lepidotrichia, the skeletal elements that support the fin structure. Lepidotrichia are elongated bony rays of dermal origin that run from proximal to distal in the caudal fin (Akimenko et al., 2003). Each lepidotrichia is composed of concave and opposed hemirays with intra-ray mesenchymal tissue (Montes et al., 1982). The caudal fin skeletal tissue is laid down by scleroblasts, skeletogenic cells equivalent to mammalian osteoblasts that secrete the lepidotrichia matrix (Hall, 2005).
It has been hypothesised that upon amputation of the adult zebrafish caudal fin, bony ray regeneration arises from the intra-ray mesenchymal cells that become disorganized, change their
shape, re-enter the cell cycle and migrate distally (Nechiporuk and Keating, 2002; Poleo et al., 2001; Santos-Ruiz et al., 2002). This intra-ray mesenchyme is thought to contain pluripotent, stem or progenitor cells that are activated upon amputation and participate in the formation of the blastema and subsequent tissue regeneration (Nakatani et al., 2008). The existence of this type of cells was, however, challenged by Nechiporuk and Keating (Nechiporuk and Keating, 2002). In an attempt to mark such stem cells, these authors observed that BrdU-retaining cells are not a major component of the blastema. Indeed, so far, only pigment cells have been proposed to arise from a population of stem cells distributed along the intra-ray tissue (Rawls and Johnson, 2000). An alternative hypothesis is that the blastema is a pool of cells originating from different mature tissues that undergo dedifferentiation and integrate into the blastema, as demonstrated for muscle fibres in the regenerating tail of urodele amphibians (Echeverri et al., 2001; Straube and Tanaka, 2006). In this scenario, the blastema is composed of a heterogeneous pool of lineage restricted progenitor cells (Kragl et al., 2009). Lepidotrichia regeneration has been reported to start after blastema formation (24-48 hours post-amputation; hpa), as a patterning mechanism beginning at 72 hpa when blastemal cells receive patterning signals from the basal layer of the epidermis, leave the blastema and integrate into the population of scleroblasts that align at the stump to secrete lepidotrichia matrix (Nechiporuk and Keating, 2002; Smith et al., 2006).
In this study, we have sought to define how early the process of lepidotrichia regeneration is initiated in the zebrafish caudal fin, and to identify the origin of cells that contribute to the blastema during regeneration. In light of the two current hypotheses, we have explored the possibility that differentiated skeletal cells contribute to fin regeneration. We provide evidence that differentiated scleroblasts from the bony ray lining re-enter the cell cycle, detach from the lepidotrichia surface, migrate distally, integrate into the blastema and dedifferentiate. These findings highlight the contribution of differentiated scleroblasts to epimorphic appendage regeneration in zebrafish.
Development 138, 3897-3905 (2011) doi:10.1242/dev.064717 © 2011. Published by The Company of Biologists Lt
1Instituto de Medicina Molecular, Faculdade de Medicina da Universidade de Lisboa, 1649-028 Lisboa, Portugal. 2PhD Programme in Experimental Biology and Biomedicine (5th PDBEB), Center for Neuroscience and Cell Biology, University of Coimbra, 3004-517 Coimbra, Portugal.3CCMAR, Universidade do Algarve, 8005-139 Faro, Portugal. 4Instituto Gulbenkian de Ciência, 2780-156 Oeiras, Portugal. 5Departamento de Anatomía Humana, Biología Celular y Zoología, Facultad de Medicina, Universidad de Extremadura, 06006 Badajoz, Spain. 6MRC Centre for Developmental and Biomedical Genetics, University of Sheffield, Sheffield S10 2TN, UK.
*These authors contributed equally to this work
‡Present address: TechnoPhage, SA, 1649-028 Lisboa, Portugal §Author for correspondence ([email protected])
Accepted 9 July 2011 SUMMARY
The origin of cells that generate the blastema following appendage amputation has been a long-standing question in epimorphic regeneration studies. The blastema is thought to originate from either stem (or progenitor) cells or differentiated cells of various tissues that undergo dedifferentiation. Here, we investigate the origin of cells that contribute to the regeneration of zebrafish caudal fin skeletal elements. We provide evidence that the process of lepidotrichia (bony rays) regeneration is initiated as early as 24 hours post-amputation and that differentiated scleroblasts acquire a proliferative state, detach from the lepidotrichia surface, migrate distally, integrate into the blastema and dedifferentiate. These findings provide novel insights into the origin of cells in epimorphic appendage regeneration in zebrafish and suggest conservation of regeneration mechanisms between fish and amphibians.
KEY WORDS: Fin regeneration, Skeletal regeneration, Blastema formation, Dedifferentiation, Zebrafish
Differentiated skeletal cells contribute to blastema
formation during zebrafish fin regeneration
Sara Sousa1,*,2, Nuno Afonso1,*,‡, Anabela Bensimon-Brito3, Mariana Fonseca1, Mariana Simões1, Joaquín Leon4,5, Henry Roehl6, Maria Leonor Cancela3and António Jacinto1,4,§
D
E
V
E
LO
P
M
E
N
T
MATERIALS AND METHODS Fish manipulation and amputation
Wild-type AB strain adult zebrafish, Danio rerio (3- to 6-months old) were anaesthetised in 0.1% MS-222 (Sigma) and the caudal fins amputated using a scalpel. Regeneration was then allowed to proceed until defined time points at 33°C. Fish were then anaesthetised and regenerates were collected for analysis.
Whole-mount in situ hybridisation
Fins were fixed overnight in 4% paraformaldeyde (PFA) in phosphate buffered saline (PBS), dehydrated in ethanol at room temperature (RT) and stored at –20°C at least overnight. Fins were then rehydrated in an ethanol-PBS plus 0.1% Tween 20; PBT) series. A solution of 6% H2O2in PBT was
used for 30 minutes to inactivate endogenous peroxidases, followed by washes in PBT. Proteinase K (10 mg/ml) digestion was performed for 15 minutes and then stopped by washing with a glycine solution (2 mg/ml in PBT). After a brief wash in PBT, fins were refixed with 3.7% formaldehyde solution, 0.2% glutaraldehyde in PBT for 20 minutes, and then washed with PBT. Fins were prehybridised for >1 hour at 70°C, in hybridisation solution (Hyb solution) containing 60% formamide, 5⫻ SSC (20⫻, pH 6.0), 500 g/ml tRNA, 0.1% Tween 20 (10%), 50 g/ml heparin, in miliQ H2O. Fins were then hybridised in Hyb solution, containing 5
l/ml digoxigenin (DIG)-labelled RNA probe, overnight at 70°C. The next day, unhybridised probe was removed using washing solutions I and II (washing solution I: formamide 50%, 1⫻ SCC, 0.1% Tween 20; washing solution II: 50% wash I, 50% Tris-buffered saline plus 0.1% Tween 20; TBST) at 70°C for 15-30 minutes (wash I: 2⫻15 minutes + 2⫻30 minutes; wash II: 2⫻20 minutes). Fins were then washed with TBST, incubated with blocking solution (10% sheep serum in TBST) at RT for several hours, and then incubated with anti-digoxigenin antibody coupled to alkaline phosphatase (Roche) 1:2500 in blocking solution, overnight, at 4°C. The anti-digoxigenin antibody was removed by several washes with TBST. For the alkaline phosphatase reaction, fins were washed in three changes of NTMT reaction buffer (5 M NaCl, 1 M Tris-HCl pH 9.5, 1 M MgCl2, 10%
Tween 20, in H2O MQ). In situ hybridisations were stained with Purple AP
Substrate (Roche).
DIG-labelled antisense RNA probes for all studied genes were synthesised as previously described by Henrique et al. (Henrique et al., 1995). For cross sections, fins were embedded in gelatin, processed using standard conditions and sectioned (10-14 m) using a cryostat (Leica). In situ hybridisation on cryosections was performed as described by Smith et al. (Smith et al., 2008). Details for RNA probes for sox9a, osterix (sp7 – Zebrafish Information Network), col1a2 and col10a1 genes were described by Li et al. (Li et al., 2009).
Immunohistochemistry
The fins were fixed in a solution of 80% methanol, 20% DMSO (Sigma). For whole-mount specimens, the fins were rehydrated in a methanol-PBS series, permeabilised with acetone at –20°C for 20 minutes, followed by two washes in PBS. An additional permeabilisation step was carried out with a PBST 0.5% solution (PBS with 0.5% Triton X-100) for 30 minutes. Fins were then washed several times with PBS, blocked in PBS with 10% foetal bovine serum (FBS) and incubated with primary antibody overnight at 4°C. The next day, fins were washed several times in PBS and incubated with the secondary antibody overnight at 4°C. They were then mounted for analysis. For cryostat sections, fins were fixed in 80% methanol, 20% DMSO (Sigma) or 4% PFA-PBS, and processed. Sections were washed twice in PBS at 37°C for 10 minutes, followed by a glycine (0.1 M) wash for 10 minutes at RT. The permeabilisation was carried out with PBST 0.5% for 20 minutes at RT. Following several washes in PBS, sections were blocked in 0.3% PBST with 0.25% BSA (Sigma), and incubated with primary antibody overnight at 4°C. After primary antibody binding, samples were washed three times in PBS for 5 minutes. Appropriate secondary antibodies were diluted in blocking solution and incubated overnight at 4°C. All sections were counterstained with 0.15% (w/v) 4 ⬘,6-diamidino-2-phenylindole (DAPI; Sigma) for 5 minutes, washed three times in PBS for 5 minutes and mounted for analysis. The primary antibodies used were the monoclonal anti-Zns5 antibody to mark
scleroblasts (ZIRC 011604), anti-Osteocalcin antibody described by Simes et al., anti-PCNA antibody to label cell proliferation (F2007; Santa Cruz Biotech), anti-GFP antibody (Abcam) and anti-Msxb antibody (4G1-c; Hybridoma Bank) (Simes et al., 2004). For simultaneous detection of osterix mRNA and osteocalcin:GFP (osteocalcin is also known as bglap – Zebrafish Information Network), a anti-GFP antibody (ab290; Abcam) was added following in situ hybridisation, in which the alkaline phosphatase (AP) substrate was Fast Red (Roche).
Zebrafish transgenic lines
The transgenic line used for cell tracing experiments was Tg(eab2:EGFP-T-mCherry) crossed with Tg(osteocalcin:GFP). These lines were kindly provided by Wenbiao Chen (Vollum Institute, Oregon Health and Sciences University, Portland, USA) [described by Boniface et al. (Boniface et al., 2009)] and Stefan Shulter-Merker (Hubrecht Institute-KNAW and University Medical Centre, Uppsalalaan 8, 3584 CT Utrecht, The Netherlands), respectively. The transgenic line Tg(osteocalcin:GFP) was also crossed with Tg(osterix:mCherry), as described by Spoorendonk et al. (Spoorendonk et al., 2008).
Cell labelling and tracing
The pCS2-Cre plasmid (provided by Thomas Look) [described by Langenau et al. (Langenau et al., 2005)] was digested with NotI, and the linear template was transcribed using the mMESSAGE mMACHINE High Yield Capped RNA Transcription Kit (Ambion). Double transgenic embryos Tg(eab2:EGFP-T-mCherry; osteocalcin:GFP) were injected with synthetic Cre mRNA (100 ng in 1.4 nl) at the 1- to 2-cell stage to create mosaics clones. A PV-820 Picoinjector (World Precision Instruments) and a Narashige micromanipulator were used for microinjection. Embryos were left to grow at 28°C until adulthood. Fins of double transgenic adult fish aged 3 months old were amputated and regeneration was followed at different time points. The sequential images are always of the ray of the same transgenic fish. For the shorter time-lapse experiment the anaesthesia was prepared as described in Huang et al. (Huang et al., 2010). The fish were anaesthetised with the MS-222 (Sigma) for ~3 minutes before the addition of the mixture of MS-222 and isoflurane, which was used during the time-lapse confocal imaging. The images were analysed with the ImageJ ‘StackReg’ plugin and some cells were coloured for better identification of their shape and position.
Microscopy
Images of in situ hybridisation were obtained with a Leica Z6APO stereomicroscope equipped with a Leica DFC490 digital camera. For cell number analysis and cell tracing experiments in transgenic lines, images were captured on a Zeiss LSM 510 META confocal microscope or a Zeiss LSM 710 confocal microscope. The stacks were analysed and cells counted using ImageJ software. In experiments in which cells were counted, a minimum of three different individuals for each condition were analysed. The plots were obtained and statistically analysed with GraphPad Prism software.
Total RNA isolation and quantitative gene expression analysis
Total RNA was extracted from regenerating fins, including the first bony ray segment and the blastema tissue (five fins per extraction) as described by Chomczynski and Sacchi (Chomczynski and Sacchi, 1987) and was then treated with RQ1 DNase (Promega) according to the manufacturer’s protocol. RNA quantity and quality was determined by UV absorbance and electophoresis. cDNA was then prepared from 1 g of total RNA from each sample using Moloney-murine leukemia virus (M-MLV) reverse transcriptase (Invitrogen), RNase Out (Invitrogen) and an oligo(dT) adapter [5⬘-ACGCGTCGACCTCGAGATCGATG(T)13-3⬘] in a 20 l volume for 1 hour at 37°C. For quantitative real-time PCR a StepOnePlus 96 (Applied Biosystems) was used together with 1⫻ SsoFastTMEvaGreen Supermix (Bio-Rad), 0.2 M forward and reverse
primers and 100 ng of reverse-transcribed RNA under the following PCR conditions: 15 minutes at 95°C, 40-50 cycles (each cycle was 30 seconds at 95°C, 15 seconds at 68°C). Gel electrophoresis and melt curve analysis were used to confirm specific product formation. Data were statistically analysed using the Kruskal-Wallis test followed by the non-parametric
D
E
V
E
LO
P
M
E
N
T
paired Wilcoxon post-hoc t-test. All the values were significantly different from the uncut control, with a P-value <0.05, except when indicated in the respective figure legend.
RESULTS
Prompt activation of skeletogenesis genes reveals an early onset of lepidotrichia regeneration From expression studies of skeletogenesis genes at 72 and 96 hpa (Smith et al., 2006; Smith et al., 2008; Brown et al., 2009) it is thought that during caudal fin regeneration lepidotrichia regeneration starts after the blastema formation. However, gene expression analysis at earlier phases has never been done systematically. In order to refine the timing of lepidotrichia regeneration onset we performed a comprehensive expression analysis of the genes that are classically associated with vertebrate bone formation at earlier stages of regeneration, from 12 to 72 hpa by in situ hybridisation (ISH). The genes studied include the early skeletogenesis markers sox9a and osterix, markers of the intermediate stages of skeletogenesis (bone matrix deposition stages) col1a2 and col10a1, and also late differentiation markers involved in mineralisation, osteonectin (sparc – Zebrafish Information Network) and osteocalcin (bglap – Zebrafish Information Network) (Fig. 1). We found that sox9a was upregulated at 12 and 24 hpa within the bony rays (Fig. 1A,B) and was also detected in the blastema at 48 and 72 hpa (Fig. 1C,D). At 48 hpa, sox9a was detected specifically in both the intra-ray mesenchyme and the basal layer of the epidermis (see Fig. S1A in the supplementary material). osterix, the expression of which marks osteoblast progenitors, was first detected at 24 hpa (Fig. 1E,F), at the blastema. This expression domain was maintained at 48 and 72 hpa (Fig. 1G,H) to include a strong expression domain at 72 hpa where scleroblasts align to form the regenerated lepidotrichia (Fig. 1H). Indeed, osterix was detected at the site where the first scleroblasts align, just distal to the amputation site, as early as 48 hpa (see Fig. S1B in the supplementary material). Also col1a2 and col10a1 expression was not detectable at 12 hpa (Fig. 1I,M), whereas from 24 to 72 hpa, expression of both genes was strongly detected within the blastema (Fig. 1J-L,N-P). Interestingly, col1a2 mRNA, a collagen type generally associated with bone matrix formation, was distributed throughout the blastema at 48 hpa (see Fig. S1C in the supplementary material), including the mesenchyme of the blastema. By contrast, the col10a1 expression domain was restricted to the aligning scleroblasts just distal to the amputation plane of the bony ray (see Fig. S1D in the supplementary material). It is also noteworthy that at 72 hpa, col10a1 expression was restricted to the ray domains of the blastema, whereas col1a2 mRNA had a more widespread distribution in the blastema, including the inter-ray domain (Fig. 1L,P). Similarly, osteonectin, a gene that encodes a bone matrix protein, was also not present at 12 hpa (Fig. 1Q), being just detected at 24 hpa at the amputation site (Fig. 1R). Later, at 48 and 72 hpa (Fig. 1S,T), the expression of osteonectin was also detected at high levels just distal to the amputation site, similar to that of osterix (compare Fig. 1H and 1T). osteocalcin, a gene that also encodes a bone matrix protein, was not present at 12 hpa (Fig. 1U) and was weakly detected at 24 and 48 hpa (Fig. 1V,W). At 72 hpa (Fig. 1X) osteocalcin was present within the bony rays and just distal to the amputation plane where mineralization is occurring at this stage. In the distal portion of uncut samples all the analysed genes had undetectable or very low expression. (Fig. 1D⬘,H⬘,L⬘,P⬘,T⬘,X⬘). In particular, expression of osterix and col10a1 could be detected at the most distal tip of the fin, where the fin is slowly but continuously growing.
Together, these data show that expression of skeletogenesis genes is strongly upregulated during the initial stages of caudal fin regeneration in the adult zebrafish and suggest that the process of lepidotrichia regeneration is initiated as early as 24 hpa.
Skeletal cells are present during early stages of bone regeneration
Following our in situ hybridisation analysis that suggested that the process of lepidotrichia regeneration starts at 24 hpa, we wanted to know whether skeletal cells were actually present at those early stages of regeneration. To mark these cells we took advantage of the Zns5 antibody, which is widely used to label scleroblasts at various stages of differentiation (Johnson and Weston, 1995). To identify the domains marked by Zns5, we carried out a detailed analysis by immunohistochemistry on whole mounts and cross sections of uncut, 24 and 48 hpa regenerating fins. We found that Zns5 stained bone lining scleroblasts (BLS) at all stages studied (Fig. 2), including uncut samples (Fig. 2A,B). At 24 hpa, the expression of Zns5 was Fig. 1. Expression of skeletogenesis genes during early stages of caudal fin regeneration. (A-X⬘) Whole-mount in situ hybridisation of
(A-D⬘) sox9a, (E-H⬘) osterix, (I-L⬘) col1a2, (M-P⬘) col10a1, (Q-T⬘) osteonectin and (U-X⬘) osteocalcin at 12, 24, 48 and 72 hpa and in uncut specimens in the distal region of the fin. Scale bars: 100m in regenerating fins and 200m in uncut fins. Arrowheads indicate the amputation plane.
D
E
V
E
LO
P
M
E
N
T
also seen in the earliest aligning scleroblasts (AS) located just distal to the amputation site of the bony ray (Fig. 2C,D). At 48 hpa, there was an increase in the number of aligning scleroblasts compared with 24 hpa (Fig. 2E,F). These data provide evidence that scleroblast alignment is initiated as early as 24 hpa.
Differentiated scleroblasts proliferate during lepidotrichia regeneration
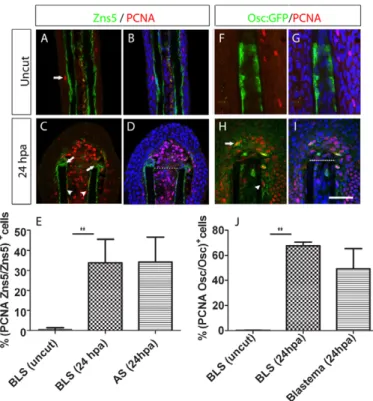
In order to investigate how early bone tissues proliferate in response to amputation we assessed the expression of proliferating cell nuclear antigen (PCNA) in Zns5-positive cells at 24 hpa. Our immunohistochemistry data showed that cell proliferation was sporadic in the epidermis of the uncut samples and was detected at very low levels in BLSs (Fig. 3A,B). However, cell proliferation was strongly enhanced in BLSs at 24 hpa to over 30% of all cells of each subtype (Fig. 3C-E). Interestingly, at 24 hpa the AS population proliferated at a similar rate to the BLS population (Fig. 3C-E).
To further characterise the pattern of cell division in differentiated scleroblasts upon amputation of the caudal fin, we have analysed the proliferative state of the osteocalcin-expressing scleroblasts by immunohistochemistry in whole-mount samples. We used a transgenic zebrafish line that expressed GFP under the control of an osteocalcin promoter (see Materials and methods for further details), and found that osteocalcin-expressing scleroblasts do not express PCNA before amputation (Fig. 3F,G). However, at 24 hpa osteocalcin-expressing BLSs accounted for over 60% of all osteocalcin-expressing cells (Fig. 3H-J). Moreover, we also found osteocalcin-expressing cells at the blastema compartment that were positive for both GFP and PCNA, accounting for ~40% of all osteocalcin-expressing cells at the blastema (Fig. 3H-J). These data provide further evidence that BLSs, which are differentiated scleroblasts, acquire a proliferative state upon amputation of the caudal fin.
In summary, we show that osteocalcin-expressing BLSs acquire a striking proliferative pattern upon amputation and that osteocalcin-expressing cells are also present at the blastema, thus implicating this cell population as a potential player in the blastema formation process.
Differentiated scleroblasts migrate to the blastema Next, we decided to focus our efforts on tracking differentiated cells that were located in the bone lining of the lepidotrichia to check whether, upon amputation, they migrate from their location to participate in the regeneration of the ray. We used an osteocalcin-Fig. 2. Zns5 expression domains during early stages of fin
regeneration. (A-F)Immunostaining with Zns5 antibody in (A,C,E) whole mount and (B,D,F) longitudinal cryosections of (A,B) uncut, (C,D) 24 hpa, (E,F) 48 hpa fins. The arrowhead in C indicates Zns5-positive cells at the blastema. The arrows in D and F indicate aligning scleroblasts. Scale bar: 50m (45m in B). Dashed lines indicate amputation plane.
Fig. 3. Proliferation of bone-lining cells increases upon amputation of the caudal fin. (A-D)Double immunohistochemistry with PCNA and Zns5 antibody in wild-type fins. (A,B)Uncut and (C,D) 24 hpa fins. (A,C)Zns5 (green) and PCNA (red). (B,D)Zns5 (green), PCNA (red) and DAPI (blue). The arrow in A indicates an proliferating epidermal cell. The arrowheads in C indicate proliferating BLSs and the arrows indicate aligning proliferating scleroblasts. (E)Percentage of the total Zns5-positive cells that were also positive for PCNA in the BLS and AS populations, calculated for the first segment below and above the amputation plane at 24 hpa, and in the equivalent region of uncut fins. There was a significant increase in double-positive BLSs in the 24 hpa samples compared with uncut samples (Student’s t-test, P<0.05; n5 for each condition). (F-I)Double immunohistochemistry with GFP and PCNA antibody in Tg(osteocalcin:GFP) fins. (F,G)Uncut fin. (H,I)24 hpa fin. (F,H)osteocalcin:GFP (green) and PCNA (red). (G,I)osteocalcin:GFP (green), PCNA (red) and DAPI (blue). In H, the arrow indicates a proliferating osteocalcin-expressing cell within the blastema; the arrowhead indicates a proliferating osteocalcin-expressing BLS. (J)Percentage of cells double-positive for osteocalcin:GFP and PCNA over the total osteocalcin:GFP-positive cells, in the BLS and blastema populations, calculated for the first segment below and above the amputation plane at 24 hpa, and in the equivalent region of uncut fins. There was a significant increase in double-positive BLSs in the 24 hpa samples compared with uncut samples (Student’s t-test, P<0.05; n5-8 for each condition). Scale bar: 100m in A,B,F-I and 75m in C,D. Dashed lines indicate amputation plane.
D
E
V
E
LO
P
M
E
N
T
expressing reporter line because this gene is a late skeletogenesis marker that is present in differentiated scleroblasts. In uncut samples, osteocalcin was strongly detected throughout the internal bone lining of all hemiray segments analysed, except at the joint level (Fig. 4A). At 24 hpa, osteocalcin reporter cells were seen not only at the bone lining but also at the blastemal compartment, representing ~10% of the blastema cell population (Fig. 4B,E,I). At 30 and 48 hpa, the number of osteocalcin reporter cells at the blastema was reduced to ~5% of all blastema cells (Fig. 4G-I).
Interestingly, at 24 hpa osteocalcin BLSs appeared to detach from the bone surface as their number seemed to decrease in the vicinity of the amputation plane (Fig. 4B, arrowhead). This was accompanied by a change in their shape from elongated in the uncut samples (Fig. 4C,D) to more rounded at 24 hpa (Fig. 4E,F). Together these data suggest that osteocalcin BLSs migrate distally. To further assess this observation and to demonstrate that it is very unlikely that these GFP-positive cells arise from any other cell type that eventually starts to activate osteocalcin expression, we searched for the presence of osteocalcin:GFP by in situ hybridisation in the regenerating fins at 24 and 48 hpa. We did not find any de novo transcriptional activation of the transgene at the blastema region, when compared with the proximal region of the uncut fin (see Fig. S2A-C in the supplementary material), thus indicating that GFP-positive cells at the blastema are those that have migrated from the bone lining.
To further test the hypothesis of differentiated scleroblast migration we used a double transgenic approach to allow in vivo tracking of individual scleroblasts. The first transgene labels differentiated scleroblasts by expressing GFP under the control of an osteocalcin promoter (Fig. 5A-F). The second transgene expresses GFP under the control of a ubiquitous promoter, but its expression can be switched to mCherry by the activity of Cre recombinase (see Materials and methods) (Boniface et al., 2009). The injection of Cre recombinase mRNA during embryonic development creates mosaic embryos, in which some cells change their reporter expression. During adulthood, all GFP-expressing cells that have recombined and express mCherry will not express GFP any longer under the control of the constitutive promoter (Boniface et al., 2009). This technique generates a low number of mCherry-expressing cells, the position of which can be tracked both before and after amputation of the caudal fin. Because some mCherry-expressing cells will be positive for the osteocalcin:GFP transgene, they are seen as yellow. By tracking these yellow scleroblasts in vivo in the same ray of the same animal at different time points, we have been able to trace their fate after amputation of the caudal fin.
Before fin amputation, we identified the yellow cells to be tracked (Fig. 5A), and then followed them live, starting at 12 hpa (Fig. 5B-E). We observe that osteocalcin-positive cells localized in the bone lining near the amputation site at 12 hpa (Fig. 5B) were present in the blastema at 24 hpa (Fig. 5C), showing that differentiated scleroblasts migrate into the mesenchymal pool of blastema cells. Note that up to 48 hpa the yellow cells present in the blastema did not express osteocalcin:GFP de novo (see Fig. S2A-C in the supplementary material) so they must originate from the bone lining. Gradually, from 24 to 34 hpa the yellow cells turned red, which indicates downregulation of the osteocalcin transgene (Fig. 5C-E), and suggests that scleroblasts arising from the bone lining were losing one of their differentiation markers. To further confirm the hypothesis that osteocalcin is downregulated, we performed quantitative PCR (qPCR) to quantify the levels of osteocalcin mRNA from 12 to 96 hpa Our qPCR data show that osteocalcin mRNA decreases from 12 to 48 hpa as compared with
the levels in uncut fins (Fig. 5G). By contrast, from 48 to 96 hpa, osteocalcin mRNA levels progressively increased relatively to the uncut controls (Fig. 5G). This indicates that scleroblasts that migrate to the blastema completely lose osteocalcin expression by 48 hpa and that later, at 72 hpa, new bone cells start to express osteocalcin, because the yellow labelling reappeared in the aligning scleroblasts (Fig. 5G; see Fig. S3 in the supplementary material).
To provide additional evidence that osteocalcin-positive cells can move towards the blastema from 12 to 24 hpa, we performed in vivo imaging of osteocalcin:GFP transgenic fish using shorter Fig. 4. Presence of GFP-positive osteocalcin-reporter cells in the blastema upon amputation of the caudal fin. (A,B) osteocalcin-reporter expression in Tg(osteocalcin:GFP) fins. (A)Uncut fin. (B)24 hpa fin. The arrow indicates osteocalcin-expressing cells at the blastema and the arrowhead indicates the lack of the osteocalcin reporter expression. (C-H)Immunohistochemistry for GFP in Tg(osteocalcin:GFP) fins. (C,D)Uncut fin. (E,F)24 hpa fin. The arrow indicates osteocalcin-expressing cell in the blastema. D and F are magnified optical slices of C and E, respectively. (G)30 hpa fin. (H)48 hpa fin. (I)Percentage of osteocalcin:GFP-expressing cells over the total DAPI-stained nuclei in the blastema population. There were significantly fewer
osteocalcin:GFP-expressing cells at 30 and 48 hpa than at 24 hpa (Student’s t-test, P<0.05; n11-13 for each condition). Scale bar: 115m in A; 100m in B; 50m in C,E,G,H; 20m in D and F. Dashed lines indicate amputation plane.
D
E
V
E
LO
P
M
E
N
T
imaging intervals, which, because of phototoxicity, could not be shorter than 20 minutes. This led us to the identification of 19-21 hpa as the crucial time when the scleroblast movement is initiated. We tracked osteocalcin:GFP BLSs, starting at 19 hpa when these cells were at the bone lining (Fig. 5H) and followed their movement to the newly formed blastema (Fig. 5H-M; see Movie 1 in the supplementary material). To facilitate visualization we have colour coded (green) two examples of individual cells where cell shape changes and movement to the blastema is clear. Interestingly, in this sequence of images it is also possible to see an
osteocalcin:GFP cell dividing (Fig. 5J, arrow). In uncut fins we never observed any significant movement of osteocalcin:GFP cells (see Movie 2 in the supplementary material). These results provide compelling evidence that osteocalcin-expressing BLSs are able to detach from the bone lining and migrate towards the blastema. Scleroblasts dedifferentiate
The qPCR data indicated that osteocalcin was downregulated from 12 to 48 hpa (Fig. 5G); however, the protein was still present at 24 hpa because Osteocalcin-expressing cells were seen at the blastema Fig. 5. Differentiated scleroblasts from bone lining migrate to integrate in the blastema. (A-E)In vivo confocal images from a double transgenic Tg(eab2:EGFP-T-mCherry; osteocalcin:GFP) fish, injected with Cre mRNA. (A)Uncut fin; the arrows indicate yellow cells in the bone lining to be tracked upon amputation. (B)12 hpa fin, the arrows indicate tracked yellow cells in the lining of the bone that have become rounder, indicative of their proliferative state. (C)24 hpa fin; the yellow cells have migrated from the bone lining to the blastema. (D)30 hpa fin. (E)34 hpa fin. In D and E, the arrows mark yellow cells that progressively lose GFP expression driven by the osteocalcin promoter and expresses only mCherry. The sequential images (B-F) were taken from the same ray of the same transgenic fish, in total we tracked five animals. The images are a projection of several confocal optical slices. Scale bar: 50m in all images. Dashed lines indicate amputation plane. (F)A diagram showing the different possible outcomes of a cell from a double transgenic fish, Tg(eab2:EGFP-T-mCherry; osteocalcin:GFP) injected with Cre mRNA. An osteocalcin:GFP-positive cell in which the switchable marker (eab2:EGFP-T-mCherry) has not been activated is seen as a green cell. However, with the activation, the osteocalcin:GFP-positive cell also expresses mCherry, and is seen as yellow. Then, if the osteocalcin:GFP expression is downregulated the yellow cell can be seen as red. This red cell can turn yellow again when osteocalcin:GFP is re-expressed at 72 hpa (G)qPCR shows that at 12-48 hpa
osteocalcin expression decreases compared with uncut fins and that at 72 and 96 hpa this expression increases sixfold and 23-fold, respectively (P<0.05, n6 for each condition). (H-M)In vivo imaging of Tg(osteocalcin:GFP) from 19 to 20.5 hpa. The interval between each frame is 20 minutes. (H)A single ostecalcin-positive cell, artificially coloured green, is tracked in the subsequent images, I-M (in H the position of this cell was not clear). It is possible to see the cell extending protrusions, changing shape and migrating to integrate in the blastema. Another osteocalcin-positive cell at the bone lining is identified in I and is tracked in sequential images, J-M. The arrow in J indicates a proliferating osteocalcin-osteocalcin-positive cell. Scale bar: 50m in all images. Arrowheads indicate amputation plane.
D
E
V
E
LO
P
M
E
N
T
(see Fig. S4 in the supplementary material). To analyse further the state of differentiation of the osteocalcin reporter cells at the blastema we looked for osterix expression in these cells. osterix, a transcription factor present in early committed scleroblasts, was expressed at the distal tip of the uncut samples (see Fig. S2D in the supplementary material), whereas near the amputation zone it was detected at very low levels, making it difficult to find double-positive cells for osteocalcin and osterix in uncut samples (Fig. 6A,D). At 24 hpa the number of cells positive for both osteocalcin and osterix was not significantly different from that of uncut samples (Fig. 6D). Sporadically, we found double-positive cells at the blastema, in agreement with the expression level of the osterix:mCherry mRNA at this time-point (Fig. 6B,D; see Fig. S2E in the supplementary material). However, the number of double-positive cells, as well as the osterix:mCherry mRNA, increased significantly at 48 hpa (Fig. 6C,D; see Fig. S2F in the supplementary material). At this time-point the population of double-positive cells represented almost 80% of all osteocalcin-expressing cells at the blastema, a significant increase compared with the numbers at 24 hpa and in uncut samples (Fig. 6C,D). We performed in situ hybridisation followed by immunohistochemistry to further confirm the re-expression of osterix mRNA by dedifferentiating osteocalcin-expressing cells at the blastema (see Fig. S5 in the supplementary material). Taken together these data support the view that differentiated scleroblasts dedifferentiate at the blastema; they lose osteocalcin expression and
start to re-express osterix, an early marker of committed scleroblasts. We also investigated whether these cells can revert to a fully undifferentiated state by testing co-expression of msxb, a transcription factor implicated in the maintenance undifferentiated cells (Odelberg et al., 2000; Song et al., 1992; Nechiporuk et al., 2002). In uncut samples, there was no Msxb (see Fig. S6A,B in the supplementary material). At 48 hpa, while the cells were dedifferentiating, Msxb-positive cells were present at the blastema but we did not find any colocalisation with osteocalcin-expressing cells (see Fig. S6C,D in the supplementary material).
DISCUSSION
Appendage regeneration in fish has been intensively studied in the last decades; however, the origin of the blastema has remained elusive. Two different possible sources for these cells have been proposed: dedifferentiation of mature cells or activation of quiescent progenitors or stem cells (Kawakami, 2009). Here, we focused on the earliest stages of regeneration to address the potential contribution of differentiated scleroblasts to the blastema. We provide evidence that upon amputation, these differentiated bone cells acquire a proliferative state and migrate distally to integrate with the blastema and dedifferentiate.
Lepidotrichia regeneration is initiated as early as 24 hpa in adult zebrafish caudal fin
Previous bone regeneration studies in the caudal fin have been mainly limited to regenerative outgrowth stages, i.e. from 72 hpa onwards (Smith et al., 2006; Smith et al., 2008; Brown et al., 2009). The gene expression analysis at early stages of fin regeneration presented here reveals that some of the genes that specify skeletal lineages are present as early as 24 hpa. In the case of sox9a the expression starts even earlier, as it was detected at 12 hpa in the intra-ray mesenchyme. This expression is, at first glance, surprising as it is normally associated with cartilage differentiation (Yan et al., 2002; Grandel and Schulte-Merker, 1998). However, the caudal fin rays are dermal bone (Geraudie and Landis, 1982; Santamaria et al., 1992) and are an example of a skeletal tissue in which chondrocyte markers, such as sox9a, are expressed (Smith et al., 2006). It is possible that the expression of sox9a in the intra-ray mesenchyme may indicate another source of skeletal progenitor cells that could contribute to regeneration; a hypothesis that we have not explored in this work.
In order to study in more detail the localisation of skeletal cells during the earliest stages of bony ray regeneration, we conducted immunohistochemistry with the Zns5 antibody, widely used to detect scleroblasts (Johnson and Weston, 1995). We found that Zns5 stained not only BLSs, but also ASs, which are localised just proximal to the stump, from 24 hpa onwards. We conclude from our molecular and cellular analysis that the lepidotrichia regeneration process is initiated no later than 24 hpa and that at 72 hpa the bone cells are already ongoing differentiation.
Differentiated scleroblasts near the stump acquire a proliferative state, change shape, migrate into the blastema and dedifferentiate
The regeneration of the fin rays implies a significant re-growth of bone tissue. In order to analyse the proliferative state of skeletal cells we performed double immunostainings with the cell proliferation marker PCNA along with either Zns5 or GFP in an osteocalcin reporter zebrafish line. Although little proliferation was observed in uncut fins, Zns5-positive BLSs noticeably proliferated in the proximity of the amputation plane at 24 hpa. Moreover, within Zns5-Fig. 6. osteocalcin-positive scleroblasts at the blastema start to
express de novo osterix, an early marker for skeletal
differentiation. (A-C)osterix- and osteocalcin-reporter expression in double Tg(osterix:mCherry; osteocalcin:GFP) fins. (A)Uncut fin. (B)24 hpa fin. (C)48 hpa fin. In B and C the arrows indicate cells co
expressing osterix and osteocalcin. Each image is a projection of several confocal optical slices. (D)Percentage of double-positive, osterix- and osteocalcin-expressing cells over the total of osteocalcin-expressing cells in the blastema population. There was a significant increase at 48 hpa compared with the uncut and 24 hpa samples (Student’s t-test, P<0.05; n5 or 6 for each condition). Scale bar: 50m. Dashed lines indicate
amputation plane.
D
E
V
E
LO
P
M
E
N
T
positive BLSs there was a subpopulation of osteocalcin-expressing BLSs that acquired a proliferative state, which has not previously been reported. This is very pertinent because, in general, differentiated cells rarely proliferate in their normal environment (Kawakami, 2009; Wagers and Weissman, 2004).
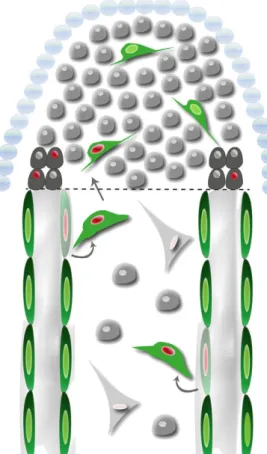
The proliferation of scleroblasts near the amputation plane suggests that they increase in number to feed the blastema. Next, we investigated whether these cells also acquire a migratory phenotype because the onset of the proliferative stage of regeneration has been proposed to be coincident with the onset of cell migration (Gardiner et al., 1996). To assess cell migration in vivo, we used a Cre-loxP cell tracing strategy, which revealed that osteocalcin-expressing scleroblasts near the amputation site detach from the internal surface of lepidotrichia to migrate distally and integrate with the proliferative pool of blastemal cells (Fig. 7). Indeed, the shape of these cells change from being elongated, squeezed and flat to rounded, which is the more usual form of migratory cells. We also show that osteocalcin-expressing BLSs start migrating into the blastema at ~19 hpa, making up ~10% of the blastema cell pool. A consequence of this migration is that the number of mature scleroblasts at the bone lining near the stump is reduced after 24 hpa. Taking into account the reacquisition of proliferative capacity by the osteocalcin BLSs, their shape changes and their migration, we can conclude that these cells contribute to the regenerating blastema. This conclusion differs fundamentally from the commonly accepted view, in which other mesenchymal cells from within the bony ray re-enter the cell cycle and migrate distally to produce the blastema.
From 24 hpa onwards the number of osteocalcin-expressing cells at the blastema decreases, probably as a consequence of the gradual reduction in expression of this gene. The downregulation of osteocalcin, a late bone differentiation marker, together with the
re-expression of an early marker, osterix indicates that osteocalcin-expressing cells dedifferentiate during the process of integration into the blastema. Dedifferentiation, defined as the cellular process by which a mature differentiated cell can revert to a progenitor state and re-express early marker genes, has been implicated in many aspects of urodele regeneration, including limb and tail regeneration (for a review, see Tanaka, 2003). In addition, it was recently reported that during zebrafish heart regeneration pre-existing cardiomyocytes also undergo dedifferentiation (Jopling et al., 2010; Kikuchi et al., 2010).
The fate of osteocalcin-expressing cells after dedifferentiation and integration into the blastema is difficult to assess in our experimental conditions because they downregulate osteocalcin:GFP and lose the yellow labelling in the blastema. It is possible that these cells redifferentiate into scleroblasts in light of the data reported by Kragl et al. who show, in urodeles, that cells redifferentiate to their original lineage (Kragl et al., 2009). Indeed, the blastema is enriched in differentiation and patterning signals that are known to be involved in bone tissue specification, such as FGF, BMPs and Shh (Smith et al., 2008; Lee et al., 2009; Laforest et al., 1998; Poss et al., 2000; Quint et al., 2002), which are secreted by the basal layer of the epidermis. Moreover, we report that dedifferentiated cells re-express an early osteoblast marker, osterix and in these cells we did not find coexpression with Msxb, a transcription factor implicated in the maintenance of undifferentiated cells (Odelberg et al., 2000; Song et al., 1992; Nechiporuk and Keating, 2002; Simon et al., 1995). This suggests that these cells probably are not reverting back to an embryonic or stem-like state but to a tissue-specific progenitor state. However, we cannot exclude the possibility that we did not detect any colocalization with Msxb because by this time-point osteocalcin is being downregulated.
Fig. 7. Differentiated scleroblasts that express osteocalcin start proliferating upon amputation, change shape, detach and migrate from the bone lining to participate in blastema formation, and dedifferentiate. Dashed
line indicates amputation plane.
D
E
V
E
LO
P
M
E
N
T
Altogether, we show that, at 24 hpa of the zebrafish caudal fin, differentiated scleroblasts arising from the stump proliferate, change their shape, migrate and dedifferentiate to contribute to the blastema population. Our study suggests conservation of epimorphic regeneration mechanisms among vertebrates, and demonstrates for the first time in vivo that migration and dedifferentiation of mature cells is an important mechanism for blastema formation in vertebrate regeneration.
Acknowledgements
We thank to Fish Facility technicians Lara Carvalho and Fábio Valério for support with animal care. We also thank Gisela Dionísio from UALG for technical assistance. S.S. and A.B. receive PhD grants from Fundação para a Ciência e Tecnologia (FCT), Portugal. N.A. received a post-doctoral grant from FCT. The research presented in this manuscript was funded by FCT research grants (PTDC/SAU-OBD/100200/2008; PTDC/SAU-OBD/73112/2006). J.R.L. is supported by a grant from the Ramon y Cajal program, MCIN, Spain. We thank Leonor Saúde, Isabel Campos, Rita Mateus and Jennifer Regan for reading the manuscript and for insightful discussions.
Competing interests statement
The authors declare no competing financial interests.
Supplementary material
Supplementary material for this article is available at
http://dev.biologists.org/lookup/suppl/doi:10.1242/dev.064717/-/DC1
References
Akimenko, M., Marí-Beffa, M., Becerra, J. and Géraudie, J. (2003). Old
questions, new tools, and some answers to the mystery of fin regeneration. Dev.
Dyn. 226, 190-201.
Boniface, E. J., Lu, J., Victoroff, T., Zhu, M. and Chen, W. (2009). FlEx-based
transgenic reporter lines for visualization of Cre and Flp activity in live zebrafish.
Genesis 47, 484-491.
Brown, A. M., Fisher, S. and Iovine, M. K. (2009). Osteoblast maturation occurs
in overlapping proximal-distal compartments during fin regeneration in zebrafish. Dev. Dyn. 238, 2922-2928.
Chomczynski, P. and Sacchi, N. (1987). Single-step method of RNA isolation by
acid guanidinium thiocyanate-phenol-chloroform extraction. Anal. Biochem.
162, 156-159.
Echeverri, K., Clarke, J. D. and Tanaka, E. M. (2001). In vivo imaging indicates
muscle fiber dedifferentiation is a major contributor to the regenerating tail blastema. Dev. Biol. 236, 151-164.
Gardiner, D. M. and Bryant, S. V. (1996). Molecular mechanisms in the control
of limb regeneration: the role of homeobox genes. Int. J. Dev. Biol. 40, 797-805.
Geraudie, J. and Landis, W. J. (1982). The fine structure of the developing pelvic
fin dermal skeleton in the trout Salmo gairdneri. Am. J. Anat. 163, 141-156.
Grandel, H. and Schulte-Merker, S. (1998). The development of the paired fins
in the zebrafish (Danio rerio). Mech. Dev. 79, 99-120.
Hall, B. K. (2005). Bones and Cartilage: Developmental and Evolutionary Skeletal Biology, 147 pp. London: Elsevier Academic Press.
Henrique, D., Adam, J., Myat, A., Chitnis, A., Lewis, J. and Ish-Horowicz, D.
(1995). Expression of a Delta homologue in prospective neurons in the chick.
Nature 375, 787-790.
Huang, W. C., Hsieh, Y. S., Chen, I. H., Wang, C. H., Chang, H. W., Yang, C. C., Ku, T. H., Yeh, S. R. and Chuang, Y. J. (2010). Combined use of MS-222
(tricaine) and isoflurane extends anesthesia time and minimizes cardiac rhythm side effects in adult zebrafish. Zebrafish 7, 297-304.
Johnson, S. L. and Weston, J. A. (1995). Temperature-sensitive mutations that
cause stage-specific defects in zebrafish fin regeneration. Genetics 141, 1583-1595.
Jopling, C., Sleep, E., Raya, M., Martí, M., Raya, A. and Belmonte, J. C. I.
(2010). Zebrafish heart regeneration occurs by cardiomyocyte dedifferentiation and proliferation. Nature 464, 606-609.
Kawakami, A. (2009). Stem cell system in tissue regeneration in fish. Dev. Growth Differ. 52, 77-87.
Kikuchi, K., Holdway, J. E., Werdich, A. A., Anderson, R. M., Fang, Y., Egnaczyk, G. F., Evans, T., Macrae, C. A., Stainier, D. Y. and Poss, K. D.
(2010). Primary contribution to zebrafish heart regeneration by gata4(+) cardiomyocytes. Nature 464, 601-605.
Kragl, M., Knapp, D., Nacu, E., Khattak, S., Maden, M., Epperlein, H. H. and Tanaka, E. M. (2009). Cells keep a memory of their tissue origin during axolotl
limb regeneration. Nature 460, 60-65.
Laforest, L., Brown, C. W., Poleo, G., Geraudie, J., Tada, M., Ekker, M. and Akimenko, M. A. (1998). Involvement of the sonic hedgehog, patched 1 and
bmp2 genes in patterning of the zebrafish dermal fin rays. Development 125, 4175-4184.
Langenau, D. M., Feng, H., Berghmans, S., Kanki, J. P., Kutok, J. L. and Look, A. T. (2005). Cre/lox-regulated transgenic zebrafish model with conditional
myc-induced T cell acute lymphoblastic leukemia. Proc. Natl. Acad. Sci. USA 102, 6068-6073.
Lee, Y., Hami, D., De Val, S., Kagermeier-Schenk, B., Wills, A., Black, B. L., Weidinger, G. and Poss, K. D. (2009). Maintenance of blastemal proliferation
by functionally diverse epidermis in regenerating zebrafish fins. Dev. Biol. 331, 270-280.
Li, N., Felber, K., Elks, P., Croucher, P. and Roehl, H. H. (2009). Tracking gene
expression during zebrafish osteoblast differentiation. Dev. Dyn. 238, 459-466.
Montes, G., Becerra, J., Toledo, O. M., Gordilho, M. A. and Junqueira, L. C.
(1982). Fine structure and histochemistry of the tail fin ray in teleosts.
Histochemistry 75, 363-376.
Morgan, T. H. (1901). Regeneration. New York: Macmillan Co.
Nakatani, Y., Nishidate, M., Fujita, M., Kawakami, A. and Kudo, A. (2008).
Migration of mesenchymal cell fated to blastema is necessary for fish fin regeneration. Dev. Growth Differ. 50, 71-83.
Nechiporuk, A. and Keating, M. T. (2002). A proliferation gradient between
proximal and msxb-expressing distal blastema directs zebrafish fin regeneration.
Development 129, 2607-2617.
Odelberg, S. J., Kollhoff, A. and Keating, M. T. (2000). Dedifferentiation of
mammalian myotubes induced by msx1. Cell 103, 1099-1109.
Poleo, G., Brown, C. W., Laforest, L. and Akimenko, M. A. (2001). Cell
proliferation and movement during early fin regeneration in zebrafish. Dev. Dyn.
221, 380-390.
Poss, K. D., Shen, J., Nechiporuk, A., McMahon, G., Thisse, B., Thisse, C. and Keating, M. T. (2000). Roles for Fgf signaling during zebrafish fin regeneration. Dev. Biol. 222, 347-358.
Quint, E., Smith, A., Avaron, F., Laforest, L., Miles, J., Gaffield, W. and Akimenko, M. A. (2002). Bone patterning is altered in the regenerating
zebrafish caudal fin after ectopic expression of sonic hedgehog and bmp2b or exposure to cyclopamine. Proc. Natl. Acad. Sci. USA 99, 8713-8718.
Rawls, J. F. and Johnson, S. L. (2000). Zebrafish kit mutation reveals primary and
secondary regulation of melanocyte development during fin stripe regeneration.
Development 127, 3715-3724.
Santamaria, J. A., Mari-Beffa, M. and Becerra, J. (1992). Interactions of the
lepidotrichial matrix components during tail fin regeneration in teleosts.
Differentiation 49, 143-150.
Santos-Ruiz, L., Santamaría, J. A., Ruiz-Sánchez, J. and Becerra, J. (2002). Cell
proliferation during blastema formation in the regenerating teleost fin. Dev. Dyn.
223, 262-272.
Simes, D. C., Williamson, M. K., Schaff, B. J., Gavaia, P. J., Ingleton, P. M., Price, P. A. and Cancela, M. L. (2004). Characterization of osteocalcin (BGP)
and matrix Gla protein (MGP) fish specific antibodies: validation for immunodetection studies in lower vertebrates. Calcif. Tissue Int. 74, 170-180.
Simon, H. G., Nelson, C., Goff, D., Laufer, E., Morgan, B. A. and Tabin, C.
(1995). Differential expression of myogenic regulatory genes and Msx-1 during dedifferentiation and redifferentiation of regenerating amphibian limbs. Dev.
Dyn. 202, 1-12.
Smith, A., Avaron, F., Guay, D., Padhi, B. K. and Akimenko, M. A. (2006).
Inhibition of BMP signaling during zebrafish fin regeneration disrupts fin growth and scleroblast differentiation and function. Dev. Biol. 299, 438-454.
Smith, A., Zhang, J., Guay, D., Quint, E., Johnson, A. and Akimenko, M. A.
(2008). Gene expression analysis on sections of zebrafish regenerating fins reveals limitations in the whole-mount in situ hybridization method. Dev. Dyn.
237, 417-425.
Song, K., Wang, Y. and Sassoon, D. (1992). Expression of Hox-7.1 in myoblasts
inhibits terminal differentiation and induces cell transformation. Nature 360, 477-481.
Spoorendonk, K. M., Peterson-Maduro, J., Renn, J., Trowe, T., Kranenbarg, S., Winkler, C. and Schulte-Merker, S. (2008). Retinoic acid and Cyp26b1 are
critical regulators of osteogenesis in the axial skeleton. Development 135, 3765-3774.
Straube, W. L. and Tanaka, E. M. (2006). Reversibility of the differentiated state:
regeneration in amphibians. Artif. Organs 30, 743-755.
Tanaka, E. (2003). Cell differentiation and cell fate during urodele tail and limb
regeneration. Curr. Opin. Genet. Dev. 13, 497-501.
Wagers, A. J. and Weissman, I. L. (2004). Plasticity of adult stem cells. Cell 116,
639-648.
Yan, Y., Miller, C. T., Nissen, R. M., Singer, A., Liu, D., Kirn, A., Draper, B., Willoughby, J., Morcos, P. A., Amsterdam, A. et al. (2002). A zebrafish sox9
gene is required for cartilage morphogenesis. Development 129, 5065-5079.