Universidade de Lisboa
Faculdade de Ciências
Departamento de Biologia Animal
Characterization of Adenosine Receptors
in a Rett Syndrome Model
Cátia Palminha
Mestrado em Biologia Humana e Ambiente
Universidade de Lisboa
Faculdade de Ciências
Departamento de Biologia Animal
Characterization of Adenosine Receptors
in a Rett Syndrome Model
Cátia Palminha
Dissertação orientada por:
Professora Doutora Maria José Diógenes, Instituto de Medicina Molecular, Lisboa Professora Doutora Ana Maria Crespo, Faculdade de Ciências da Universidade de
Lisboa
Mestrado em Biologia Humana e Ambiente
iv
O trabalho experimental descrito nesta tese foi realizado no Instituto de Farmacologia e Neurociências, Faculdade de Medicina de Lisboa e Unidade de Neurociências, Instituto de Medicina Molecular.
vi
INDEX
List of Abbreviations viii
Resumo x
Abstract xi
List of Figures xii
List of Tables xiii
1. Introduction 1
1.1 Rett Syndrome 1
1.1.1 The Origin 1
1.1.2 The MeCP2 gene 2
1.1.3 Consequences of the deregulation of the MeCP2 gene 5
1.1.4 Treatment strategies 8
1.2 Adenosine 9
1.2.1 Adenosine synthesis 10
1.2.2 Adenosine receptors 11
1.2.3 Adenosine mediated actions: pathophysiological implications 14
2. Aim 18
3. Methods 19
3.1 Biological sample preparations 19
3.1.1 Animals 19
3.1.2 Hippocampus isolation and slice preparation 19
3.1.3 Cortical homogenates 20
3.1.4 RNA extraction and cDNA synthesis 20
3.2 Techniques 21
3.2.1 Western blot Analysis 21
3.2.2 Extracellular Electrophysiological Recordings 21
3.2.2.1 Input-output curves 22
3.2.3 Radioligand Binding Experiments 23
3.2.4 Quantative PCR 23
3.3 Pharmacological Tools 24
vii
3.5 Primers 25
3.6 Data Analysis 25
4 Results 26
4.1 Extracellular levels of Adenosine might be impaired in MeCP2 KO animals 26 4.2 Levels of A2AR are increased in MeCP2 KO animals 29
5 Discussion and Future Perspectives 31
6 Conclusion 34
7 Acknowledgements 35
viii
LIST OT ABBREVIATIONS
A1R – Adenosine A1 receptor
A2AR – Adenosine A2A receptor
AAT – Adenosine augmentation therapies aCSF – Artificial cerebrospinal fluid
AD – Alzheimer’s disease ADA – Adenosine deaminase AED – Antiepileptic drugs AK – Adenosine kinase
AMP – Adenosine monophosphate ALS – Amyotrophic lateral sclerosis ATP – Adenosine triphosphate
BDNF – Brain-derived neurotrophic factor BSA – Bovine serum albumin
CA 1-3 – Cornu Ammonis, areas 1-4 cAMP – Cyclic adenosine monophosphate CDKL5 – Cyclin-dependent kinase-like 5 cDNA – Cyclic Deoxyribonucleic acid CNS – Central nervous system CPA – N6-Cyclopentyladenosine
CypA – PPIA peptidylprolyl isomerase A (cyclophilin A) dATP – Deoxyadenosine triphosphate
dCTP – Deoxycytidine triphosphate dGTP – Deoxyguanosine triphosphate DNA – Deoxyribonucleic acid
DPCPX – 1,3-Dipropyl-8- cyclopentylxanthine DTT – Dithiothreitol
dTTP – Deoxythymidine triphosphate
fEPSP – Field excitatory post-synaptic potentials FoxG1 – Forkhead box protein G1
ix
HDAC 1-2 – Histone deacetylases 1-2 I/O – Input/Output
iPS – Induced pluripotent stem cells KO – Knock out
LTP – Long-term Potentiation
MAP kinase – Mitogen-Activated Protein kinase MDB – Methyl-CpG-binding domain
MeCP2 – Methyl-CpG binding Protein 2
NMDA – N-methyl-D-aspartic acid
qPCR – Quantative Polymerase chain reaction RNA – Ribonucleic acid
Rpl13A – Ribosomal protein L13A RTT – Rett syndrome
SAH – S adenosylhomocysteine
SDS - PAGE – Sodium dodecyl sulphate-polyacrylamide-gel electrophoresis TRD – Transcriptional repression domain
TrkB – Tropomyosin related kinase B UTR – Untranslated region
WT – Wild type
x
RESUMO
A síndroma de Rett (RTT) é uma doença de causa genética que origina disfunção cognitiva severa, epilepsia, atraso no desenvolvimento, perda da funcionalidade das mãos, desenvolvimento de movimentos estereotipados das mãos e dificuldades de interacção social. A RTT é causada, principalmente, por mutações no gene MeCP2 presente no cromossoma X. Em RTT, a sinalização do factor neurotrófico derivado do cérebro (BDNF) está comprometida. O BDNF regula a sobrevivência neuronal, diferenciação e plasticidade sináptica como a Potenciação a Longo Prazo, aceita como a base neurofisiológica de aprendizagem e memória. O aumento da sinalização de BDNF seria um avanço importante, mas tem sido dificultado devido à dificuldade de administrar BDNF no Sistema Nervoso Central. Por outro lado, Adenosina é um neuromodelador que actua principalmente via receptor A1 e A2A
através de acções inibitórias e excitatórias, respectivamente, que tem sido apontado como agente antiepiléptico devido ao seu papel neuroprotector. A activação do receptor A2A potencia as acções sinápticas do BDNF em animais saudáveis. Deste
modo, a exploração quer da facilitação das acções do BDNF resultantes da activação de receptores A2A quer dos efeitos inibitórios benéficos provocados por agonistas dos
receptores A1 vistos em modelos de epilepsia, seria uma abordagem terapêutica
interessante em RTT. Animais MeCP2 Knockout (KO) (B6.129P2 (C) -Mecp2tm1.1Bird/J) foram usados para a caracterização dos receptores A1 e A2A quer funcional quer
molecularmente. Verificámos que o sistema adenosinérgico está comprometido no modelo RTT com a possível redução dos níveis de adenosina e consequente diminuição do tónus adenosinérgico inibitório via A1R que, deste modo, contribui para a
susceptibilidade epiléptica em RTT. Os nossos resultados favorecem a um aumento de expressão dos receptores A2A e embora a quantificação proteica não revelar a mesma
tendência. Em conclusão, aumentando a actividade mediada pelo receptor A1 seria
possível prevenir a excitabilidade patológica e susceptibilidade epiléptica. Por outro lado, a activação dos receptores A2A poderia evitar disrupção das acções do BDNF e
exercer potencial papel benéfico na cognição.
xi
ABSTRACT
Rett syndrome (RTT) is the main cause of intellectual disability in females, causing severe cognitive dysfunction, epilepsy, stereotypical movement of the hands, and it is triggered mainly by mutations in the X-linked MeCP2 gene. In RTT, brain-derived neurotrophic factor (BDNF) signaling is impaired. BDNF regulates neuronal survival, differentiation and synaptic plasticity such as long-term potentiation (LTP), accepted as the neurophysiological basis for learning and memory. The increase of BDNF signaling would be a significant breakthrough, but has been hampered by the difficulty to administer BDNF to the central nervous system. On the other hand, Adenosine is a neuromodulator that acts mainly through A1 and A2A receptors through
inhibitory and excitatory actions, respectively, and has been pointed as antiepileptic due to its neuroprotective role. The activation of A2AR potentiates BDNF synaptic
actions in healthy animals. Therefore, the exploration of whether the activation of A2AR facilitates BDNF action simultaneously with the inhibitory benefits of agonists of
A1R seen in epilepsy models could be an interesting therapeutic approach in RTT.
MeCP2 Knockout (KO) (B6.129P2 (C)-Mecp2tm1.1Bird/J) animals were used for
molecular and functional characterization of A1 and A2A receptors. We found that
adenosinergic system is compromised in the RTT model with a possible reduction on adenosine levels and a consequent decrease of inhibitory adenosinergic tonus via A1R
contributing for the epileptic susceptibility in RTT. Our results favor an increase in A2AR
mRNA expression. In conclusion, the increase in A1R activity would prevent
pathological excitability and epilepsy susceptibility. On the other hand, activation of A2AR, could bypass the impairment of BDNF actions and exert potential benefic effects
on cognition.
xii
LIST OT FIGURES
Figure 1 The structure of MeCP2 2
Figure 2 MeCP2 function as a transcriptional repressor 3
Figure 3 MeCP2 dosage balance 7
Figure 4 Adenosine chemical structure 10
Figure 5 Pathways of adenosine production, metabolism and transport 11
Figure 6 Distribution of high affinity adenosine receptors (A1, A2A and human A3) 13
Figure 7 Adenosine receptors, their coupling to G-proteins and some of the down-stream consequences of receptor activation 13
Figure 8 Possible therapeutic strategies using adenosine receptors 17
Figure 9 Summary of adenosine augmentation therapies studies 17
Figure 10 Hippocampal slices preparation 19
Figure 11 Setup for extracellular microelectrophysiology recordings 22
Figure 12 Extracellular recordings in hippocampal slices 22
Figure 13 Changes in fEPSP induced by DPCPX 26-27 Figure 14 Changes in fEPSP induced by CPA 27-28 Figure 15 A1R levels and expression 29
Figure 16 A2AR levels and expression 29
Figure 17 I/O curve 30
xiii
LIST OF TABLES
Table 1 Drugs and respective designation and function used in Electrophysiology and Binding
experiments 24
Table 2 - Primary and secondary antibodies and related conditions used in the Western blot
experiments for individual proteins 25
1
1. INTRODUCTION
1.1 Rett Syndrome
Rett Syndrome (RTT) is a rare neurodevelopmental disorder that occurs mainly in females and it is characterized by normal development up to the first year and a half of age, at which the main symptoms start to appear (Na and Monteggia, 2011). The manifestations of the disease are usually apraxia (the inability to execute learned purposeful movements), deceleration of head growth, compulsive hand movements, mental retardation. Rett patients can also display epilepsy, sleep disturbance, scoliosis, and an abnormal cardiac cycle that can result in sudden death (Zoghbi and Bear, 2012)
Rett syndrome is considered today to be the leading cause of severe intellectual disability in females, with a prevalence estimated of 1 in 10.000 females being clinically diagnosed (Na and Monteggia, 2011).
Patients can live into their sixth and seventh decades without evidence of further progression of disease, although some can develop parkinsonic features (Chahrour and Zoghbi (2007).
1.1.1 The Origin
The disorder was first described by the Austrian pediatrician Andreas Rett in 1966. Even though the description of the disease was done in the 60’s, it was only in 1999 that a major medical breakthrough was achieved when Amir Ruthie discovered that mutations on the MeCP2 gene (Methyl-CpG binding Protein 2) were the primary cause for Rett Syndrome (Amir et al., 1999). This discovery helped to understand why RTT is prevalent in females, since the MeCP2 gene is located on the X chromosome, and why females who are heterozygous for the mutated MeCP2 allele, are able to survive with this debilitating disorder (Na and Monteggia, 2011). Furthermore, it can clarify the fact that males that are hemizygous for MeCP2 mutations have a drastically shortened lifespan of approximately 2 years and typically develop congenital encephalopathy (Ravn et al., 2003; Villard et al., 2000).
It is known that 99% of RTT occurrences are sporadic, caused either by missense, nonsense, insertions, deletions or splice site variations mutations all
2
throughout the gene (Na and Monteggia, 2011), even though there are some familial cases reported in which the disease was inherited through maternal lines (Van den Veyver and Zoghbi, 2001). While looking at the genotype-phenotype correlation, some groups report more severe phenotypes with truncating mutations compared to missense mutations, while others found the exact opposite, but overall, most studies did not detect an unequivocal genotype–phenotype correlation (Van den Veyver and Zoghbi, 2001).In spite of about 80% of the RTT cases being caused by mutations in the MeCP2 gene located on Xq28, there were some RTT patients that had no mutations on this gene. Thus, it was proposed that at least one other locus would be responsible for RTT. Indeed, two groups of authors described cases of RTT-like phenotypes caused by truncating frameshift and missense mutations in the gene for cyclin-dependent kinase-like 5 (CDKL5) (Matijevic et al., 2009). Even more, it was discovered that the FoxG1 gene, forkhead box protein G1 gene, is responsible for the congenital variant of Rett Syndrome (Ariani et al., 2008)
1.1.2 The MeCP2 gene
Identification of the gene responsible for RTT was an essential precondition for understanding the mechanism involved in the development, genetic diagnosis, genetic counseling and, ultimately, for therapy of this debilitating disorder (Nan and Bird, 2001).
The MeCP2 gene has 4 exons and its protein is an abundant, ubiquitously expressed nuclear protein composed by 486 amino acids, most frequently encoded by a second, third and fourth exons (Figure 1)(Matijevic et al., 2009). The gene is highly conserved between species, not only in its coding region, but also in the 3’ and 5’ untranslated regions (UTR) (Van den Veyver and Zoghbi 2001).
3
The MeCP2 protein contains four functional domains: (1) a methyl-CpG-binding domain (MBD, 85 amino acids) which binds to 5-methyl cytosine with a high affinity; (2) a transcriptional repression domain (TRD, 104 amino acids) which interacts with histone deacetylase and transcriptional corepressor SIN 3A; (3) the nuclear localization signal which may be responsible for the transport of MeCP2 into the nucleus, and (4) the C-terminal segment which facilitates its binding to the nucleosome core (Matijevic et al., 2009).Epigenetic mechanisms, such as DNA methylation and histone tail modifications (e.g., acetylation at lysine residues, methylation at lysine or arginine residues, and phosphorylation at serine or threonine residues), can either activate or repress gene transcription (Na and Monteggia, 2011). MeCP2 was first identified as a transcriptional repressor that inhibits gene expression through the interpretation of two epigenetic markers: DNA methylation and histone acetylation (Na and Monteggia, 2011).
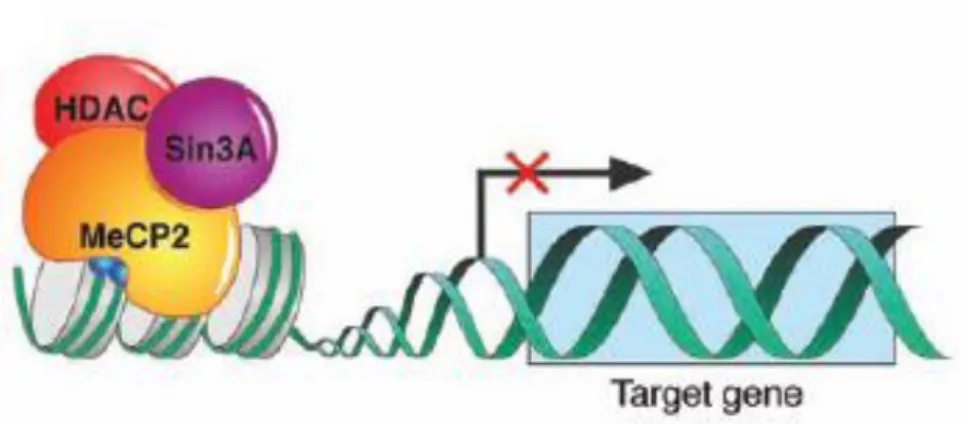
When MeCP2 binds to the methylated CpG islands it recruits a complex containing histone deacetylases (HDAC1 and HDAC2) and the co-repressor Sin3A (Van den Veyver and Zoghbi, 2001). The tails of core histones in the nucleosomes are deacetylated by HDACs, which leads to compaction of heterochromatin, making it inaccessible to the transcriptional activators and components of the transcriptional machinery, resulting in stable repression of downstream genes (Figure 2) (Van den Veyver and Zoghbi, 2001).
Figure 2 – MeCP2 function as a transcriptional repressor. (Adapted from (Chahrour et al., 2008))
As oppose to what has been believed, new evidence has proposed that MeCP2 may also bind to active genes and work as a transcriptional activator (Chahrour et al.,
4
2008; Skene et al., 2010; Yasui et al., 2007) . Even more, MeCP2 has also been shown to interact with RNA to influence alternative splicing (Young et al., 2005).Although the gene is ubiquitously expressed, its expression is high in brain and occurs with a temporal and spatial pattern that correlates with neuronal maturation (Mari et al., 2005). In addition, it was thought that in the brain MeCP2 is expressed only in neurons and not in non neuronal cells. However, MeCP2 is also expressed in non neuronal cells, presumably astrocytes, and not only in the nucleus but also in the cytosol(Matijevic et al., 2009).
It is known that MeCP2 can silence certain genes, however, the MeCP2 target genes associated with RTT pathogenesis could not be found (Matijevic et al., 2009). Two groups of authors have discovered that MeCP2 regulates the expression of the gene encoding brain-derived neurotrophic factor (BDNF) which is essential for neural plasticity, learning and memory. This discovery revealed the role of MeCP2 in the control of neuronal activity-dependent gene regulation and suggested that the pathology of RTT may result from deregulation of this process (Matijevic et al., 2009). BDNF is one of the most studied neurotrophins, and being part of the growth factors family it is involved in several functions on the nervous system. Neurotrophins, such as BDNF, have a prominent role on the nervous system according as various functions that include regulation of axonal growth, modulation of synaptic activity, promotion of survival and regulation of neuronal death (Arevalo and Wu, 2006). These actions of BDNF are possible through the activation of a specific membrane receptor TrkB, Tropomyosin related kinase B, to which BDNF binds with high affinity, inducing receptor dimerization and autophosphorylation in tyrosine residues in the cytoplasmic domain.Alterations on the signaling mediated by neurotrophins are very often present in pathologies such as Parkinson’s and Alzheimer’s (Roux and Barker, 2002) and on
5
1.1.3 Consequences of the deregulation of MeCP2 gene
After discovering that mutations on the MeCP2 gene caused RTT, many studies started to arise trying to discover which alterations would happen, that ultimately led to the disease.
RTT has been previously proposed as a disorder of synaptic formation since the
MeCP2 dysfunction leads to abnormal brain development through maladjustment of
neuronal gene expression to synaptic and other extra-cellular signals, mainly during the critical period of synaptic maturation (Kaufmann et al., 2005).
Initial abnormal synaptic maturation leads to abnormal synaptic structure that, in turn, further intensifies the maturational disruption. The combination of anomalously configured synaptic circuits and continuous molecular deficiency ultimately determines the severity of the neurobehavioral phenotype beyond late childhood. Although these general principles appear to operate in several disorders, the challenge is to identify the features unique to each condition. For instance, in RTT, the neurotransmitter systems abnormalities secondary to early MeCP2 dysfunction, seems to play an important role in ‘setting the stage’ for a highly disrupted process of synaptic maturation. Significant variability in regional MeCP2 expression and increasing levels of this protein into adulthood are other examples of features to be considered, if neurobiologically-based interventions for RTT are to be developed (Kaufmann et al., 2005).
One of the outcomes of the deregulation of the MeCP2 gene that has been found, is that not only results in classic forms of RTT, but can also lead to a range of related neuropsychiatric disorders. For example, patients diagnosed with Angelman syndrome (Watson et al., 2001), non-syndromic mental retardation (Miltenberger-Miltenyi and Laccone, 2003), Prader–Willi syndrome (Samaco et al., 2004), and some forms of autism (Shibayama et al., 2004) have mutations in the MeCP2 gene that significantly reduce MeCP2 protein expression levels. These findings designate that the effects of MeCP2 mutations are not necessarily consistent, and that understanding the developmental trajectory of MeCP2 expression, and the coupling of developmental
stage-specific expression with neuronal function, may provide important insight into the etiology of RTT and other MeCP2-associated disorders (Na and Monteggia, 2011).
6
Utilizing rodent models of RTT has substantially enhanced the general understanding of how MeCP2 mutations can lead to the observed phenotypes (Na and Monteggia, 2011). For instance, when using a mice model that has a constitutive deletion of MeCP2, they first displayed severe neurological symptoms that included uncoordinated gait, hindlimb clasping and irregular breathing, followed by a period of normal development (Guy et al., 2001). It is fairly common to see on those mice reduced brain size and smaller, more densely packed neurons in the hippocampus, cortex and cerebellum (Chen et al., 2001).Behavioral characterization of these conditional MeCP2 knockouts revealed phenotypes that are strikingly similar to RTT patients, with significant defects in motor learning, as well as increases in anxiety-like behavior, impairments in social interaction and altered learning and memory-related behaviors (Gemelli et al., 2006).
On the other hand, transgenic mice models that overexpress MeCP2 mimic many of the same behavioral phenotypes seen in RTT patients and in MeCP2 KO mice (Na and Monteggia, 2011). It has been shown that mice with elevated levels of MeCP2 develop seizures and become hypoactive (Jiang et al., 2013). Mice that overexpress
MeCP2 specifically in postmitotic neurons also display significant impairments in motor
learning, as well as tremors and gait ataxia (Luikenhuis et al., 2004). These mice models clearly indicate that homeostatic regulation of MeCP2 is necessary for normal CNS functioning. Both the loss and overexpression of MeCP2 result in similar neurological deficits as those seen in patients with RTT, revealing a need for precise control over the amount of MeCP2 expression (Na and Monteggia, 2011). For example, MeCP2 expression being abruptly restored in the brains of MeCP2 null mice before the onset of symptoms resulted in half of the animals experiencing neurological defects and subsequent death, and half avoiding development of any detectable symptoms (Guy et al., 2007), while gradual restoration of MeCP2 levels in MeCP2-deficient mice increased lifespan and reversed deficits in motor coordination and respiratory function in all animals. Recent advances might explain the previously reported phenotypic diversity (from mild to severe) (Mari et al., 2005). Recently, duplications of the Xq28 region encompassing the MeCP2 gene were shown to segregate with mental retardation and progressive neurological symptoms in males (Van Esch et al., 2005). On the basis of these findings, it is possible to propose a model in which different
7
balancing of MeCP2 expression might be the cause of phenotypic diversity (Figure 3) (Mari et al., 2005). A gene-dosage-sensitive mechanism was confirmed in MeCP2 transgenic mice, which develop a neurological phenotype of varying severity depending on the MeCP2 gene copy number (Collins et al., 2004). These results provide firm evidence that the central nervous system is extremely sensitive to MeCP2 expression levels and that tight regulation of MeCP2 expression is crucial in pre- and postnatal brain development and function (Mari et al., 2005). Although these preliminary results are encouraging and could lead to therapeutic options for this debilitating disorder, the importance of tight regulation of MeCP2 expression levels needs to be considered carefully in designing treatment strategies based on gene correction of RTT (Mari et al., 2005).Figure 3 – MeCP2 dosage balance. (Adapted from (Mari et al., 2005))
As previously mentioned, patients with Rett syndrome display a normal period of development prior to symptom onset, and then undergo a period of regression, suggesting that MeCP2 may play a more functional role in early postnatal development rather than during embryonic periods (Na and Monteggia, 2011).
The study of the timing of MeCP2 expression in both humans and rodents has been very important in adding insight to this disorder. It is known that in the rodent CNS, the MeCP2 expression is first detected in the spinal cord and brainstem around day E12 (Jung et al., 2003; Shahbazian et al., 2002). Other brain areas such as thalamus, caudate putamen, cerebellum, hypothalamus, hippocampus and cortex are targets of MeCP2 expression at days E14-18 (Na and Monteggia, 2011). Over the course of cellular differentiation, amounts of MeCP2 protein increase such that, from early postnatal development into adulthood, MeCP2 is highly expressed in neurons throughout the brain (Shahbazian et al., 2002). In humans, neuronal maturation and synaptogenesis are key developmental processes that occur as early as embryonic weeks 12 and 20, respectively (Marsh et al., 2008). The loss of MeCP2 expression within this time window may be responsible for the observed decrease in neuronal and overall brain size in RTT patients. Disruptions in MeCP2 function might therefore
8
interfere with neuronal maturation and synaptogenesis, culminating in abnormal development of the CNS.The reduction in neuron size seen in MeCP2 null mice and RTT patients is only one of the observed effects resulting from the loss of MeCP2 function during CNS development (Na and Monteggia, 2011). It is very characteristic to find reductions in axonal and dendritic processes as well as decreased spine density in RTT patients (Armstrong, 2002). In female RTT patients, CA1 pyramidal neurons exhibit decreased dendritic spine density (Chapleau et al., 2009), and substantial decreases in dendritic arborization can be seen in the frontal, limbic, and motor cortices (Armstrong et al., 1998). MeCP2-deficient neurons also have fewer dendritic spines and reduced arborization in the hippocampus and exhibit additional impairments in neuronal maturation in both the hippocampus and in the olfactory system (Palmer et al., 2008; Smrt et al., 2007; Zhou et al., 2006). The impacts on dendritic morphology seen with mutations in MeCP2 likely contribute to the cognitive impairments observed in RTT patients (Na and Monteggia, 2011). Thus, an obvious consequence of reduced dendritic complexity is an effect on synaptogenesis. The control of MeCP2 expression in hippocampal neurons leads to alterations in dendritic spines, the locations of excitatory synapses along dendrites (Chapleau et al., 2009).
The learning deficits and reductions in dendritic arborization observed in mouse models of Rett syndrome suggest that MeCP2 plays a vital role in synapse function (Na and Monteggia, 2011). The changes found in neurotransmission suggest an overall shift in the ratio of excitation to inhibition. The direct functional consequences of this imbalance have not been identified as of yet. However, it is reasonable to hypothesize that changes in excitatory neurotransmission may reflect changes in action potential firing thresholds, ultimately resulting in significant changes in network activity (Na and Monteggia, 2011).
1.1.4 Treatment strategies
Although there is no current treatment for this disorder per se, but instead for the control of the major symptoms such as epilepsy, the finding that MeCP2 regulates a large number of genes suggests a need for therapeutic strategies that focus on restoring neuronal function rather than restoring the activity of individual gene
9
products affected by MeCP2 dysfunction (Chahrour et al., 2008). It might prove challenging to restore the level of each of these genes at the same time. Thus, an alternative approach will be to identify proteins or pathways that suppress MeCP2 dysfunction phenotypes, or bypass MeCP2, and restore neuronal homeostasis (Chahrour et al., 2008).Grounded on the knowledge that MeCP2 could affect BDNF gene expression (Chen et al., 2003) and that BDNF levels are diminished in RTT (Chang et al., 2006), new strategic approaches were designed in order to increase BDNF levels and consequently its actions. However, the administration of drugs destined to exert its effects on the brain must have the capacity to cross the blood-brain barrier. Pharmacokinetic properties of BDNF unable its ability to reach the brain after a peripheral administration (Pardridge et al., 1994). Therefore, new concepts started to be considered involving the use of small molecules, which by penetrating the blood brain barrier might stimulate the synthesis and/or potentiate the effects of endogenous neurotrophins. One of those molecules is adenosine. Adenosine through the activation of a particular type of adenosine receptors, the A2A receptor (A2AR), can induce
phosphorylation and consequent activation of TrkB receptors even in the absence of BDNF (Lee and Chao, 2001). Moreover, it is known that the activation of A2AR is a
prerequisite essential to the facilitatory effects of BDNF upon synaptic transmission (Diogenes et al., 2004; Tebano et al., 2008), and plasticity (Fontinha et al., 2008).
1.2 Adenosine
Adenosine (Figure 4) is one of the most studied molecules. It is a purine ribonucleoside, which means it is formed when a purine (adenine) is covalently bound to a ribose (ribofuranose).
Given the fact that adenosine is “omnipresent”, i.e., exists in every cell and it is released by all cells, including neurons and glial cells (Ribeiro et al., 2002), this substance plays an important role to maintain energy homeostasis in most organ systems including the brain (Newby et al., 1985).
Among main bodily functions are regulation of seizure susceptibility – endogenous anticonvulsant actions (Boison, 2005), neuroprotection (Rebola et al.,
10
2005), regulation of pain perception (Sadigh-Lindell et al., 2003), sleep induction (Porkka-Heiskanen et al., 2003), central respiratory control (Gourine, 2005), cardioprotection (Minamino and Kitakaze, 2002) and the regulation of heart rate, blood pressure (Blood et al., 2002), and body temperature (Gourine et al., 2002).Figure 4 – Adenosine chemical structure – Adenine (in the red square) and ribofuranose (in the blue square) bound by a C1’-N9 glycosideic bond. (Adapted from Diogenes, M.J. PhD Thesis)
1.2.1 Adenosine synthesis
Intracellularly, adenosine can be formed by the action of the enzyme endo-5’-nucleotidase on adenosine monophosphate (AMP) (Phillips and Newsholme, 1979) and by the hydrolysis of S adenosylhomocysteine (SAH) (Nagata et al., 1984) catalyzed by SAH hydrolase. The levels of endogenous adenosine are controlled by adenosine kinase (AK), which phosphorylates adenosine to produce AMP, and by adenosine deaminase (ADA), which catalyzes the formation of inosine (Figure 5). Extracellularly, adenosine can be formed by the action of the enzyme ecto-5’-nucleotidase on AMP resultant from cyclic AMP.
Since adenosine is considered a neuromodulator instead of neurotransmitter due to not accumulating and releasing by synaptic vesicles, this molecule is released from the cytoplasm into extracellular space through nucleoside transporters (Ribeiro et al., 2002) as oppose as classical neurotransmitters.
It is known that intracellular concentration of adenosine in basal conditions is about 100 nM (Meghji et al., 1992), and the extracellular concentration under the same circumstance can vary from 30 to 300 nM (Schulte and Fredholm, 2003).
11
Figure 5 – Pathways of adenosine production, metabolism and transport – Abbreviations are as follows:
ADA – adenosine deaminase; AK – adenosine kinase; es – equilibrative-sensitive nucleoside transporters; ei –
equilibrative-insensitive nucleoside transporters; SAH – S-adenosyl homocysteine. (Adapted from (Latini and Pedata, 2001)).
1.2.2 Adenosine receptors
Adenosine and its receptors are a subject that have been largely studied over the years, and currently, it is well accepted that there four different receptors to which adenosine can bind: A1, A2A, A2B and A3.
These receptors are classified as seven transmembrane domain G-protein-coupled receptors and the original classification was based on the effect on adenosine binding to the receptor affecting the cyclic AMP (cAMP) levels in different tissues (Londos et al., 1980; van Calker et al., 1979).
The adenosine A1 receptor (A1R) are highly expressed in brain cortex,
12
al., 2001) and can be present in pre-, post- and non-synaptic sites. Since A1R arecoupled to the Gi family of G-proteins, they have the capacity to stimulate K+ channels,
causing membrane hyperpolarization post-synaptically, and to reduce transient voltage dependent Ca2+ channels and inhibit cAMP formation (Figure 7) (Boison, 2010). When they are located pre-synaptically, they inhibit neurotransmitter release due to the binding of the Go domain (Dunwiddie and Haas, 1985).
The A2AR are highly expressed post-synaptically in the striatum-pallidal
GABAergic neurons and olfactory bulb (Fredholm et al., 2001); they are also expressed in hippocampus and cortex (Figure 6) (Ribeiro et al., 2002) where they have a predominant pre-synaptic localization (Rebola et al., 2005). The majority of A2AR are
coupled to stimulatory G-proteins (Gs), which consequently increase intracellular cAMP
(Figure 7) and promote the release of cytokines, which may serve as part of an important feed-forward mechanism to locally control neuroinflammatory responses in the brain (Boison, 2010). The A2AR can also be found coupled to the Golf domain in the
striatum (Corvol et al., 2001) which is associated with increased nerve activity and LTP (Long-Term Potentiation - a form of synaptic plasticity which is considered the neurophysiological basis for learning and memory) (Figure 7).
The A2B receptor is known to display low levels of expression in the brain (Dixon
et al., 1996), although their expression is noted in astrocytes (van Calker et al., 1979). A2B receptors can couple to two different classes of G-proteins: Gq and Gs – the Gq
regulates intracellular calcium and vesicular release, whereas Gs affects a variety of
cAMP dependent signaling pathways (Figure 7)(Boison, 2010).
The A3 receptor has apparent intermediate levels of expression in the human
cerebellum and hippocampus (Figure 6) and low levels in the rest of the brain (Fredholm et al., 2001). The affinity of this receptor for adenosine (Ki=6500 nM) is
considerably lower than the adenosine affinity of A1 (Ki=70 nM) and A2A (Ki=150 nM) or
even A2B (Ki=5100) receptors (Pagonopoulou et al., 2006). This receptor is usually
coupled to inhibitory G-proteins such as Gi (Linden, 2001) which can promote MAP
kinase (Mitogen-Activated Protein kinase) activation, a pathway associated with cell growth and survival (Figure 7) (Boison, 2010).
13
Figure 6 –Distribution of high affinity adenosine receptors (A1, A2A and human A3). High levels are
indicated by larger font. (From (Ribeiro et al., 2002)).
Figure 7 – Adenosine receptors, their coupling to G-proteins and some of the down-stream
14
1.2.3 Adenosine mediated actions: pathophysiological implications
As previously mentioned, adenosine through the activations of its receptors has the capacity to modulate the release of several neurotransmitters and other neuromodulators. Moreover, adenosine has the ability to regulate the function of other receptors that affect several biological functions such as neuropeptide receptors, nicotinic autofacilitatory receptors, metabotropic glutamate receptors, NMDA receptors and neurotrophic receptors (see for review (Ribeiro and Sebastiao, 2010)).
The neuromodulation system of adenosine as been considered as a putative therapeutic target to manage brain disorders. This interest has been growing due to the recurrent observations showing that the extracellular levels of adenosine are modified upon brain damage (Gomes et al., 2011). This is likely a result from the increased use o ATP to attempt preserving cell viability, which ultimately leads to disproportionally higher formation of adenosine (Gomes et al., 2011). It is clear that the elucidation of the metabolic and cellular sources of extracellular adenosine is still not understood. Provided that adenosine is apparently involved in many functions that can play a role in the pathology of the nervous system, the modifications of extracellular levels of this molecule or the pharmacological or molecular manipulation of adenosine receptors may interfere with the action of other important molecules that regulate brain functions. And therefore, this could be relevant for future treatment of several diseases, through the activation or inhibition of adenosine receptors which may modulate certain pathways that could change the fate of these diseases.
The pharmacological manipulation of adenosine has for some years been suggested for the treatment of various health conditions (Ribeiro et al., 2002).
One field of interest, where adenosine’s manipulation has been studied, is the regulation of sleep. It has been shown (Benington et al., 1995; Porkka-Heiskanen et al., 1997) that adenosine functions as a natural sleep-promoting agent mostly through activation of A1 receptors (Figure 8). It was suggested that adenosine participates in
resetting of the circadian clock by manipulation of behavioral states (Antle et al., 2001). Thus, it emerges that there exists a potential role for adenosine-related compounds and of A1 receptor agonists as sleep promoters and adenosine receptor
15
Regarding health conditions such as anxiety, it was demonstrated the utility of A1R agonists as anxiolytic compounds, suggesting that drugs that facilitate adenosineA1 receptor-mediated actions may be effective for the treatment of anxiety (Florio et
al., 1998; Jain et al., 1995)(Figure 8).
In spite of the treatments available nowadays in form of antiepileptic drugs (AEDs), seizures persist in approximately 35% of patients; hence a strategy that prevents seizures in drug-resistant epilepsy would be an important therapeutic advance. In studies using a mouse model for drug-resistant mesial temporal lobe epilepsy, in which recurrent spontaneous seizure activity was induced by a single intrahippocampal injection of kainic acid, the administration of an A1Ragonist led to
the suppression of seizure activity (Gouder et al., 2003). Moreover, in vivo and in vitro studies were performed in models of epilepsy to evaluate the antiepileptic effects of AMP, the precursor of adenosine, and this molecule indeed inhibited excitatory neurotransmission by directly activating A1R and prolonged latency of convulsions
(Muzzi et al., 2013) (Figure 8).
A decrease in levels and/or action of neurotrophic factors such as BDNF have been implicated in the pathophysiological mechanisms of many diseases of the nervous system, such as Alzheimer’s disease (AD), Parkinson’s disease, Huntington’s disease, diabetic neuropathies, ALS, depression and even RTT, therefore making the use of the naturally occurring neurotrophic factors promising for treatment of these disorders (Sebastiao and Ribeiro, 2009). However, until now the pharmacological administration of neurotrophic factors in vivo has not been easy as these molecules are unable to cross the blood brain barrier, making invasive application strategies like intracerebroventricular infusion necessary (Sebastiao and Ribeiro, 2009). The evidence that adenosine A2AR trigger or facilitate actions of neurotrophins upon synaptic
strength and neuronal survival opens a new therapeutic strategy, as there are A2AR
agonists that cross the blood brain barrier, which can be explored as tools to potentiate neurotrophic actions in the brain (Sebastiao and Ribeiro, 2009). In summary, the neuromodulator adenosine, through A2AR activation, has profound
influence upon the actions of neurotrophic factors and due to the role of neurotrophic factors upon neuronal survival, neuronal plasticity and neuronal differentiation, the adenosine-induced control of neurotrophic factors opens new windows of
16
adenosinergic influence on neuronal cells and novel therapeutic perspectives in neuronal dysfunction (Sebastiao and Ribeiro, 2009).Although adenosine receptor agonists have been pointed out to be promising in future therapies, these substances may have marked side effects in vivo, including bradycardia and hypotension ((Barraco et al., 1984); see also (Dunwiddie, 1999)). Therefore, it has been frequently suggested the use of other substances that indirectly modulate the levels of endogenous adenosine such as mioflazine which is an adenosine uptake inhibitor that was effective as a sleep enhancer (Hoppenbrouwers and Bussche, 1989). Besides the use of alternative substances to modulate the levels of adenosine, there are other therapies that have been suggested to avoid the systemic side effects of adenosine’s agonists, intervening focally, which are the adenosine augmentation therapies (AAT) (Boison, 2009). There are mainly three types of AAT: the silk-based brain implants, the encapsulated cells and stem cell-derived brain implants. Silk is biocompatible and biodegrades slowly and the delivery of doses of adenosine are predetermined and it was proven its therapeutic efficacy trough antiepileptogenic properties (Boison and Stewart, 2009). On the second approach, a suitable cell line is first genetically engineered to release a therapeutic compound, which in this case is adenosine, and then encapsulated in a semipermeable polymer membrane and transplanted locally into the host’s brain. Cell-encapsulation permits the exchange of oxygen, extracellular metabolites, and nutrients between the encapsulated cells and the host tissue and it shows anticonvulsant properties. Most importantly, the focal use of cell-based adenosine delivery did not cause receptor desensitization, nor was it accompanied by sedative side effects (Boison and Stewart, 2009). The third type of AAT is stem cell-derived brain implants to secrete adenosine. Stem cell-derived brain implants can also be engineered to release therapeutically active molecules with the aim to provide therapeutic benefit by paracrine mechanisms. It is a combination of functional integration and paracrine drug delivery and has shown antiepileptogenic or disease-modifying properties (Boison and Stewart, 2009). Although the effects of AAT have only been tested on epilepsy models (Figure 9), these therapies could be promising in treating other pathologies where the levels of adenosine are pathologically altered.
17
Figure 8 – Possible therapeutic strategies using adenosine receptors. (Adapted from Diogenes, M.J. PhD Thesis)
Figure 9 – Summary of adenosine augmentation therapies studies. (Adapted from (Boison and Stewart, 2009)).
18
2. AIM
RTT is a genetic disorder that originates severe intellectual disabilities besides other symptoms such as epilepsy. RTT is caused primarily by mutations in MeCP2 gene. One of the most prominent genes under the control of MeCP2 is the BDNF gene. Therefore, in this pathology there is an impairment on BDNF signaling. Until now there is no pharmacological treatment available for RTT. The increase of BDNF signaling would be a great breakthrough, but has been hampered by the difficulty to administer BDNF so that it reaches the brain. Therefore, the use of molecules with the ability to potentiate BDNF actions has been pointed out as a promising possibility. The activation of A2AR is known to potentiate BDNF synaptic actions. Onthe other hand, A1R have been suggested to be important in the control of
epilepsy, since they are inhibitory receptors. Therefore, adenosine may influence synaptic dysfunction in RTT through A1R activation, leading to epilepsy control, and
through A2AR activation promoting potentiation of BDNF effects. However
adenosine signalling was never evaluated in RTT either in humans or in animal models. Therefore, this project was designed to characterize adenosine mediated signalling in a well established RTT mice model, the MeCP2 knock out (KO) model.
19
3. METHODS
3.1 Biological sample preparations
3.1.1 Animals:
All experiments were performed with adult (6-10 weeks old) Black six mice, in wild type and in MeCP2 Knock Out type (B6.129P2 (C)-Mecp2tm1.1Bird/J), handled according to the Portuguese law on Animal Care and European Union guidelines (86/609/EEC).
The animals were housed in the local Animal House on a 12hours light/dark cycle and were provided food and water ad libitum. Care was taken so to reduce the number of used animals to the absolutely necessary.
3.1.2 Hippocampus isolation and slice preparation:
The animals were anesthetized with Isoflurane (in 1, 2-Propylenglycol 50% (v/v)) in an anesthesia chamber. After the first signs that indicate the anesthesia state, like the lack of a righting reflex and reduction in respiratory rate, the mice were sacrificed by decapitation. In order to obtain access to the brain, the skull was exposed by cutting the skin at the top of the head and then the brain was removed, and placed into ice-cold artificial cerebrospinal fluid (aCSF) (Krebs’ solution) containing (in mM): 124 NaCl, 3 KCl, 1.25 NaH2PO4, 26 NaHCO3, 1 MgSO4, 2 CaCl2, and 10 glucose, previously gassed with 95% O2 and 5% CO2, pH 7.4, as seen in Figure 10 (A). The brain
was separated into two hemispheres through the midline and the hippocampus was isolated - Figure 10 (B) -always taking caution not to touch the hippocampus with the spatulas. Once the isolated, the hippocampus was is cut perpendicularly to the long axis into slices (400 μm thick) with a McIlwain tissue chopper - Figure 10 (C) - and allowed to recover, for at least one hour, in a resting chamber - Figure 10 (D) - in Krebs’ solution at room temperature.
Figure 10 – Hippocampal slices preparation – (A) Brain removed. (B) Hippocampus isolation. (C) McIlwain tissue chopper. (D) Resting chamber. (Adapted from Pinho, J.S. Master Thesis)
20
3.1.3 Cortical homogenates:
Protein extracts for western blot analysis were prepared from snap-frozen cortex and disrupted with a Teflon pestle in a 50 mM sucrose-Tris pH 7.6 and supplemented with protease inhibitors (Complete; Roche Applied Science, Mannheim, Germany). The protein content in the supernatants was determined using a commercial Bradford assay (Sigma, MO, United States of America).
3.1.4 RNA extraction and cDNA synthesis:
Total RNA was extracted using RNeasy Lipid Tissue Mini Kit (Qiagen) from cortex tissue, according to the manufacturer’s instructions. RNA concentration and purity were evaluated by spectrometry on the basis of optical density (OD) measurements at 260 and 280 nm.
cDNA synthesis was performed in a 20 µl reaction mixture. A 4.3 µg total RNA was mixed with 1 µl random primer hexamer (Amersham)and 1 µl each of dATP, dTTP, dCTP, dGTP (each 10 mM) and incubated for 5 min at 65ºC. After cooling for 2 min at 4ºC, the solution was mixed with 4 µl of 25 mM MgCl2, 2 µl of 10X RT Buffer ,2 µl of
0.1M DTT, 0.5 µl SuperScript II Reverse Transcriptase (200 U; Invitrogen Life Technologies). The reaction was performed for 50 min at 42ºC and terminated by 15 min incubation at 70ºC. Parallel reactions for each RNA sample were run in the absence of SuperScript II to assess the degree of any genomic DNA contamination. Completed RT reactions were stored at −20 ◦C until use.
21
3.2 Techniques
3.2.1 Western Blot Analysis:
Sodium dodecyl sulfate (SDS)-polyacrylamide gel electrophoresis (PAGE) was used to evaluate the levels of A2AR. Total proteins (200 µg) were separated on 10%
SDS-polyacrylamide electrophoresis gels and blotted onto a polyvinylidene fluoride membrane according to the standard procedures. The blots were probed overnight at 4ºC with the monoclonal mouse anti-A2A in 3% BSA (Bovine Serum Albumin). After
washing (3 x 5 min in TBST [10 mM Tris, 150 mM NaCl, 0,05% Tween 20 in H2O]), blots
were then incubated with secondary antibodies conjugated with horseradish peroxidase and bands were visualized with a commercial enhanced chemiluminescence detection method (ECL) kit (PerkinElmer Life Sciences, MA, United States of America). Values were normalized to the α-Tubulin (loading control) and the relative intensities were normalized to WT (set as 1). Densitometry of the bands was performed using the Image J processing software (NIH, MD, United States of America).
3.2.2 Extracellular Electrophysiological Recordings:
Posteriorly of functional and energetic recovery, slices were transferred to a recording chamber for submerged slices, and continuously superfused at 3ml/min with bathing solution gassed with 5% CO2 and 95% O2 at 32ºC (Figure 11). The drugs were
added to this superfusion solution for experiments.
Recordings were obtained with an Axoclamp 2B amplifier and digitized (Axon Instruments, Foster City, CA). Individual responses were monitored, and averages of eight consecutive responses were continuously stored on a personal computer with the LTP program (Anderson and Collingridge, 2001).
22
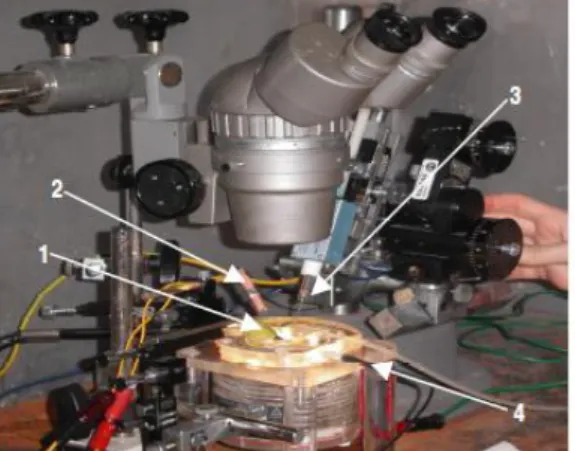
Figure 11 – Setup for extracellular microelectrophysiology recordings. 1- Reference electrode.
2- Stimulation electrode. 3- Recording electrode. 4- Temperature sensor. (Adapted from Diogenes, M.J.
PhD Thesis).
Field excitatory post-synaptic potentials (fEPSPs) were recorded (Figure 12 -B) through an extracellular microelectrode (4 M NaCl, 2–6 MW resistance) placed in the
stratum radiatum of the CA1 area (Figure 12 - A). Stimulation (rectangular 0.1 ms
pulses, once every 15 seconds) was delivered through a concentric electrode placed on the Schaffer collateral-commissural fibers, in the stratum radiatum near the CA3–CA1 border. The intensity of stimulus (80–200 μA) was initially adjusted to obtain a large fEPSP slope with a minimum population spike contamination. Alteration on synaptic transmission was evaluated as the % change in the average slope of the fEPSP in relation to the average slope of the fEPSP measured during the 10 minutes that preceded the addition of drugs as previously described (Diogenes et al., 2004).
Figure 12 – Extracellular recordings in hippocampal slices – (A) Representation of the stimulation of one pathway in a hippocampal slice to record field excitatory postsynaptic potentials (fEPSPs). (B) Traces obtained after stimulation composed of stimulus artifact (1), followed by the presynaptic volley (2) and the fEPSP (3). (Adapted from Diogenes, M.J. PhD Thesis).
3.2.2.1 Input-output curves:
Input-output curves were performed to evaluate the basal synaptic transmission. After obtaining a stable baseline for at least 10 min, the stimulus delivered to the slice was decreased until no fEPSPs was elicited. The stimulus was
23
then successively increased by 20 μA steps. For each stimulation, data from three consecutive averaged fEPSP (each average fEPSP is the computerized mean of six individual fEPSP) were stored. The range of stimulation was from 60 μA until 340 μA. The input-output curve was plotted as the relationship of the fEPSP slope vs stimulus intensity, which provides a measure of synaptic efficiency.3.2.3 Radioligand Binding Experiments:
[3H]DPCPX binding studies were performed in cortical brain homogenates (40-80 µg protein per assay) obtained from each different mouse group, [3H]DPCPX binding was carried out in an incubation solution containing 50 mM Tris-HCl buffer and 10 mM MgCl2 (pH 7.4) and 4 U/ml ADA for 120 min at room temperature, in a final volume of 200 µl. Specific binding was calculated by subtraction of the nonspecific binding, defined in the presence of 2 µM XAC. The reaction was stopped by addition of cold incubation buffer and vacuum filtration through glass fiber filters (FilterMAT for receptor binding, Skatron Instruments, Lier, Norway) using a semiautomatic cell harvester from Skatron Instruments. The samples were transferred to scintillation vials and radioactivity was measured by a liquid scintillation analyzer (Tri Carb 2900TR, Perkin-Elmer, IL). Membrane protein content was quantified with the Bio-Rad protein assay according to Bradford (Bradford, 1976).
3.2.4 Quantative PCR:
qPCR for mRNA was done using Power SYBR® Green PCR Master Mix (Life Technologies),the pre amplified cDNA was used as the template for the real-time PCR run Rotor Gene 6000 (Corbett Life Science), according to the manufacturer´s recommendations. Negative Control PCR samples were run with no template. Fold-changes were calculated using Cq method and normalized to the expression PPIA peptidylprolyl isomerase A (cyclophilin A) and Ribosomal protein L13A with Rotor-Gene Series Software 1.7 (Corbett Life Science). Data normalized according to the following formula: Cq = Cq (target gene) – Cq (reference gene).
24
3.3 Pharmacological tools:
Table 1 – Drugs and respective designation and function used in Electrophysiology and Binding experiments
Abbreviation Designation Function Supplier
ADA Adenosine deaminase (EC 3.5.4.4) Adenosine deamination promoting enzyme Roche Diagnostics Corporation (Germany) CPA N6-Cyclopentyladenosine Adenosine A1
receptor agonist Tocris (Bristol, UK) [3H]DPCPX 1,3-[3 H]-dipropyl-8-cyclopentylxanthine Tritiated adenosine A1 receptor antagonist American Radiolabeled Chemicals, Inc. (ST Luis, USA) DPCPX 1,3-Dipropyl-8- cyclopentylxanthine Adenosine A1 receptor
antagonist Tocris (Bistol, UK)
XAC 8-{4-[(2- aminoethyl)amino]- Carbonylmethyloxy phenyl}xanthine Adenosine receptor antagonist
RBI (Natick, MA, USA)
25
3.4 Antibodies:
Table 2 - Primary and secondary antibodies and related conditions used in the Western blot experiments for individual proteins Protein Protein loading (µg) Resolving gel % Primary antibody Dilution Secondary Antibody Dilution A2AR 200 10 Upstate (05-717) 1:2000 Anti-mouse 1:5000 α-Tubulin 200 10 Abcam (ab4074) 1:5000 Anti-rabbit 1:10000
3.5
Primers:
Table 3 – Primers and related conditions in the qPCR experiments for individual genes
Primer
symbol Gene Organism Forward Primer Reverse Primer
Amplicon Size CypA * PPIA peptidylprolyl isomerase A (cyclophilin A) – Reference Gene
mouse TAT CTG CAC TGC CAA GAC
TGA GTG CTT CTT GCT GGT CTT GCC ATT CC 125bp Rpl13A * Ribosomal protein L13A – Reference Gene
mouse GGA TCC CTC CAC CCT ATG
ACA CTG GTA CTT CCA CCC GAC CTC 130bp
A2A *
Adenosine Receptor A2A
mouse ATTCCACTCCGGTACAATGG AGTTGTTCCAGCCCAGCAT 113 bp
A1 *
Adenosine Receptor A1
mouse TCGGCTGGCTACCACCCCTTG CCAGCACCCAAGGTCACACCAAAGC 155bp
*All stocks are at 100µM and working solutions are at 5µM (Invitrogen).
3.6 Data Analysis:
The values presented are mean ± SEM of n number of independent experiments. The significance of differences between the means of 2 conditions was evaluated by Student’s t-test. Values of P<0.05 were considered to represent statistically significant differences.
26
A1 A2
4. RESULTS
4.1 Extracellular levels of adenosine might be impaired in
MeCP2 KO animals
In a first step, we studied the extracellular adenosine levels by evaluating the disinhibition of synaptic transmission caused by the antagonism of A1R, as previously
described (Diogenes et al., 2014). It is postulated that higher levels of adenosine can cause more prominent tonic A1R-mediated inhibition, and as a result, a higher
facilitatory action of A1R antagonists should be visible (Diogenes et al., 2014).
Accordingly, we compared the effect of the selective A1R antagonist, DPCPX, at the
hippocampus at a supramaximal concentration (50 nM, Ki value for DPCPX at the
hippocampus ~ 0.5 nM; (Sebastiao et al., 1990)) on synaptic transmission in
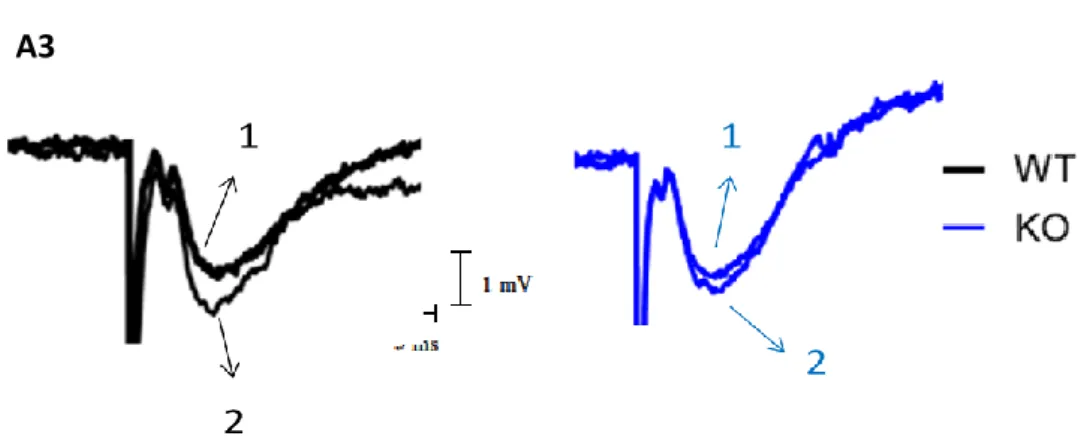
hippocampal slices taken from WT and MeCP2-KO animals. In hippocampal slices taken from WT mice, DPCPX (50 nM) increased the slope of fEPSP to 45.30 ± 10.12 % (n=4, Figure 13 - A1-3), while in slices from MeCP2-KO mice, induced a lower, increase in fEPSPs (27.20 ± 4.524%, n=8). Therefore, a lowest disinhibition of synaptic transmission caused by DPCPX was observed in MeCP2-KO mice, whereas a greatest disinhibition was found in WT mice. These data show that the WT mice have greater A1 inhibitory
27
A1 A2
A3
Figure 13 –Changes in fEPSP induced by DPCPX – A1 shows the averaged time courses of changes in fEPSP slope
induced by application of DPCPX (50 nM) in slices taken from WT (black symbols, n= 4) and KO (blue symbols, n=8) animals. The ordinates represent normalized fEPSP slopes, where 0% corresponds to the averaged slopes recorded for 10 min before DPCPX application and the abscissa represents the time of every recording. Panel A2 shows the comparison of the averaged effects of DPCPX in the different genotypes. Panel A3 shows averaged fEPSPs obtained in a representative experiment in A1; each trace is the average of eight consecutive responses obtained immediately before (1) and during (2) DPCPX application both in WT (left panel) and KO animals (right panel), and is composed of the stimulus artifact, followed by the presynaptic volley and the fEPSP. All values are mean ± standard error of mean (SEM).
To corroborate this hypothesis we compared the effect of the selective A1R
agonist, CPA, at the hippocampus at 3 different concentrations (3 nM, 10 nM, 30 nM) on synaptic transmission in hippocampal slices taken from WT and MeCP2-KO mice. Higher levels of endogenous adenosine can cause more prominent tonic A1R-mediated
inhibition, and as a result, a lower inhibitory action of A1R agonists should be visible.
The data obtained show an increased inhibitory action of A1R agonist (CPA) in KO when
compared to WT experiments. In detail, in hippocampal slices taken from both WT and KO mice, CPA induced a concentration dependent decrease of synaptic transmission which became significantly different for the highest used concentration of CPA (30 nM) (fEPSPWT: 31.40 ± 5.878%, n=7 vs fEPSPKO: 52.35 ± 6.530%, n=7, P<0.05, Figure 14 -
28
A3
Figure 14 - Changes in fEPSP induced by CPA – A1 shows the averaged time courses of changes in fEPSP slope induced by application of three different concentrations of CPA (3nM, 10nM, 30nM) in slices taken from WT (black symbols, n= 7) and KO (blue symbols, n=7) animals. The ordinates represent normalized fEPSP slopes, where 0% corresponds to the averaged slopes recorded for 10 min before CPA application and the abscissa represents the time of every recording. Panel A2 shows the comparison of the averaged effects of different concentrations of CPA in the different genotypes. Panel A3 shows averaged fEPSPs obtained in a representative experiment in A1; each trace is the average of eight consecutive responses obtained immediately before (1) and during (2) CPA 30 nM application in both WT (left panel) and KO animals (right panel), and is composed of the stimulus artifact, followed by the presynaptic volley and the fEPSP. All values are mean ± standard error of mean (SEM). *P<0.05 (Student’s t-test).
Furthermore, to evaluate whether A1R expression and levels were affected,
quantitative PCR and binding assays were preformed as described previously and in methods section. As shown in Figure 15 - A1, qPCR revealed no significant changes in cortical mRNA levels for A1R between WT and KO animals. The existence of
commercially available tritiated ligands for A1R allowed receptor binding assays, which
are frequently preferred for quantitative analysis of receptors. The A1R antagonist
[3H]DPCPX was used as ligand for A1R. Figure 15 - A2 shows the saturation isotherms
for the binding of [3H]DPCPX to cortical homogenates taken from the same brain as those used in extracellular electrophysiological recordings. It is evident that the specific [3HDPCPX binding is higher in MeCP2-KO animals than in WT mice, the difference being more pronounced for higher ligand concentrations. The Bmax values obtained by nonlinear regression analysis were 239 ± 24.57 fmol mg/protein (n=5) for the MeCP2-KO mice, and 127.8 ± 17.04 fmol mg/protein (n=5) for the wild type animals (P< 0.05). No significant differences in the Kd values were found (MeCP2-KO mice: 4.101 ±1.452 nM, n=5; WT mice: 6.748 ± 2.678 nM, n=5, P>0.05). This data show an increase in A1R levels in KO animals. Taken all together, this characterization
29
A1 A2*
D A2 B*
α-Tubulin 50 KDa -W T K O 45KDa -A2A R A1 #strongly favors the hypothesis of a decreased extracellular adenosine levels in KO animals with a compensatory increase on A1R protein levels.
Figure 15 – A1R levels and expression – A1 histogram represents relative qPCR data showing mRNA levels of A1R
(n=5) present in cortical samples from WT (black bars) and KO (blue bars) animals. PPIA peptidylprolyl isomerase A (cyclophilin A) and Ribosomal protein L13A were used as an internal loading control. In A2 are shown saturation isotherms for the binding of the selective A1R receptor antagonist [3H]DPCPX to the cortical homogenates of WT
(black symbols, n=5) and KO (blue symbols, n=5) animals. All values are mean ± standard error of mean (SEM) ; #P<0.05 (F test).
4.2 Levels of A
2AR are increased in MeCP2 KO animals
Given the changes detected on A1R levels, in this animal model, we also
evaluated whether changes in cortical A2AR levels and expression could be present.
Indeed, as seen in Figure 16 - B, it seems fairly evident that the levels of expression of A2AR mRNA levels are higher in KO animals (2.123 ± 0.3338, n=4) than WT mice (1.000
± 0.2855, n=5, P<0.05). One the other hand, while evaluating A2AR levels by western
blot, in four brain samples, reveals no significant changes in cortical protein levels for A2AR between WT and KO animals (n=4, Figure 16 - A1,2, P>0.05).
30
#
Figure 16 – A2AR levels and expression – In A1 are shown the averaged of A2AR receptors density evaluated in four
cortical brain samples by western blot analysis taken from WT (black bars) and KO (blue bars). A2 shows representative western blot using an antibody which recognizes A2AR receptors (~45 KDa). α-tubulin (~50 KDa) was
used as loading control. The values obtained for WT samples were considered as 1.B histogram represents relative qPCR data showing mRNA levels of A2AR present in cortical samples from WT (black bars, n=5) and KO (blue bars,
n=4) animals. PPIA peptidylprolyl isomerase A (cyclophilin A) and Ribosomal protein L13A were used as an internal loading control. All values are mean ± standard error of mean (SEM); *P<0.05 (Student’s t-test).
Given the fact that we found so many alterations on signaling mediated by adenosine, and knowing that adenosine influences synaptic transmission mainly through A1R activation, we performed I/O curves to evaluate if basal synaptic
transmission was altered. Indeed, the hippocampal slices taken from KO animals displayed higher Emax values when compared with WT animals (EmaxWT= 0.9901 ±
0.04626, n= 4; EmaxKO= 1.781 ± 0.2129, n=4, P<0.05, F test; Figure 17). Therefore,
suggesting that RTT animals have actually higher synaptic activity that can be explained, in part, by the decreased adenosinergic tonus.
Figure 17 – I/O curve – Figure shows the input/output (I/O) curves corresponding to responses generated by various stimulation intensities (60–340 µA) in WT slices (black) and KO slices (blue). All values are mean ± standard error of mean (SEM); #P<0.05 (F test)