Universidade de Lisboa
Faculdade de Farmácia
IDENTIFICATION AND CHARACTERIZATION OF HOST CATHEPSINS AND
CYSTATINS DURING TUBERCULOSIS AND HIV CO-INFECTION OF
ANTIGEN PRESENTING CELLS
Ana Catarina Arsénio Fialho
Dissertation supervised by Professor Elsa Anes and co-supervised by
Professor José Miguel Azevedo Pereira.
Biopharmaceutical Sciences
2 This work was partially financed by ADEIM and by the project FCT PTDC/SAU-INF/28182/2017
3 Abstract
The human immunodeficiency virus (HIV) infection and tuberculosis are still major health problems. It is estimated that one third of the human population is latently infected with tuberculosis, with HIV infection being the major risk for reactivation.
Eradication of HIV and Mycobacterium tuberculosis (Mtb) infections is challenging due to establishment of latent reservoirs, as is the case of macrophages (Mϕ) and dendritic cells (DC), and the emergence of drug resistant strains. This difficulty is aggravated during co-infection. Thus, there is the need to develop and establish an efficient treatment to eradicate these infections.
The long-term goal of this work is the development of a host-directed strategy that, through the manipulation of lysosomal proteases, will boost the host cellular and humoral response against these microorganisms.
In the first part of this thesis we performed a transcriptomic analysis of all cathepsins and their inhibitors cystatins during mono- or co-infections of Mϕ or DC. Upon co-infection with Mtb and HIV, DC and Mϕ have a differential profile of expression being the analysed genes upregulated and downregulated. Further, during co-infections, the gene expression was dominated by the HIV infection.
In the second part we explored the role of cathepsin S and their manipulation as a strategy to control Mtb infection. Study of the involvement of microRNAs, revealed that miR-106b-5p is manipulated by Mtb and that it reduces cathepsin S protein expression. Through loss-of-function experiments, cathepsin S expression, Mtb killing within Mϕ and T cell activation increased. The decrease of Mtb survival was independent of apoptosis, necrosis and autophagy suggesting that miR-106b-5p action on cathepsin S enables Mtb to evade to the degradative activity of enzymes of the endocytic pathway.
These results show a distinct expression profile between HIV Mtb co-infected DC and Mϕ and suggest cathepsin manipulation as a potential target for host directed therapy in Mtb infection.
4 Resumo
O vírus da imunodeficiência humana (HIV) e a Mycobacterium tuberculosis (Mtb) são os patogenos causadores da síndrome da imunodeficiência adquirida e da tuberculose, respetivamente. É estimado que um terço da população mundial tem tuberculose latente, sendo a infeção por HIV o maior risco para a reactivação da tuberculose latente devido à extensa imunossupressão. A incidência da TB em pessoas infectadas por HIV teve um aumento de 40 % na Europa nos últimos 5 anos, sendo Portugal o terceiro país da Europa com a maior percentagem de pacientes com TB e infetados com HIV.
Embora as doenças causadas por HIV e por Mtb tenham vindo a ser extensivamente estudadas, ainda não existe uma terapia capaz de eliminar estas infeções. Estas dificuldades são causadas em parte pelo aparecimento de estirpes resistentes aos antibióticos/antivirais utilizados e pela existência de reservatórios celulares latentes que contêm estes patogenos num estado de dormência, permitindo que o sistema imune não os ataque nem que estes sejam alvos dos diversos tratamentos. Além disso, quando o mesmo hospedeiro é infetado por HIV e por Mtb a dificuldade em tratar e erradicar ambas as infeções é ainda mais crítica, dado que estes patogenos exacerbaram a infeção um do outro. Deste modo, é necessário desenvolver e estabelecer novos tratamentos de forma a erradicar ou atenuar cada mono-infeção ou co-infeção.
O objetivo deste projeto é o desenvolvimento de uma terapia direcionada ao hospedeiro, através da manipulação de proteases lisossomais, de forma a fortalecer a resposta celular e humoral do hospedeiro contra o HIV e o Mtb durante as mono-infeções e as co-mono-infeções e potencialmente melhorar as terapias existentes. Para tal foi estabelecido um modelo de co-infeção que pretendia assemelhar-se à infeção por Mtb de um indíviduo previamente infectado por HIV e num estado de latência viral. Neste estudo foi também incluído um modelo de co-infeção por HIV-2 e Mtb. Desta forma foi estudada a infeção por HIV-2 que afecta um menor número de indivíduos comparativamente à infeção por HIV-1. Este vírus é também tido como um modelo de HIV com menor virulência.
Numa primeira fase, foi determinada a expressão genética das catepsinas e dos seus inibidores naturais, as cistatinas, durante a mono-infeção por Mtb, HIV-1 e HIV-2 e durante a co-infeção Mtb-HIV em células dendríticas e macrófagos. Numa segunda fase foi determinado se a manipulação da catepsina S por Mtb via
5 microRNAs (miRNAs) contribuía para a sobrevivência intracelular desta bactéria em macrófagos e para o escape à apresentação de antigénios a linfócitos T.
De forma a caracterizar o modelo de infeção estabelecido foi determinada a carga viral e micobacteriana das células assim como a morte celular das mesmas por apototse e necrose. A carga micobacteriana da mono-infeção por Mtb era superior à da co-infeção HIV Mtb em células dendríticas e macrófagos aquando da medição da expressão genética das catepsinas e cistatinas. A morte celular por apoptose e necrose foi também medida e revelou que enquanto as células dendríticas encontram-se maioritariamente num estado inicial de apoptoencontram-se, os macrófagos apreencontram-sentam uma maior percentagem de células em fases mais avançadas da apoptose. Em ambos os tipos celulares a necrose ocorre em menos de 1 % das células. Tanto as mono-infeções por HIV-1 e HIV-2 como as co-mono-infeções tiveram um aumento na percentagem de células apoptóticas comparativamente com as mono-infeções com micobactéria, sugerindo que é o efeito do HIV que impera durante as co-infeções.
Neste trabalho foi elucidado o controlo da expressão genética resultante da infeção por Mtb, HIV-1 e HIV-2 durante a mono- e a co-infeção de células apresentadoras de antigénio. As células dendríticas e os macrófagos apresentam uma expressão genética diferencial entre si, observando-se um aumento de expressão geral nas células dendríticas relativamente a macrófagos. O perfil de expressão genética da mono-infeção por HIV-1 e por HIV-2 é idêntico em macrófagos, mas distinto em células dendríticas. Em ambos estes tipos celulares a expressão genética durante a co-infeção foi semelhante à da mono-infeção por HIV-1 e HIV-2. É de notar que as infeções bacterianas apresentam mais diferenças na expressão genética de catepsinas e cistatina durante a infeção de macrófagos. Em contraste, as infeções por HIV-1 e HIV-2 apresentam um maior número de genes diferencialmente expressos durante a infeção de células dendríticas.
O estudo do envolvimento dos microRNAs (miRNA) na modulação da resposta celular do hospedeiro após a infeção por Mtb em Mϕ mostrou que o miR-106b-5p é manipulado por este microrganismo. Sendo que este miRNA tem como alvo a catepsina S, uma das catepsinas que participa na degradação lisossomal do Mtb e na apresentação de antigénios, foi determinado o seu efeito na expressão desta proteína. Os resultados obtidos indicam que o miR-106b-5p reduz a expressão proteica da catepsina S. A manipulação deste miRNA permitiu observar que ao aumentar a sua expressão, a expressão da catepsina S diminui e a sobrevivência intracelular do Mtb aumenta. Em contraste, ao diminuir o miR-106b-5p houve o aumento da expressão da
6 catepsina S e a diminuição da sobrevivência intracelular do Mtb. Foi também demonstrado que a sobrevivência intracelular do Mtb é independente da apoptose, necrose e autofagia o que sugere que a ação do miR-106b-5p na catepsina S permite que o Mtb escape aos enzimas hidrolíticos das vias endocíticas. Ao inferir o impacto da manipulação do miR-106b-5p na apresentação de antigénios e consequentemente na ativação de células T, a inibição deste miRNA levou a um aumento da expressão de moléculas apresentadoras de antigénio à superfície da membrana celular dos Mϕ. Este aumento foi acompanhado por um aumento na ativação de células T após contacto com Mϕ infectados por Mtb.
Estes resultados mostram que existe uma expressão diferencial dos genes das catepsinas e cistatinas entre DC e Mϕ co-infectados com HIV-1 ou HIV-2 e Mtb e que o miR-106b-5p é um potencial alvo para o desenvolvimento de uma terapia direcionada durante a infeção por Mtb.
7 Acknowledgements
This was until now the biggest and the most challenging project that I embraced.
I want to thank my supervisor, professor Elsa, and co-supervisor, professor José Miguel, for giving me the opportunity to develop this work, for answering my questions, for believing and guiding me.
A special thanks to David and Nuno for teaching me all the procedures, planning and troubleshooting related to our laboratory and to our precious mycobacteria. Among many things, you taught me that regardless of the time the sun rises, the day begins around 11am and that I must be prepared to be scared at any time! I also want to thank Marta, my HIV mentor, for initiating me in the P3, for telling me not to be afraid of a big volume of samples to process and how to handle that senior ultracentrifuge. To all of you a huge thanks for your patience, good mood, for clarifying all my doubts and for those conversations about both everything and nothing. Ricardo Calderón, thanks for your help in the laboratory.
A heartfelt thanks to Francisco, my colleague and friend, for helping me in the laboratory and life in general! I will never forget our P3 marathons. We still have to design and construct our guiché.
I´m very grateful for all the encouragement and care that my family gave me during this thesis and during all my life. This would not have been possible without them.
I would like to acknowledge Instituto Português do Sangue e da Transplantação and all the blood donors that unknowinglysupported this thesis.
Finally, I acknowledge the opportunity to have participated in what follows:
- Pires, D. et al. Mycobacterium tuberculosis Modulates miR-106b-5p to Control Cathepsin S Expression Resulting in Higher Pathogen Survival and Poor T-Cell Activation. Front. Immunol. 8, 1–13 (2017).
- 10th iMed.ULisboa and 3nd i3du Postgraduate Students Meeting, Faculdade de
Fármacia, Universidade de Lisboa, 2018, HIV and Mycobaterium tuberculosis co-infection leads to a differential regulation of cathepsins and cystatins in macrophage and dendritic cells
- 9th iMed.ULisboa and 2nd i3du Postgraduate Students Meeting, Faculdade de
Fármacia, Universidade de Lisboa, 2017, Inhibition of miR-106b-5p Improves the Antigen Presentation Capacity of Macrophages Infected with Mycobacteria
- Science Talks, Tuberculose, Faculdade de Fármacia, Universidade de Lisboa, 2018, Catepsinas, vias degradativas e o papel dos miRNA's e implicações no controlo da Tuberculose
- 1º Simpósio de Investigação em Tuberculose e Micobactérias Não Tuberculosas em Portugal, Exploratório - Centro Ciência Viva de Coimbra, 2018
8
Index
Introduction ... 9
a. Route of transmission and propagation of infection ... 9
b. HIV and Mtb escape from the immune system ... 10
c. Cathepsins and cystatins as players of the immune system ... 14
d. MicroRNAs as tools for host directed therapy ... 15
Objective ... 16
Materials and Methods ... 17
Results ... 23
1. Characterization of the infection ... 23
2. Gene expression profile of cathepsins and cystatins in macrophages and dendritic cells ... 32
a. Infections of dendritic cells lead to a general upregulation profile relatively to macrophages. ... 33
b. HIV mono-infections lead to an opposite expression profile of cathepsin and cystatin genes between dendritic cells and macrophages. ... 34
c. Comparison of Mtb and HIV-1 mono-infections with HIV-1 Mtb co-infection ... 34
d. Comparison of Mtb and HIV-2 mono-infection with HIV-2 Mtb co-infection ... 36
3. Control of cathepsin S expression by Mycobacterium tuberculosis ... 37
a. miR-106b-5p expression is induced by Mtb and cathepsin S expression is modulated by miR-106b-5p ... 37
b. miR-106b-5p reduces cathepsin S protein expression during Mtb infection of macrophages ... 39
c. miR-106b-5p increases Mtb intracellular survival in Mϕ ... 41
d. miR-106b-5p modulates antigen presentation machinery and T-cell priming ... 44
Discussion ... 47
Conclusion ... 53
References ... 54
List of Tables and Figures ... 62
List of acronyms ... 63
9
Introduction
Mycobacterium tuberculosis (Mtb) and the human immunodeficiency virus (HIV) are the causative pathogens of tuberculosis (TB) and acquired immunodeficiency syndrome (AIDS), respectively. TB is the leading cause of death by an infectious agent and the 10th cause of death worldwide 1, registering 1.3 million death in 2016. It is
estimated that 36.9 million people are currently living with HIV and that 1.8 million people became newly infected in 2017 2. In 2016, 1.2 million people were co-infected
with Mtb and HIV, while 476 774 co-infected people died, with TB being the leading cause of death among HIV-infected individuals. Since TB in HIV-infected patients continues to grow, with an increase of 2 % in the number of TB patients with an HIV test result between 2015 to 2016, and with the increase of the cases with resistance to antibiotics and antivirals, it is crucial to develop other treatments that will enable to attenuate and eradicate these infections both during mono- and co-infection 1–4.
a. Route of transmission and propagation of infection
Mtb is mainly transmitted by the inhalation of airborne droplets containing the bacilli, expelled by an individual with active tuberculosis. Once inside the lungs of the new host, Mtb reaches the alveoli where it encounters resident alveolar Mϕ, DC and neutrophils, and may be readily eliminated by the innate immune response 5–7. However, in 10 % of infection cases it resists to this response and persist in the lungs. While Mϕ differentiate to have a stronger effect in situ, DC mature to migrate to secondary lymphoid organs, prime naïve T cells and recruit more immune cells, particularly T cells and natural killer cells, to the infection site 5,6,8,9.
The recruitment of cells to the infection site leads to the formation of a granuloma, a structure composed of several layers of different types of cells and with a necrotic core, in which the bacilli is contained and may persist inside the host, establishing a latent infection 10. This structure acts as a host defence, by impairing Mtb
dissemination, however it can also serve as a replication niche for the mycobacteria8.
When infection is not contained in the granuloma, bacteria will actively proliferate throughout the lung tissue, leading to active pulmonary tuberculosis, and to other organs and tissues, causing extrapulmonary tuberculosis 5,6,8,11.
10 HIV transmission occurs when body fluids of an infected person – blood, semen, breast milk, rectal and vaginal fluids – come into contact with damaged, mucosal membranes, e.g. the genital tract, or when directly introduced in the blood stream of an uninfected person 12. Upon sexual transmission, HIV crosses the epithelial
barriers of the mucosal membranes and its captured by epidermal Langerhans cells and other immune cells, such as Mϕ and DC, that try to contain HIV infection. Yet, virus replicates within the mucosa cells inducing the transference of virus from cell to cell, such as from Langerhans cells to mucosal T lymphocytes. The viral propagation may occur due to infection of cells by viral particles or by cell-to-cell infection, which is thought to be the preferential and most efficient way of viral spreading, due to a higher transfer of viral particles and proteins 13–15. HIV infected T lymphocytes and DC then migrate to the lymph nodes, where viral replication continues, allowing dissemination of HIV into the bloodstream and consequently to several organs 16,17.
Thus, HIV infection is characterised by an initial acute stage, in which HIV rapidly replicates and spreads through the body, decreasing substantially the number of CD4+ T cells. After this peak in HIV load, there is a significant reduction of HIV
replication caused by the host immune response, and a slight increase in CD4+ T cell
counts. Afterwards, HIV infection enters in the asymptomatic stage, which can last for several years. This stage is characterized by low HIV loads and a gradual and irreversible reduction of CD4+ T cells. Finally, after several years/decades, the
immunodeficiency prevails, allowing the establishment of several opportunistic infections and cancers. This is the final stage of HIV infection: the AIDS stage 18–20.
b. HIV and Mtb escape from the immune system
Pathogen elimination is composed of an orchestra of cellular functions, such as phagocytosis, production of anti-microbial molecules, induction of inflammation, production of signalling molecules, apoptosis, among others. When cells are infected with HIV or Mtb, these pathogens manipulate their cellular mechanisms to survive and replicate within these cells.
As it was referred before, the response of the immune system to Mtb infection generally culminates with the formation of a granuloma, which is composed by several cell types, such as Mϕ, DC, T cells, foam cells and epithelial cells, with Mϕ being the primary cellular niches of Mtb. HIV preferentially infects CD4+T cells and leads to their
depletion, causing a decrease in the production of pro-inflammatory cytokines – interferon γ (IFN-γ), tumour necrosis factor α (TNF-α) – and interleukin 2 (IL-2), that
11 participate in T cell differentiation 21. CD4+T cells induce the activation of Mϕ and DC to
enhance their antimicrobial effects with these cytokines, hence these lymphocytes are important for the maintenance of the granuloma 22. Not only the generalized depletion
of CD4+T cells during HIV infection contributes to granuloma failure, but also HIV
infection of Mϕ, DC and CD4+T cells affects Mtb containment 23. By infecting these
cells, which are then recruited to the Mtb infection site, HIV as access to the interior of the granuloma where it replicates and further exacerbates TB 24,25.
These pathogens can tune cellular receptors to facilitate their entry in cells and to impair the immune response. Mtb infection may promote and facilitate HIV entry in cells since it can increase the expression of CXCR4 and CCR5, both co-receptors used by HIV to enter host cells, and decrease the levels of MIP-1β, the ligand for CCR5 and a blocker of HIV replication in vitro. In turn, HIV infection induces the expression of CD38, CD70, human leucocyte antigen DR (HLA-DR) that fragilizes T cell response against Mtb 24,26,27.
HIV and mycobacteria burden may be potentiated by cytokines and by HIV proteins. In HIV infected monocyte-derived macrophages (MDM) and in the chronically HIV infected monocytic U1 cell line, viral replication was shown to be enhanced by macrophage colony-stimulating factor (M-CSF), TNF-α, TNF-β, IFN-γ, 1, 4 and IL-6, and supressed by IFN-α, IFN-β, GM-CSF, IL-4, IL-10, IL-13 and IL-16 21,27,28. Mϕ
activated by mycobacteria lipopolysaccharide (LPS) release TNF-α, IL-1 and IL-6, which were also shown to enhance viral replication and viral transcriptional activation during co-infection 24,29. Co-infected MDM have a higher growth of Mtb then Mtb
mono-infected MDM and stimuli with TNF-α and IFN-γ enhanced Mtb growth in MDM HIV infected but not in uninfected MDMs 28. In contrast, Mtb growth is lower in HIV infected
alveolar Mϕ with specific CD4 counts despite a higher ability of mycobacteria internalization and intracellular burden 30. HIV proteins also contribute to enhancement
of viral replication, especially Nef, Vpr and Tat, since they mimic TNF signalling and activate the HIV long terminal repeat (LTR) and the viral promoter 22,29,31.
Phagocytosis is a process by which particles, microorganisms, dead or dying cells are internalized and degraded within a phagolysosome. When pathogens are phagocytosed by phagocytic cells, such as DC and Mϕ, their degradation enables the presentation of pathogen-derived antigens that are presented at the surface of these cells to sensitize and activate other immune cells to fight infections. Briefly, particles are recognised by host cellular receptors triggering membrane remodelling and rearrangement of the actin cytoskeleton that allow the membrane to surround and
12 internalize the particles in a phagosome. Then this phagosome matures into a phagolysosome by fusion and fission with early, late endosomes and lysosomes, changing its content and membrane composition. In this process it becomes more acidic and acquires degradative enzymes, such as cathepsins, antimicrobial peptides, reactive oxygen species (ROS) and reactive nitrogen species (NOS), that confer it a degradative environment that enables degradation32–34.
Mtb can prevent phagosome maturation by interfering with (i) phagosome acidification, (ii) membrane remodelling, through the inactivation of vesicular transport proteins -Ras-related protein-5 (Rab5) and Rab7; (iii) lysosome fusion, through the action of mycobacterial proteins, (iv) impairment of protein degradation, among others
35–40. If Mtb cannot successfully inhibit phagosome maturation, it also has mechanism
to resist to the phagolysosome environment 33,41,42.
HIV can trigger phagocytosis in infected and uninfected cells to impair the immune response. It interferes with Fcγ-mediated phagocytosis, through the downregulation of the expression of FcγR subunits, with endosome transport and actin polymerization, through the action of HIV proteins, such as Nef, Vif, Vpr, Tat and Rev
43–45.
When phagocytosis/endocytosis is blocked, autophagy can be initiated allowing pathogen degradation and elimination to continue. This process is based on the engulfment of cytoplasmic cargo, such as organelles or bacteria, in an autophagosome that then fuses with lysosomes allowing the degradation of their content 46. Autophagy has been associated with programmed cell death. Its induction
through IFN-γ, together with the production of NOS and antimicrobial peptides, are one of the cellular backup plans after phagocytosis/endocytosis failure. However Mtb and HIV may escape this pathway 21,47.
Mtb can inhibit autophagy through modulation of host proteins, as shown in the human leukaemia monocytic cell line (THP-1), due to the overexpression of the anti-autophagic factor Bfl-1/A1, and in mouse Mϕ 48,49. Also, Mtb components and products,
such as the lipoarabinomannan (LAM), were shown to inhibit autophagy in Mϕ, while for DC this was seen with the Esx-1 secretion system 50.
HIV inhibits autophagy through the action of Tat protein in monocytes and Mϕ by upregulating IL-10 and supressing IFN-γ-induced autophagy and by activating the Src-Akt and the STAT3 pathways known to inhibit this cellular process. When autophagy is blocked in early stages, Nef protein may lead to the accumulation of autophagosomes in Mϕ, consequently impairing autophagy 50.
13 By interfering with phagocytosis/endocytosis and autophagy, pathogens are also interfering with antigen presentation. These pathways degrade pathogens allowing the processing and delivery of pathogen-derived antigens to human leukocyte antigen (HLA) class II molecules. These molecules present antigens on the cellular membrane of the host infected cell and amplify the immune response by activating and expanding CD4+T cells.
Mtb can interfere with antigen processing and presentation through TLR signalling, in part due to blockage of IFN-γ dependent induction of major histocompatibility complex (MHC) class II molecules. Mtb infected Mϕ were shown to have reduced expression of MHC class II molecules and decreased ability to present antigens, which may be due to the interaction of mycobacterial lipoproteins with the TLR2 receptor. These lipoproteins and cell wall glycolipids may act as agonists for this receptor enhancing the immune response, however the continuous TLR signalling, not only through TLR2 but also TLR4 and TLR9, may inhibit MHC class II antigen processing and presentation 51. Besides TLR signalling, Mtb can also impair antigen
presentation through the disruption of the endosomal sorting complex required for the transport of MHC class II molecules to the cellular membrane 52.
Antigen presentation by MHC class I and II molecules is also impaired during HIV infection. Expression of Nef decreases T cell stimulation efficiency and decreases surface expression of mature MHC class II molecules, leading to the accumulation of immature MHC class II molecules at the cellular surface 53. Antigen presentation by
MHC class I molecules to cytotoxic T cells may also be affected by Nef, since it interferes with transport of these molecules in the trans-Golgi network by interacting with host proteins related to this pathway 54.
Pathogen elimination can be accomplished through the induction of cell death. Apoptosis prevents the release of the content of the dying cell to the cellular environment, thus not inducing inflammation. It involves cell shrinkage, chromatin condensation, plasma membrane blebbing, disintegration of the nucleus and formation of apoptotic bodies. These apoptotic bodies are then phagocyted and degraded in the phagosome of phagocytic cells. Apoptosis can be activated through the extrinsic pathways by interactions of specific ligands with transmembrane death receptor, such as FasL/FasR, TNF-α/TNFR1 or TNFR2 and TRAIL/DR4 or DR5, or the intrinsic pathway by intracellular stimuli independent of receptors. Both of these pathways lead to the activation of caspases that in turn activate several other proteins that cause the cellular alterations referred previously 55.
14 Mtb can impair apoptosis and in turn induce necrosis, which is a type of cell death characterized by the loss of membrane integrity and induction of inflammation, thus promoting its dissemination. Mtb can escape apoptosis by inducing the dissociation of death receptors from the cellular membrane, neutralizing the antimicrobial activity of their ligands, by decreasing and increasing the expression of death receptors and anti-apoptotic proteins, respectively, among others 56–59.
During HIV infection, the virus may induce apoptosis of infected and uninfected cells to disseminate and impair the immune system. Its induction has been correlated with high expression levels of FasL in HIV infected monocytes, Mϕ and natural killer cells in vivo. HIV also increases the expression levels of TRAIL in DC and Mϕ, thus mediating apoptosis of uninfected and infected cells 60,61. HIV proteins have a crucial
role during balance of apoptosis, having an anti- or pro-apoptotic effect by up and downregulating anti-apoptotic proteins, death cell receptors and ligands, preventing caspase activation, among others 31,60,62–64.
c. Cathepsins and cystatins as players of the immune system
A group of important players in the destruction of pathogens inside infected cells are acidic hydrolytic lysosomal enzymes. Lysosomes are known to contain a degradative environment not only due to the acid pH, ROS and NOS but also due to enzymes that are capable of degrading polysaccharides, nucleotides, lipids, peptides, among other.
Proteases are responsible for the hydrolysis of peptide bounds and can be classified according to their catalytic target in metalloproteases, aspartic, cysteine, serine and threonine proteases, being these the classes that are present in human cells although there are more. Among proteases, human cells express 15 cathepsins: two aspartic proteases – cathepsin D and E –, two serine proteases – cathepsin A and G -, and the remain are cysteine proteases – cathepsin B, C, F, H, K, L, O, S, V, W and Z. These can have endopeptidase activity – cathepsin D, E, F, G, K, L, S and V-, exopeptidase activity- cathepsin A, C and Z – or both – cathepsin B and H 65,66.
The expression and localization of each cathepsin is associated with their function. Hence, cathepsin B, C, D, F, H, L, V, Z are ubiquitously expressed, while cathepsin K, L, S and W are tissue-specific 67. These proteases can be contained in the
lysosome and endosomes or be secreted for the extracellular space enabling them to participate (i) in TLR signalling, as does cathepsin B and F, which were shown to be
15 required for the proteolytic cleavage of TLR7 and TLR9; (ii) in cytokine release and receptor activation, as shown by cathepsin G and its relationship with IL-1β, IL-8, TNF-α and the epidermal growth factor receptor; (iii) in the remodelling of the extracellular matrix, e.g. cathepsin K degrades collagen due to its collagenase activity; (iv) in antigen processing, by degrading extracellular proteins from internalized pathogens, and antigen presentation at the level of the MHC class II, by dissociating the invariant chain of these receptors and leading to their maturation, e.g. cathepsin L and S; (v) T cell migration, e.g. cathepsin Z; and also (vi) in apoptosis, as seen for cathepsin D, which activates caspase-8 in neutrophils, and cathepsin B that, by cleaving Bid, a pro-apoptotic protein, induces caspase activation and so apoptosis in neutrophils 65,68,69.
Since cathepsins catalyse the irreversible hydrolysis of peptide bonds, they are tightly regulated during their transcription, activation and activity. Cathepsins are synthetized in the cell cytoplasm as inactive enzymes and, after post-translational modifications in the endoplasmic reticulum, they are sorted to the Golgi network. They are then incorporated in endosomes and delivered to lysosomes, becoming activated by the action of other proteases or by autocatalysis promoted by the acidic environment. Their activity is manly regulated by their endogenous inhibitors - cystatins, stefins, thyropins and serpins. Cathepsins are known to be inhibited by several cystatins, such as cystatin A, B, C, D, E/M, F and SN. These inhibitors bind reversibly to these proteases in their active site, thus competing with the substrate 70–72. These proteins and their regulators are important elements of the immune system. Defects and dysregulation of cathepsins caused by mutations, increased expression or activity, can be associated with cancer, Alzheimer’s, obesity, inflammatory disease, genetic disorders, like the hereditary cystatin-C amyloid angiopathy, Mtb and HIV infections, and so on 73,74.
d. MicroRNAs as tools for host directed therapy
MicroRNAs (miRNAs) are non-coding RNA sequences with around 21-24 nucleotides that regulate post-transcriptional gene expression 75. These molecules
target specific mRNAs when incorporated in the RNA-induced silencing complex and upon binding to their targets they lead to inhibition of mRNA translation or degradation
76.
MicroRNAs can regulate the development and function of innate and adaptive immune cells and their dysregulation was shown to occur in several cancers and
16 autoimmune diseases where immune response is compromised 77. In the context of
bacterial or viral infections, not only miRNAs serve as a host cellular defence as their manipulation by the pathogens may confer them intracellular advantages, such as modulation of the inflammatory response 78. In Mtb infection several miRNAs have
been described to be dysregulated and to be manipulated by this pathogen, such as miR-142-3p 79, leading to impaired phagocytosis, chemotaxis, cytokine signalling and
apotosis 80. For HIV infection it has been proposed that some viral proteins directly
interact with or alter the expression of proteins that participate in the biogenesis and maturation of miRNAs. In turn, some miRNAs were shown to have anti-HIV activity by binding to viral mRNA, such as miR-223, while others enhanced HIV infection, such as miR-132 81.
The increasing appearance of Mtb and HIV drug-resistant strains and the existence of latent cell reservoirs are severe obstacles for HIV eradication and Mtb control and has boosted the development of new therapeutics. miRNAs mimics or inhibitors might serve as post-transcriptional regulators of several host factors that intervene in the infection. Thus, modulation of miRNAs can contribute to the development of novel treatments that are not restrained to drug resistance and to the replication status of the pathogen 75,82.
Objective
HIV and Mtb can impair cathepsin-related functions, such as antigen presentation, phagosome maturation and pathogen degradation. With the general aim of developing a host directed therapy this thesis has two main goals: (i) decipher the expression profile of cathepsins and cystatins during Mtb, HIV-1 and HIV-2 mono-infections and during HIV Mtb co-infection of monocyte-derived macrophages and dendritic cells; (ii) to gain control over Mtb infection by modulating lysosomal hydrolases expression through the manipulation of miRNAs in monocyte-derived
17
Materials and Methods
Cell lines and culture conditions
Total PBMCs, CD4+ lymphocytes and CD14+ monocytes were isolated from buffy coats
from healthy donors provided by the national blood institute (Instituto Português do Sangue, Lisbon, Portugal). CD14+ monocytes were differentiated into dendritic cells
(DC) or macrophages (Mϕ).
Buffy coats were diluted ½ with MACS buffer (EDTA 2 mM Gibco, 0.5 % inactivated fetal bovine serum (FBS) Corning, phosphate-buffered saline (PBS) without Ca2+ and
Mg2+ pH 7.2 Gibco) and its components were separated with a density gradient
centrifugation (800 x g, 20 min) using Ficoll-Paque (GE Healthcare Life Science). This gradient leads to the formation of a top layer of plasma, a second layer where PBMCs and lymphocytes are found, a third layer of Ficoll-Paque and a last and most dense layer composed of erythrocytes. The second layer was recovered, the cells were resuspended in MACS buffer, and centrifuged at 500 g for 10 min. The resulting supernatant was rejected. Cells were resuspended in MACS buffer, centrifuged (500 x g, 5 min) and the resulting cell pellet was resuspended in MACS buffer. CD14+ and
CD4+ cells were isolated by incubation of the resuspended pellet in Micromagnetic
beads CD14+ (Miltenyi Biotec) and Micromagnetic beads CD4+ T cell isolation kit,
respectively. Cells were separated with MACS cell separation system following the manufacturer instructions (Miltenyi Biotec).
After separation, CD14+ cells and CD4+ cells were counted, centrifuged at 500 x g for 5
min, resuspended in the appropriate volume medium and seeded as needed. CD4+
cells were resuspended in RPMI 1640 medium (Gibco) with 15 % FBS (Corning), 1 % L-glutamine 200 mM (HyClone), 50 µg/mL gentamicin (Gibco), 20 U/mL IL-2 and 3 µg/mL polybrene (Sigma). CD14+ cells were differentiated in DC and Mϕ for 7 days and
in the 4th day of differentiation fresh media supplemented with the respective cytokines
was added. For DC differentiation, CD14+ cells were seeded in RPMI complete
medium - RPMI medium containing 10 % FBS (Corning), 1 % sodium pyruvate (HyClone), 1 % penincillin streptomycin (Gibco), 1 % glutaMAX (Gibco), 1 % HEPES buffer (HyClone), 0.1 % β-mercaptoethanol (Gibco) – with granulocyte-macrophage colony-stimulating factor (GM-CSF) 10 ng/mL and interleukin 4 (IL-4) 20ng/mL (ImmunoTools). For Mϕ differentiation, CD14+ cells were cultured for 3 h in RPMI
medium (Gibco) containing 1 % glutaMAX (Gibco) and 1 % HEPES buffer (HyClone). Afterwards it was added medium containing 20 % FBS (Corning), 2 % sodium pyruvate (HyClone), 2 % penincillin streptomycin (Gibco), 2 % glutaMAX (Gibco), 2 % HEPES buffer (HyClone), 0.2 % β-mercaptoethanol (Gibco) and macrophage colony-stimulating factor 20 ng/mL (M-CSF) (ImmunoTools).
Mycobacterium smegmatis mc2 155, containing a p19 (long lived) EGFP plasmid
(Msm-GFP), the green fluorescent protein (GFP)-expressing strain of Mycobacterium tuberculosis (H37Rv-pEGFP) plasmid (Mtb-GFP), the Mycobacterium smegmatis mc2155 wild type strain (Msm) and the Mycobacterium tuberculosis H37Rv strain (Mtb) are part of the mycobacteria library of our research unit (Host-Pathogen Interaction Unit, at iMed.ULisboa). Msm strains were grown in medium containing Middlebrook’s
18 7H9 Medium (Difco), nutrient broth (Difco) supplemented with 0.5 % glucose (Sigma) and 0.05 % Tween 80 (Sigma) at 37 °C on a shaker at 200 r.p.m. Mtb strains were grown in Middlebrook’s 7H9 medium supplemented with 5 % glycerol (Invitrogen), 0.05 % (v/v) Tween 80 (Sigma) and 10 % OADC Enrichment (Difco) at 37 °C, 5 % CO2.
HIV-1 92US660 (biotype R5) and HIV-2 Cas.04 (biotype R5X4R8) isolates were previously obtained from infected patients’ and are part of the HIV library of our research unit (Host-Pathogen Interaction Unit, at iMed.ULisboa). New viral stocks of these virus were established in phytohaemagglutinin (PHA) stimulated PBMCs, which were isolated from buffy coats from healthy donors provided by the national blood institute (Instituto Português do Sangue, Lisbon, Portugal). Buffy coats were processed as described previously. The resultant cell pellet was resuspended in RPMI media containing 15 % FBS (Corning), 50 µg/mL gentamicin (Gibco), 1 % L-glutamine 20 mM (Hyclone) and 3 µg/mL PHA (Sigma). Cells were counted, seeded and stimulated for 3 days with PHA. After this period, cells were counted and resuspended in RPMI medium containing 15 % FBS (Corning), 50 µg/mL gentamicin (Gibco), 1 % L-glutamine 20 mM (HyClone), 20 U/mL IL-2 (ImmunoTools) and 3 µg/mL polybrene (Sigma). -80 oC frozen
aliquots of the viruses with high viral load were thawed at 37oC and added to the PHA
stimulated PBMCs. At day 7, 14, 20 and 28, PHA stimulated PBMCs were added to the viral cultures and the volume was adjusted with medium. Virus production was measured at day 10, 18 and 22 with an enzyme immunoassay (INNOTEST HIV Antigen mAb, Fujirebio) that detects the presence of p24 protein of HIV-1 and HIV-2. On day 30, the viral supernatant of cells was stored at -80 oC, being the viral replication
assessed by measuring the activity of the viral reverse transcriptase enzyme using Lenti RT Activity Kit (CAVIDI).
Infections of DC, Mϕ and PBMCs
Viral stocks were ultracentrifuged for 1 h at 50 000 x g and resuspended in the appropriate volume of RPMI complete medium. 7 days differentiated DC and Mϕ were centrifuged for 5 min at 500 g, the culture medium was removed and cells were infected with RPMI complete medium containing 1ng of HIV-1 or HIV-2 reverse transcriptase (RT) per 9 x 10⁵ cells for 24 h at 37 oC, in 5 %CO
2.
Mycobacteria cultures on exponential growth phase (Msm, Msm-GFP, Mtb or Mtb-GFP) were centrifuged (3000 x g, 5 min), washed in PBS (Gibco), centrifuged again (3000 x g, 5 min), resuspended in RPMI complete medium without antibiotics and subjected to an ultrasonic bath. Further centrifugation (500 x g, 1 min) and absorbance readings at 600 nm allowed to determine bacteria optical density. Cells were washed with PBS and incubated with mycobacteria at MOI 1 (1 bacteria/cell) for 3 h at 37 oC, in
5 % CO2. After this period RPMI complete medium without penincilin-spreptomycin
(Gibco) and 5µg/mL gentamicin (Gibco) was added and cells were incubated for the desired time at 37 oC, in 5 % CO
2.
For the co-infection, cells were first infected with the virus for 24 h, following infection with mycobacteria for 3 h and maintained in culture until 48 h after bacterial infection. The following conditions were studied: no infection, Msm, Mtb, HIV-1 or HIV-2 mono-infection and HIV-1 Msm, HIV-2 Msm, HIV-1 Mtb or HIV-2 Mtb co-mono-infection.
19 HIV replication
DC, Mϕ and PBMCs were seeded in 12-well plates at a density of 9 x 10⁵ cells/well.
Supernatant of infected cells was collected 72 h after the HIV-1 or HIV-2 infection, centrifuged (500 x g, 5 min) to remove any cells and then viral replication was analysed using Lenti RT Activity Kit (CAVIDI). This assay detects the activity of the viral reverse transcriptase being a measure for viral replication. Briefly, the RT present in the sample synthetizes a DNA strand from the RNA template provided using BrdUTP labelled nucleotides. The labelled DNA strand is then detected with an alkaline phosphatase conjugated α-BrdU antibody and a colorimetric alkaline phosphatase substrate, being the activity of this enzyme proportional to the RT activity. Infection of PBMCs was used as positive control.
HIV integration
DC, Mϕ and PBMCs were seeded in 12-well plates at a density of 9 x 10⁵ cells/well.
Following infection, DNA was extracted using the NZY Tissue gDNA Isolation kit (NZYTech). Cells were treated with proteinase K and RNase A, to remove proteins and RNA, lysed and applied in a silica-based spin column with affinity to DNA. After several rounds of washing and centrifugation steps, DNA was eluted. The quantity and quality of the DNA was determined by measuring the 260/230 and 260/280 nm absorbance ratios using a NanoDrop™ 1000 spectrophotometer.
DNA was amplified by nested PCR using the NZYTaq II 2× Green Master Mix (NZYTech) and a specific set of primers that bind to Alu sequences, the long terminal repeat (LTR) or the gag gene - Table 1. The PCR conditions used are shown in Table 2. DNA amplification fragments were separated by a 2 % agarose gel electrophoresis and were visualized with ethidium bromide (2.07 ng/mL) in a transilluminator. The 100 bp DNA ladder (New England Biolabs) was used to determine the size of the DNA bands.
Table 1: Description of the primers used in the amplification of HIV DNA. For each viral strain it was used two pair of primers designed to bind to an Alu sequence, the LTR or the gag gene. Forward and reverse primers are denotated with an F or R superscript, respectively.
Virus type PCR DNA primer
binding site Primer sequence
Expected fragment size
/ bp
HIV-1
1º Alu
F TCC CAG CTA CTG GGG AGG CTG AGG -
LTR R AGG CAA GCT TTA TTG AGG CTT AAG C
2º LTR
F CTG TGG ATC TAC CAC ACA CAA GGC TAC
391 LTR R GCT GCT TAT ATG TAG CAT CTG AGG GC
HIV-2
1º Alu
F TCC CAG CTA CTG GGG AGG CTG AGG
-
gag R CAT AGG GCG TGC AGC CTT C
2º gag
F GGC GGC AGG AAC AAA CCA
508
20 Table 2: PCR conditions for HIV DNA amplification. PCR conditions took into consideration the recommendations of the NZYTaq II 2× Green Master Mix (NZYTech) and the annealing temperature of each pair of primers: (*) first PCR - HIV-1 50 oC,
HIV-2 53 oC; second PCR - HIV-1 50 oC, HIV-2 62.5 oC.
RNA extraction
DC and Mϕ were seeded in 12-well plates at a density of 9 x 10⁵ cells/well. After
infection, RNA was extracted using the NZY Total RNA Isolation kit (NZYTech) following manufacturer instructions. RNA bounded to the silica membrane column was eluted and its quantity and quality was determined by measuring the 260/230 and 260/280 nm absorbance ratios using a NanoDrop™ 1000 spectrophotometer.
For microRNA experiments, Mø were seeded in 6-well plates at a density of 2 x 10⁶
cells/well. RNA was isolated and purified from infected cells using Trizol reagent (Invitrogen) following the manufacturer protocol.
Real-time polymerase chain reaction
cDNA was synthetized from cellular RNA using the NZY First-Strand cDNA Synthesis Kit (NZYTech) following the kit instructions. This cDNA was then added to the NZY qPCR Green Master Mix (2x), ROX (NZYTech) in optimized conditions (final volume of the reaction mix of 5µL: 2.5 µL of NZY qPCR Green Master Mix (2x), ROX, primers to a final concentration of 10µM, 1.5 µL cDNA, 0.5 µL nuclease-free water) following the PCR conditions of the manufacturer. Real-time PCR was performed in a QuantStudio™ 7 Flex System (ThermoFischer). Gene expression was analysed using the ΔΔCt method and glyceraldehyde 3-phosphate dehydrogenase (GAPDH) as the reference gene. Primers sequence is shown in Annex Table 1. For each condition, three biological replicates were tested. For every biological replicate, two technical replicates were performed.
The relative quantification of miRNAs in total RNA samples was performed by Exiqon (DK) miRNA qPCR services on RNA purified samples in triplicate. The specific quantification of miR-106b-5p in total RNA samples was performed in our laboratory using miRCURY LNA™ Universal RT miRNA PCR system (Exiqon) according to the manufacturer protocol and using the Exiqon LNA™ PCR primer sets: hsa-miR-106b-5p (205884), hsa-miR-23a-3p (204772), hsa-miR-23b-3p (204790), and hsa-miR-24-3p (204260). The qPCR was performed using an ABI 7300 Real Time PCR. The reaction
Cycle step Temperature
/°C Time /s Number of cycles Initial denaturation 95 120 1 Denaturation 95 30 35 Annealing * 30 Extension 72 60s/kb Final Extension 72 600 1
21 proceeded as follows: 1 cycle of 95 °C for 10 min, followed by 40 cycles of 95 °C for 10 s and 60 °C for 1 min. The miRNA expression profiles were normalized to the average obtained between miR-23a, miR-23b, and miR-24.
Transfection
Transfection of Mϕ with anti-cathepsin S siRNA or with miR-106b-5p mimics and inhibitors was performed with Biontex K2® Transfection System. Cells were incubated
for 2 h with 4 μL/mL of K2 Multiplier reagent in culture medium, then incubated for 24 h with the transfection reagent and 100 nM of SMARTpool ON-TARGETplus human CTS S siRNA or with miRIDIAN miRNA human hsa-miR-106b-5p mimics or hairpin inhibitors and the respective siRNA or miRNA non-targeting controls (GE Dharmacon) in a ratio of 5 μL reagent: 1 μg siRNA in antibiotic-free medium. Afterwards, transfection medium was removed, and the cells were incubated for 3 days in fresh medium prior to any experiment.
Western Blot
Mø were seeded in 6-well plates at a density of 2 x 10⁶ cells/well. Total proteins were
recovered with 200 μL of Laemmli buffer (Sigma-Aldrich). Protein extracts were subjected to electrophoresis in 12 % SDS-PAGE gels and were transferred from the polyacrylamide gel to a nitrocellulose membrane by wet transfer using the Mini-PROTEAN tetra electrophoresis system (Bio-Rad). The nitrocellulose membrane was blocked in Tris-buffered saline with 0.1 % Tween 20 and 5 % of bovine serum albumin (BSA). The nitrocellulose membranes were incubated with primary antibodies specific for human cathepsin S and β-tubulin (Abcam, 92780 and 6046, respectively), overnight at 4 °C. All membranes were washed and incubated with secondary HRP-conjugated antibodies (Biorad). The bands were visualized with Luminata Crescendo Western HRP substrate (Merck Millipore) and quantified using ImageJ.
Immunofluorescence
Mø were seeded in 24-well plates at a density of 3 x 10⁵ cells/well. Following the
experiments, the samples were fixed with 4 % paraformaldehyde in PBS (Gibco) for 1 h and quenched by incubating with PBS 50 mM NH4Cl. Mϕ were permeabilized with 0.1
% Triton in PBS for 5 min, washed and blocked with 1 % BSA (Merck Millipore) in PBS. Cells were stained with anti-LC3b antibody (Cell Signaling, 2775) in 1 % BSA in PBS overnight at room temperature. Following that, the cell nuclei were stained with 5 μg/ml of Hoechst dye (Thermo Scientific) for 10 min. Samples were mounted with ProLong™ Gold antifade mountant and analyzed by confocal microscopy (Leica AOBS SP5).
22 Flow cytometry
DC and Mϕ were seeded in 96-well plates at a density of 5 x 10⁴ cells/well. Following
mono or co-infected with HIV and mycobacteria, apoptosis and necrosis were measured using the PE Annexin V Apoptosis Detection Kit with 7-AAD (BioLegend). Cells were detached from the wells using Accutase (Corning), washed, incubated with annexin V and 7-AAD staining solutions as stated in the kit instructions, fixed with 4 % paraformaldehyde for 30 min.
For microRNA experiments, Mø were seeded in 24-well plates at a density of 3 x 10⁵
cells per well. Following the experiment, cells were recovered with 5 mM EDTA (Gibco)/PBS solution, fixed with 4 % paraformaldehyde for 1 h and stained for 30 min with antibodies specific for human HLA-DR (clone L243, Biolegend), CD14, CD4 (BD Biosciences), or Annexin V and propidium iodide (Immonotools, GmbH) for the quantification of apoptotic and necrotic cells.
All samples were analysed in Guava easyCyte™5HT flow cytometer.
CD4 Proliferation
Mø were seeded in 48-well plates at a density of 1.5 x 10⁵ cells/well. After 24 h of
infection with Mtb CD4 lymphocytes were added to the culture at a ratio of 5 lymphocytes per Mø. CD4 lymphocytes were recovered after 5 days of coculture and quantified using Guava easyCyte™ 5HT flow cytometer.
Mycobacteria intracellular survival
Mϕ were seeded in 96-well plates at a density of 5 x 10⁴ cells/well and infected with
Mtb as previously described. After 3 h, 1, 3 and 5 days of infection Mϕ were lysed in 0,05 % Igepal (Sigma). Serial dilutions of the resulting bacterial suspensions were plated in Middlebrook 7H10 with 10 % OADC (Difco) and incubated for 2–3 weeks at 37 °C before colonies were observable.
Statistical Analysis
Data is presented as mean with the respective standard deviation or standard error (referred when used). Statistical analysis was performed with SigmaPlot 11. Multiple comparisons were made using one-way ANOVA followed by pairwise comparisons of the groups using Holm-Sidak test. Two group comparisons were made using Student’s t-test. The considered nominal alpha criterion level was 0.05 below which differences between samples were deemed significant (*p<0.05; **p<0.01; ***p<0.001; # p=0.001).
23
Results
1. Characterization of the infection
To study HIV Mtb co-infection, it was established an experimental model that would resemble a sequence of events in which dendritic cells (DC) and macrophages (Mϕ) of an HIV-infected individual would be infected with Mtb. For that, cells were firstly challenged with HIV for 24 h, then with Mtb for 3h and were analysed 48 h after mycobacterium internalization into cells. This allowed time for the HIV infection to establish and then for the Mtb infection to produce visible results in gene manipulation. Besides HIV-1 Mtb infection model it was also established a HIV-2 Mtb co-infection model. Individuals infected by HIV-2 typically display low viral loads and slower progression of the infection to AIDS comparatively to HIV-1 infected patients. Thus, HIV-2 is considered a less virulent model of HIV infection 83.
DC and Mϕ are not the primary replication niches of HIV and are also viral reservoirs therefore we used HIV-1 92US660 and HIV-2 Cas.04 (clinical isolates), which are non-replicative virus in these phagocytes, to mimic viral latency in these cells. Mycobacterium smegmatis (Msm) was used as control, since cells infected by this species efficiently eliminate infection.
Since the main objective is to study the impact of HIV and Mtb co-infection on DC and Mϕ cathepsin and cystatin gene expression, the co-infection model was characterized. It was determined if the infection had been established, the HIV and Mtb burden and the impact of each infection in cell viability at the time of gene expression analysis.
HIV is a retrovirus and since one of the steps of its replication cycle is the integration of the viral DNA in the host genome, viral infection was confirmed by nested polymerase chain reaction (PCR). The first PCR amplifies a region comprising an Alu sequence and the viral LTR or the gag gene. From the product of this reaction, a second PCR amplifies HIV-specific nucleotide sequence, for HIV-1 the viral LTR and for HIV-2 the gag gene.
24 To detect viral integration at the time of gene expression evaluation, DC and Mϕ were infected with HIV-1 or HIV-2 for 24 h. DNA extraction was performed after an additional 48 h and amplification products from nested PCR were visualized by electrophoresis with ethidium bromide. Integration of HIV-1 genome is confirmed by the appearance of a band with 391 base pairs corresponding to the LTR region. HIV-2 integration is confirmed by a band with 508 base pairs corresponding to a region of the gag gene. Peripheral blood mononuclear cells (PBMC) were used as positive controls since these cells are productively infected with both HIV-1 and HIV-2.
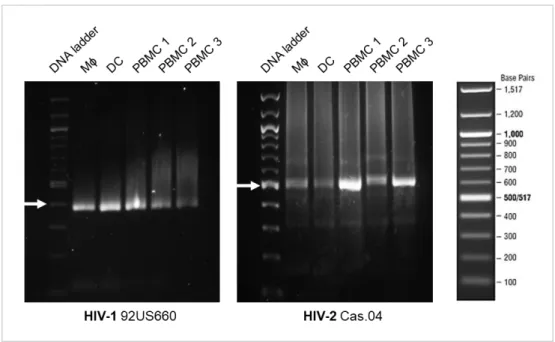
Figure 1: HIV-1 and HIV-2 integrate in the host cell genome. PBMCs, DC and Mϕ were infected with HIV-1 or HIV-2 for 24 h and DNA extraction was performed 72 h postinfection. For all samples, viral integration was determined from a template of 50 ng of DNA. Amplification of HIV-1 (92US660) LTR and HIV-2 (Cas.04) gag gene leads to the formation of an amplicon with 391 base pairs (bp) and 508 bp, respectively. The DNA ladder (New England Biolabs) is shown in the right side of the figure. White arrows indicate the DNA ladder band with the closest bp size of the amplicon: 400 bp for HIV-1 and 500 bp for HIV-2. PBMCs 1, 2 and 3 are biological replicates.
As seen in Figure 1, a band with less than 400 bp is detected in Mϕ, DC and PBMC infected with HIV-1 and a band with around 500 bp is detected in all these cell types when infected with HIV-2. These bands result from the amplification of the viral LTR and the gag gene and allow to conclude that these cells were infected with HIV and that viral integration occurred. It is also observed a difference in the intensity of the bands. For HIV-1 infected Mϕ, DC and PBMC 1, the band intensity is similar and higher than for PBMC 2 and 3. For HIV-2 infection, PBMC 1 and 3 bands have higher intensity
25 comparatively to the remaining samples and PBMC 2 as a higher intensity than Mϕ and DC.
During HIV replication cycle the viral RNA is retrotranscribed to double stranded DNA and integrated in the host cell genome. This is achieved by the activity of the reverse transcriptase (RT) enzyme. By measuring the activity of this enzyme in cellular supernatant, it can be inferred if the virus is propagating within cells since RT production is also associated with virions. HIV-1 92US660 and HIV-2 Cas.04 were previously shown by our lab team to be non-replicative virus in both Mϕ and DC (un-published results), so viral replication was measured not only to confirm these results during mono-infection but also to infer if the mycobacterium infection would alter HIV replication.
Mϕ and DC were infected as previously described for viral integration. Cell supernatant was collected 48 h after mycobacteria infection and RT activity was measured by enzyme-linked immunoassay. This supernatant was collected from the same cells for which the gene expression of cathepsins and cystatins was measured.
HIV-1 and HIV-2 mono-infections of Mϕ and DC didn’t show any RT activity comparatively to infected PBMCs, which was in accordance with the previous results from our team. During co-infection with mycobacteria, RT activity was not detected (Annex Table 2). Thus, infection of DC and Mϕ with HIV-1 92US660 and HIV-2 Cas.04 is non-productive both in viral mono-infections and co-infections with Msm or Mtb.
As to determine mycobacteria burden at the time of cathepsins and cystatins gene expression measurement, DC and Mϕ were mono- and co-infected with HIV-1 or HIV-2 and Mycobacterium spp strains expressing a GFP plasmid, Msm-GFP or Mtb-GPF. The percentage of GFP positive cells was measured by flow cytometry 48 h after bacteria internalization.
When comparing both cells types, Mϕ have a higher burden in all infections comparatively to DC, and within the same cell type it is observed that Msm mono- and co-infections have a lower bacterial burden than Mtb infections (Figure 2).
Among infections and for DC and Mϕ, the lowest percentage of Mycobacterium spp infected cells is displayed during Msm mono-infection, while the highest is observed during Mtb mono-infections. In both cell types, Msm co-infections have a higher percentage of bacteria infected cells comparatively to mono-infection, whereas
26 Mtb co-infections have a lower percentage in comparison with Mtb mono-infection (Figure 2).
Figure 2: Continued A
27 Figure 2: Percentage of mycobacteria infected dendritic cells (A) and macrophages (B). Cells were mono-infected with Msm-GFP or Mtb-GFP or co-infected with HIV. Mycobacteria burden was determined 48 h after bacterial infection by flow cytometry and results were analysed using FlowJo®, LCC. Graphs depict the most
representative sample for each condition. Non-infected control cells are shown in grey while cells cultivated with the pathogens are shown in green. The gate represents the infected cells and above it is depicted the average percentage of infection (n = 3). The dashed line marks the mean fluorescence intensity for subpopulation of infected cells.
28 Apoptosis was measured to infer the impact of the experimental procedures on the cells and to determine the effect of each infection in cell viability at the time of cathepsin and cystatin gene expression measurement. DC and Mϕ were mono- and co-infected as before and stained for annexin V and with 7-AAD 48 h after bacterial infection. Annexin V is expressed at the surface of apoptotic cells while 7-AAD binds to the DNA of late apoptotic cells and necrotic cells. The percentage of apoptotic and necrotic cells was measured by flow cytometry.
From the results it can be observed that DC are mainly in an early apoptotic state, with necrotic cells accounting for less than 1 % of the total cell population. HIV infection increases the percentage of late apoptotic cells and reduces the percentage of early apoptotic cells comparatively to bacterial infections (Annex Figure 2).
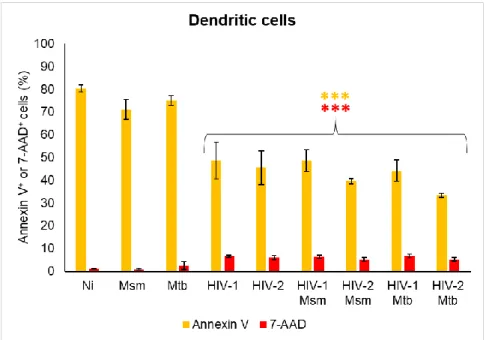
Figure 3: Cell death of dendritic cells mono-infected and co-infected with mycobacteria and virus. DC were infected with HIV-1/HIV-2 and/or Msm/Mtb and stained for annexin V and 7-AAD 48 h after mycobacteria infection. Results were obtained by flow cytometry and are the average of biologic triplicates for each condition. Annexin V and 7-AAD results are shown in yellow and red bars, respectively, being the significance relative to non-infected cells (Ni) (***p <0.001).
In all infections the percentage of annexin V+ cells is lower while the percentage
of 7-AAD+ cells is higher than the displayed by non-infected cells (***p<0.001), except
29 Msm and Mtb mono-infections, the remaining infections have a lower percentage of early apoptotic cells and a higher percentage of late apoptotic cells than Ni cells (Annex Figure 2).
Both HIV mono-infections display the same percentage of annexin V and 7-AAD positive cells, leading to the same level of apoptosis and necrosis. In contrast, no differences in apoptosis are shown between mycobacterium mono-infection. However, Mtb mono-infection of DC has a higher percentage of 7-AAD+ cells (*p<0.05) and so
has more cells in a late apoptotic or necrotic state.
Between these two classes of pathogens, Mycobacterium spp mono-infections display a higher level of annexin V+ cells, mainly caused by higher percentage of early
apoptotic cells, while viral mono-infections have a higher level of 7-AAD+ cells
(***p<0.001), due to increased levels of late apoptotic cells (Figure 3 and Annex Figure 2).
Among DC infections, Mtb mono-infection has the lowest percentage of live cells. Non-infected cells have the highest level of annexin V staining and the highest percentage of early apoptotic cells among all conditions (Figure 3 and Annex Figure 1).
No differences in apoptotic and necrotic cells between viral mono-infection and co-infections are observed, except for the percentage of annexin V+ cell in HIV-2 Mtb
co-infection (*p<0.05) (Figure 3 and Annex Figure 2). In contrast, co-infection leads to a lower percentage of annexin V+ and a higher percentage of 7-AAD+ cells than
mycobacteria mono-infections (***p<0.001). Thus, the level of apoptotic and necrotic cells during co-infections is more similar to HIV mono-infections than mycobacteria mono-infections.
Between co-infections, HIV-1 Mtb co-infection induces higher levels of annexin V+ and 7-AAD+ cells than HIV-2 Mtb co-infection, (*p<0.05) (Figure 3 and Annex Figure
2).
Infected Mϕ are mainly in an early apoptotic state, with necrosis still being detected in less than 1 % of all infected cells. For viral infections it is observed an increase in the percentage of late apoptotic cell and a reduction of live cells comparatively to mycobacterium mono-infections (Annex Figure 3).
30 For all Mϕ infections, the percentage of annexin V+ and 7-AAD+ cells is higher
than non-infected cells (***p<0.001), except for Msm and Mtb mono-infections in 7-AAD staining (Figure 4 and Annex Figure 1).
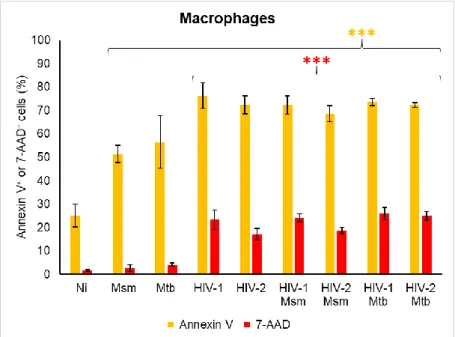
Figure 4: Cell death of macrophages mono-infected or co-infected with mycobacteria and virus. Mϕ were infected with HIV-1/HIV-2 and/or Msm/Mtb and stained for annexin V and 7-AAD 48 h after mycobacteria infection. Results were obtained by flow cytometry and are the average of biologic triplicates for each condition. Annexin V and 7-AAD results are shown in yellow and red bars, respectively, being the significance relative to non-infected cells (Ni) (***p <0.001).
Non-infected cells and Msm mono-infection present the highest percentage of live cells among all conditions and Mϕ infections, respectively (Figure 4 and Annex Figure 3).
Both bacterial species mono-infections lead to the same percentage of apoptotic and necrotic cells while HIV-1 mono-infection of Mϕ leads to a higher percentage 7-AAD+ cells than HIV-2 (***p=0.001) and no differences in annexin V+
percentage.
HIV-1 and HIV-2 mono-infections present a higher percentage of annexin V+
and 7-AAD+ cells than mycobacterium mono-infections (***p<0.001) (Figure 4 and
Annex Figure 3). Thus, viral mono-infections lead to a higher percentage of cell death than mycobacterium mono-infections.
31 Co-infections have a higher percentage of annexin V+ and 7-AAD+ cells
(**p<0.01) than mycobacterium mono-infections of Mϕ (Figure 4). In contrast, only HIV-2 Mtb co-infection has a higher level of 7-AAD+ cells than HIV-2 mono-infection
(***p<0.001), while for the remaining co-infection and the annexin V staining there is no difference. As seen for DC, co-infections resemble more closely to HIV infections in terms of cell death.
Among Mϕ co-infections, HIV-2 Msm has a lower percentage of apoptotic and necrotic cells than HIV-2 Mtb co-infections (***p=0.001) and HIV-1 Msm has lower percentage of 7-AAD+ cells than HIV-2 Msm co-infections (**p<0.01) (Figure 4).
32 2. Gene expression profile of cathepsins and cystatins in macrophages and
dendritic cells
To elucidate the effect of mycobacteria and HIV in the gene expression of cathepsins and cystatins during co-infection it is useful to know how these pathogens regulate these proteins during mono-infection. This was already studied for Msm and Mtb mono-infections in Mϕ but not in DC 84 and for HIV-1 and HIV-2 mono-infections
this type of gene expression screen was not yet performed.
Monocyte-derived Mϕ and DC were infected with HIV-1 or HIV-2 (1 ng of reverse transcriptase per 9 x 10⁵ cells) for 24 h and with Msm or Mtb (MOI 1) for 3 h.
All samples were subjected to the same procedure and cathepsin and cystatin gene expression was measured 48 h after mycobacteria infection (Figure 5).
Figure 5: Gene expression of cathepsins (CTS) and cystatins (CST) in dendritic cells and macrophages infected with Msm, Mtb, HIV-1 and/or HIV-2. mRNA levels were quantified by real-time reverse transcriptase PCR 48 h after mycobacterium infection. Values of gene expression are depicted in a heatmap (MeV, MultiExpreriment Viewer) and represented as log2 relatively to non-infected cells (Ni).