Vol.61: e18160159, 2018
http://dx.doi.org/10.1590/1678-4324-2018160159 ISSN 1678-4324 Online Edition
BRAZILIAN ARCHIVES OF BIOLOGY AND TECHNOLOGY
A N I N T E R N A T I O N A L J O U R N A L
Modelling the growth of lactic acid bacteria at
different temperatures
Ana Paula Rosa da Silva
1, Daniel Angelo Longhi
1,2, Francieli Dalcanton
3, Gláucia Maria
Falcão de Aragão
1*,
1Universidade Federal de Santa Catarina – Departamento de Engenharia Química e Engenharia de Alimentos, Florianópolis, Santa Catarina, Brasil, 2Universidade Federal do Paraná – Campus Jandaia do Sul, Jandaia do Sul, Paraná Brasil; 3Univerisidade Comunitária da Região de Chapecó – Área de Ciências Exatas e Ambientais, Chapecó, Santa Catariana, Brasil.
ABSTRACT
Mathematical models are widely used to predict the shelf life of foods. Lactic acid bacteria (LAB), particularly Lactobacillus plantarum, Weissella viridescens and Lactobacillus sakei, are the main spoilage bacteria of refrigerated, vacuum-packed meat products, stored in modified atmosphere, and their growth determines the shelf life length of these products. The objective of this study was to model the growth of L. plantarum, W. viridescens and L. sakei under different isothermal cultivation conditions and establish secondary models to describe the effect of temperature on the growth parameters of these bacteria. The LAB growth was evaluated in culture medium at temperatures of 4, 8, 12, 16, 20 and 30 ºC. The fit of Baranyi and Roberts (BAR) and Gompertz (GO) primary models to the growth curves of LAB was compared by statistical indices, in which the BAR model showed slightly better fits to the experimental data. The BAR growth parameters were used to establish the secondary models, µmax and Nmax were established for the three LAB. The power model described the influence of temperature on the parameter λ for L. plantarum, and other bacteria showed no lag phase. The growth of LAB was strongly influenced by storage temperature and the obtained models allow predicting the growth of these bacteria within the temperature range from 4 to 30 ºC.
Key words: predictive microbiology, shelf life, bacterial spoilage.
INTRODUCTION
Lactic acid bacteria (LAB) are considered the main microorganisms responsible for spoilage of vacuum-packed meat products stored under refrigerated conditions1,2, and
some bacteria of the genus Lactobacillus are found naturally on meat and meat products, e.g. Lactobacillus sakei, Weissella viridescens, Lactobacillus plantarum and
Lactobacillus curvatus 3,4. The deterioration caused by the LAB is related to the
production of metabolites that cause undesirable changes in appearance, texture and flavor of the food, producing unpleasant odors and flavors, besides producing slime on the products’ surface5,6,7.
Meat products have an initial concentration of LAB normally around 10 CFU/g and this concentration often reaches a population of 108 to 109 CFU/g in the stationary phase
of bacterial growth, exceeding the microbiological limit to the end of the shelf life of refrigerated meat, which is 107 CFU/g1,8. Mathematical modeling can be used to predict
the effect of different combinations of time and temperature on the shelf life of meat products. The modeling of microbial growth in culture medium introduces factors that can be controlled more easily than food matrices9.
Changes in pH may also be associated with spoilage of meat products. The lactic acid produced by LAB during growth can reduce the pH of the medium where bacteria are growing. Manios et al.10 found, by means of high performance liquid chromatography
analysis that lactic acid production is primarily responsible for the increased acidity of acid emulsions containing pepper, eggplant and fava beans, caused by L. plantarum and L. brevis.
There is a large amount and variety of predictive models that can describe isothermal microbial growth curves11,12. Two of the several types of models used are the model of
Gompertz13 and the model of Baranyi and Roberts14. These primary models are
currently applied often in assessing the growth of different microorganisms2,15,16,17.
Secondary models describe microbial behavior according to the variation of intrinsic and extrinsic factors. The influence of temperature on the microbial growth of LAB can be described by some of these models, e.g. linear equation, square root equation18,
Arrhenius equation, power equation and exponential equation.
The objective of this study was to model the growth of L. plantarum, W. viridescens and L. sakei under isothermal cultivation conditions and establish secondary models describing the effect of temperature on growth parameters: duration of the lag phase (λ), maximum specific growth rate (µmax), maximum bacterial population (Nmax) and
time to reach 107 CFU/mL (t
7), while considering the concentration of LAB that defines
the shelf life of meat products.
MATERIAL AND METHODS
Bacteria
The strains of Lactobacillus plantarum (CCT 0580 ATCC 8014), Weissella viridescens (CCT 5843 ATCC 12706) and Lactobacillus sakei (CCT 5841 ATCC 15521) were purchased from André Tosello Foundation of Tropical Cultures (Campinas, Brazil) and stored in polypropylene tubes at the temperature of -24 °C in MRS broth (Man, Rogosa and Sharpe) (Difco, Le Pont de Claix, France) containing 20 % (v/v) glycerol for later use.
Inoculum Preparation
performed, the three LAB had the maximum cell concentration of 109 CFU/mL, after
incubation for 18 h, which was then treated as the inoculum condition for the other experiments.
Growth Conditions
The experiments with pure LAB cultures were carried out in 250 mL flasks with a volume of 160 mL MRS broth and 1% (v/v) inoculum. The initial concentration of experiments was approximately 103 CFU/mL and initial pH was 6.0 (pH meter V620,
Analion, Ribeirão Preto, Brazil). The flasks were incubated at six different temperatures: 4, 8, 12, 16, 20 and 30 ºC, and growth curves were observed until the stationary phase. This procedure was performed for each of the LAB. The experiments were repeated on different days, thus generating duplicate experiments, and each experiment was carried out daily with duplicate Erlenmeyer flasks. The incubation temperature was recorded by a data logger (Testo 174, Lenzkirch, Germany) with records generated every 5 minutes.
The increase in cell concentration was monitored by counting viable cells by the plating method as described above, and also by measuring absorbance (abs) in a spectrophotometer (Bel Photonics 1105, Monza, Italy) at a wavelength of 600 nm, at predetermined time intervals, depending on the temperature of incubation. As soon as
abs measurement began to detect growth, plating was no longer performed on the samples, and a correlation model was used for each LAB, as described below. pH was monitored for each LAB at the six temperatures.
Correlation Model
Equations (1), (2) and (3) represent the correlations between viable cell count (N) and absorbance measurements (abs), as previously defined, with R2 values of 0.936, 0.949 and 0.935 for L. plantarum, W. viridescens and L. sakei, respectively.
ln 𝑁 = 1.715(ln 𝑎𝑏𝑠) + 18.82 (1)
ln 𝑁 = 1.274(ln 𝑎𝑏𝑠) + 20.08 (2)
ln 𝑁 = 1.478(ln 𝑎𝑏𝑠) + 19.79 (3)
Primary Growth Models
The primary models of Baranyi and Roberts (BAR) and Gompertz (GO) were selected to describe the growth of LAB at the six incubation temperatures.
The primary model of Baranyi and Roberts14 is shown in Equations (4) and (5), in which
ln N(t) is the natural logarithm of viable cell count [CFU/mL] at time t, A(t) is an adjustment function, and the growth parameters are maximum specific growth rate (µmax [1/h]), initial and maximum bacterial population (N0 [CFU/mL] and Nmax
[CFU/mL], respectively), and physiological state of cells (h0). The duration of the lag
phase (λ [h]) can be obtained by Equation (6).
In(N(t)) = In(𝑁0) + 𝜇𝑚𝑎𝑥𝐴(𝑡) − ln (1 + ℯ
μmaxt− 1
ℯ(𝑙𝑛(𝑁𝑚𝑎𝑥)−ln(𝑁0))) (4)
𝐴(𝑡) = 𝑡 +𝜇1
𝑚𝑎𝑥ln (ℯ
𝜆 = ℎ0
𝜇𝑚𝑎𝑥 (6)
The primary model of Gompertz13 is shown in Equation (7), in which ln N(t) is the
natural logarithm of viable cell count [CFU/mL] at time t, C is an empirical parameter equivalent to the natural logarithm of initial microbial count, A is the logarithmic amplitude of the population growth, B is the relative maximum growth rate at time M [1/h] and M is the time required to achieve maximum growth rate [h]. The maximum specific growth rate (µmax) and duration of the lag phase (λ) can be obtained by
Equations (8) and (9).
ln(𝑁(𝑡)) = C + Aexp{−exp[−𝐵(𝑡 − 𝑀)]} (7)
𝜇𝑚𝑎𝑥=𝐴𝐵ℯ (8)
𝜆 = 𝑀 −𝐵1 (9)
Primary models were fitted to the experimental data using the software MATLAB R2010a, version 7.10 (Mathworks, Natick, USA).
Secondary Models
Five mathematical equations were assessed as secondary models: linear equation, square root equation, Arrhenius equation, power equation and exponential equation, shown in Equations (10) to (14), respectively. All these secondary models are able to describe the dependence of model parameters up to the optimum growth rate (sub-optimal temperature range). In these equations, p is the parameter of interest to be modeled (λ, µmax, Nmax or t7 (time to reach 107 log CFU/mL), T is the temperature (ºC),
Tmin is the theoretical minimal temperature for microbial growth (ºC), a and b are
empirical parameters.
Secondary models were fitted to the data using the software MATLAB R2010a, version 7.10(Mathworks, Natick, USA)
𝑝 = 𝑏 + 𝑎𝑇 (10)
√𝑝 = 𝑏(𝑇 − 𝑇𝑚𝑖𝑛) (11)
(12)
𝑝 = 𝑏𝑇𝑎 (13)
𝑝 = 𝑎exp(𝑏𝑇) (14)
Statistical Comparison of the Models
RESULTS AND DISCUSSION
Primary Models
According to the analysis of statistical indices (MSE, R2and accuracy factor), the two primary models assessed (BAR and GO) presented a good fit to the growth curves of the bacterial species. For L. plantarum, MSE values ranged from 0.073 to 0.286 and from 0.152 to 0.296; R2values ranged from 0.983 to 0.998 and from 0.980 to 0.995, and the values of the accuracy factor ranged from 1.012 to 1.030 and from 1.019 to 1.034 for the models of BAR and GO, respectively. For W. viridescens, MSE values ranged from 0.109 to 0.218 and from 0.050 to 0.207; R2 values ranged from 0.995 to 0.997 and from 0.992 to 0.998, and the values of the accuracy factor ranged from 1.012 to 1.023 and from 1.010 to 1.021 for the models of BAR and GO, respectively. For L.
sakei, MSE values ranged from 0.070 to 0.443 and from 0.091 to 0.411; R2 values ranged from 0.986 to 0.997 and from 0.987 to 0.997, and the values of the accuracy
factor ranged from 1.011 to 1.026 and from 1.010 to 1.025 for the models of BAR and GO,respectively.
The values of statistical indices of the BAR model for L. plantarum, W. viridescens and
L. sakei were slightly better than the values of the GO model, as previously observed20.
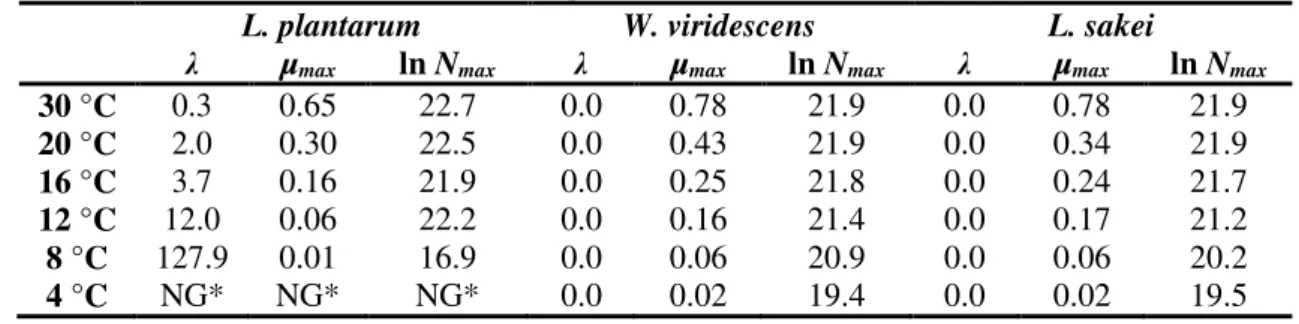
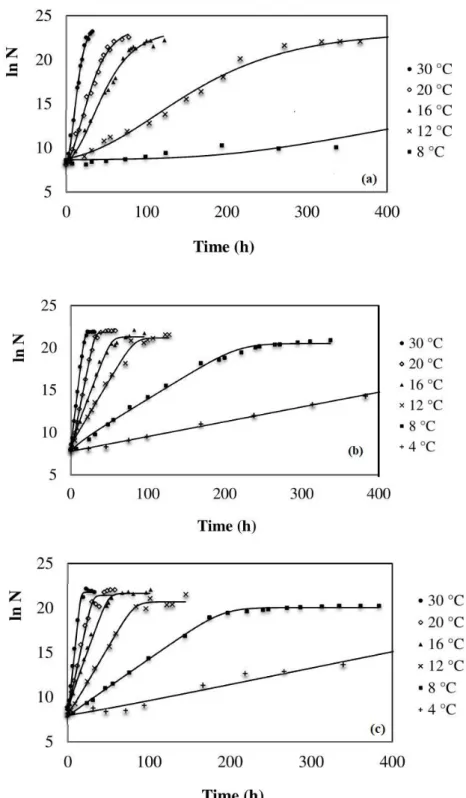
Thus, the BAR model was chosen to define the growth parameters of the three LAB (Table 1) and to obtain the secondary models. Figure 1 shows the fits of BAR model to the growth curves. For ease of viewing, each temperature was represented by only one curve for each experiment.
Table 1. Growth parameters µmax (1/h),λ(h) and ln Nmaxobtained by fitting the BAR model for L. plantarum, W. viridescens and L. sakei at different cultivation temperatures
L. plantarum W. viridescens L. sakei
λ µmax ln Nmax λ µmax ln Nmax λ µmax ln Nmax
30 °C 0.3 0.65 22.7 0.0 0.78 21.9 0.0 0.78 21.9
20 °C 2.0 0.30 22.5 0.0 0.43 21.9 0.0 0.34 21.9
16 °C 3.7 0.16 21.9 0.0 0.25 21.8 0.0 0.24 21.7
12 °C 12.0 0.06 22.2 0.0 0.16 21.4 0.0 0.17 21.2
8 °C 127.9 0.01 16.9 0.0 0.06 20.9 0.0 0.06 20.2
4 °C NG* NG* NG* 0.0 0.02 19.4 0.0 0.02 19.5
*NG = no growth
Duration of the lag phase and maximum specific growth rate are strongly influenced by temperature of incubation (Table 1 and Figure 1). With decreasing temperature, there is an increase of lag phase only for L. plantarum. The other two bacteria did not show adaptation phase in any of the tested temperatures.There was a decrease in the maximum specific growth rate with the decrease in the incubation temperature. This trend was observed by other authors, who also found that growth parameters of LAB are influenced by varying the growth temperature1,2,21.
There was no growth of L. plantarum at 4 °C (Table 1). Dalcanton21 also found that L.
plantarum showed no growth at 4 °C for six months, when evaluating the combined effect of temperature, pH, sodium chloride and sodium lactate in the growth of this LAB. Manios et al.10 studied the spoilage of acidic emulsified spreads containing
pepper, eggplant and fava beans, caused by L. plantarum and L. brevis, and they observed that the LAB showed no growth in the emulsions at 4 °C.
The most important parameters for the analysis of shelf life of meat products are lag phase and maximum specific growth rate22. However, control of maximum population
can also lead to increased shelf life of the contaminated products. Cayré et al.23, when
phase in the growth curves fitted by the modified Gompertz model. Geitenes et al. 22
noted the absence of the lag phase while modeling the growth of LAB in sliced cooked and vacuum packaged ham and formed ham samples at 5 °C. The curves were fitted by the modified Gompertz and Logistic models, and the samples already had high counts on the first day of shelf life.
The results in Table 1 and Figure 1 show that it is crucial to maintain incubation temperatures below 8 °C to reduce the growth of LAB. The values of the maximum population at 4 and 8 °C were lower when compared with the other incubation temperatures. This shows that the increase in temperature directly influences the growth of LAB. As meat products are typically stored in a temperature range between 4 °C and 10 °C, it is strongly recommendable that this variable has to be controlled. The increase in the incubation temperature from 8 to 12 °C increases the maximum specific growth rate of LAB by more than 77 %, 60 % and 64 % for L. plantarum, W. viridescens and
L. sakei, respectively. These small increases in temperature (ranging from 4 °C to 30 °C) cause changes in all growth parameters, as shown in Figure 1. Thus, in order to control the development and multiplication of spoilage bacteria, such as LAB in meat products that are vacuum-packaged or stored in modified atmosphere, it is crucial to control the temperature in the cold chain.
Secondary Models
The influence of incubation temperature (4 to 30 °C) on growth parameters, obtained by fitting the BAR model, was described by comparing (R2) of the fits of the Linear, Square Root, Arrhenius, Power and Exponential equations to the experimental data. Table 2 shows the secondary models that best described such influence for all three bacteria.
Table 2. Equations of secondary models that best described the influence of temperature on the growth parameters µmax(1/h),λ(h), Nmax(CFU/mL)and t7 (hours) of L. plantarum, W. viridescens and L. sakei.
Microorganism Parameter Equation R2 Model
L. plantarum
λ 𝜆 = 106(𝑇−4.517) 0.989 Power
µmax √𝜇𝑚𝑎𝑥 = 0.031𝑇 − 0.127 0.992 Square root
Nmax In 𝑁𝑚𝑎𝑥= −3.166 (1
𝑇) + 3.273 0.786 Arrhenius
t7 𝑡7 = 285,335(𝑇−3.023) 0.975 Power
W. viridescens
µmax √𝜇𝑚𝑎𝑥 = 0.028𝑇 + 0.038 0.993 Square root
Nmax In 𝑁𝑚𝑎𝑥= −0.591 (1
𝑇) + 3.112 0.991 Arrhenius
t7 𝑡7 = 9,502(𝑇−2.021) 0.989 Power
L. sakei
µmax √𝜇𝑚𝑎𝑥 = 0.028𝑇 + 0.037 0.993 Square root
Nmax In 𝑁𝑚𝑎𝑥= −0.581 (1
𝑇) + 3.105 0.923 Arrhenius
t7 𝑡7 = 6,159(𝑇−1.864) 0.990 Power
The equations fitted well to the data, resulting in good determination coefficients, as can be seen in Table 2. The growth parameters of L. plantarum, W. viridescens and L.
sakei can be predicted using the equations in Table 2 within the temperature range considered in this study (4 °C to 30 °C).
The parameters of microbial growth (duration of the lag phase and maximum specific growth rate) are associated with the shelf life of foods16,24,25. Any change in these
determining shelf life, or in determining the time needed to reach the LAB concentration of 107 CFU/mL (t
7).
The microbiological limit for LAB that has been verified as the end of the shelf life of refrigerated meat products (depending on the organism, the food, and the individual preferences of the consumer) is 107 CFU/g 1,4. The time needed to reach the LAB
concentration of 107 CFU/mL (t
7) estimated by the BAR model to the growth curves of
L. plantarum, W. viridescens and L. sakei are shown in Table 3. According to the analysis of the values obtained for the t7 of each LAB, the abuse of temperature
contributes to the development and proliferation of LAB, which are the major spoilage bacteria of meat and meat products that are vacuum-packed or stored in modified atmosphere. Again, these results show ones that it is strongly recommendable the control of refrigeration temperature.
Table 3. Time (in hours) needed to reach the LAB concentration of 107 CFU/mL estimated by the BAR model to the
growth curves of L. plantarum, W. viridescens and L. sakei.
L. plantarum W. viridescens L. sakei
30 °C 13 12 13
20 °C 27 22 21
16 °C 53 31 31
12 °C 140 51 53
8 °C 673 144 146
4 °C NG* 653 476
*NG = no growth
Spoilage of meat products is analyzed by comparing sensory evaluation with microbial growth. Foods often reach the end of shelf life (7 log CFU/g) showing strong signs of sensory spoilage26. Dalcanton et al.4 observed delayed sensory changes of
vacuum-packed chopped cooked pork for the three incubation temperatures (4, 10 and 16 ºC). They found that spoilage progresses slowly and starts when the cell concentration of L.
plantarum is above 7 log CFU/g for incubation temperatures of 10 and 16 ºC, because at the temperature of 4 °C, the maximum population attained was 5.25 log CFU/g.
pH of LAB
In Figure 2, there was a decrease in pH values, i.e., an increase of lactic acid concentration when the cell concentration of L. plantarum reached values of 7 log CFU/mL for the temperatures of 30, 20, 16 and 12 ºC, and for 8 °C, cell concentration was 6 log CFU/mL. For W. viridescens and L. sakei, pH values started to decrease when cell concentration reached values of 8 log CFU/mL.
These differences between decrease in pH and cell concentration reached by LAB are because these bacteria belong to different species, thus producing different results. Similar resultswere also observed by Ruiz-Capillas et al.27 and Kreyenschmidt et al.28,
who found that pH remains constant until the cell concentration of LAB reaches values of approximately 7 log CFU/g. However, in the studies of Vasilopoulos et al.29 and
Mataragas et al.30, pH values decreased when the cell concentration of the LAB was 6
log CFU/g and 8 log CFU/g, respectively.
Figure 2. Monitoring of pH changes during growth of (a) L. plantarum, (b) W. viridescens and (c) L. sakei atdifferent incubation temperatures.
CONCLUSION
The both primary models of Baranyi and Roberts and Gompertz showed good fits to the growth curves of L. plantarum, W. viridescens and L. sakei, in which the model of Baranyi and Roberts performed slightlybetter description of the experimental data than the model of Gompertz.
As seen in this study, the abuse of temperature or the temperature fluctuations that can happen along the cold chain can strongly influence the growth of LAB and, consequently, the shelf life of meat products in which LAB are present.
ACKNOWLEDGEMENTS
The researchers thank the Graduate Program in Food Engineering of the Federal University of Santa Catarina (UFSC) and CAPES-Brazil for their financial support.
REFERENCES
1. Slongo AP, Rosenthal A, Camargo LMQ, Deliza R, Mathias SP, Aragão GMF. Modeling the growth of lactic acid bacteria in sliced ham processed by high hydrostatic pressure. LWT - Food Sci Technol. 2009; 42: 303-306.
2. Li MY, Sun XM, Zhao GM, Huang XQ, Zhang JW, Tian W, Zhang QH. Comparison of mathematical models of lactic acid bacteria growth in vacuum-packaged raw beef stored at different temperatures. J FoodSci. 2013; 78: 600-604. 3. Doulgeraki AI, Ercolini D, Villani F, Nychas GJE. Spoilage microbiota associated to the storage of raw meat in different conditions. Int J Food Microbiol. 2012; 157: 130-141.
4. Dalcanton F, Perez-Rodriguez F, Posada-Izquierdo GD, Aragão GMF, García-Gimeno RM. Modelling growth of L.plantarum and shelf life of vacuum-packaged cooked chopped pork at different temperatures. Int J Food Sci Tech. 2013; 48: 2580-2587.
5. Cayré ME, Vignolo G, Garro O. Modeling lactic acid bacteria growth in vacuum-packaged cooked meat emulsions stored at three temperatures. Food Microbiol. 2003; 20: 561-566.
6. Nychas G-JE, Skandamis PN, Tassou CC, Koutsoumanis KP. Meat spoilage during distribution. Meat Sci. 2008; 78, 77-89.
7. Samelis J, Kakouri A, Rementzis J. Selective Effect of the product type and the packaging conditions on the species of lactic acid bacteria dominating the spoilage microbial association of cooked meats at 41 °C. Food Microbiol. 2000; 17, 329-340.
8. Koutsoumanis KP, Stamatiou AP, Drosinos EH, Nychas GJE. Control of spoilage microorganisms in minced pork by a self-developed modified atmosphere induced by the respiratory activity of meat microflora. Food Microbiol. 2008; 25: 915-921. 9. Giannuzzi L, Pinotti A, Zaritzky N. Mathematical modeling of microbial growth in packaged refrigerated beef at different temperature. Int J Food Microbiol. 1998; 39: 101-110.
10. Manios SG, Lambert RJW, Skandamis PN. A generic model for spoilage of acidic emulsified foods: Combining physicochemical data, diversity and levels of specific spoilage organisms. Int J FoodMicrobiol. 2014; 170: 1-11.
11. McKellar RC, Lu X. Primary models. In: McKellar RC, Lu X. Modeling Microbial Response in Food. Boca Raton, Florida: CRC PRESS; 2004. p. 33-74.
12. Legan JD. Application of models and other quantitative microbiology tools in predictive microbiology. In: Brul S, Van Gerwen S, Zwietering M. Modelling microorganisms in Food. Cambridge: Woodhead Publishing; 2007. p. 82-109. 13. Gibson AM, Bratchell N, Roberts TA. The effect of sodium chloride and
temperature on rate and extent of growth of Clostridium botulinum type A in pasteurized pork slurry. J Appl Bacteriol. 1987; 62: 479-490.
14. Baranyi J, Roberts TA. A dynamic approach to predicting bacterial growth in food.
15. Lobacz A, Kowalik J, Tarczynska A. Modeling the growth of Listeria
monocytogenes in mold-ripened cheeses. J Dairy Sci. 2013; 96: 3449-3460. 16. Longhi DA, Dalcanton F, Aragão GMF, Carciofi BAM, Laurindo JB. Assessing
the prediction ability of different mathematical models for the growth of
Lactobacillus plantarum under non-isothermal conditions. J Theor Biol. 2013; 335: 88-96.
17. Weng PF, Wu ZF, Lei LL. Predictive models for growth of Leuconostoc citreum and its dynamics in pickled vegetables with low salinity. J Food Proc Eng. 2013; 36: 284-291.
18. Ratkowsky DA, Olley J, McMeekin TA, Ball A. Relationship between temperature and growth rate of bacterial cultures. J Bacteriol. 1982; 149: 1-5.
19. Ross T. Indices for performance evaluation of predictive models in food microbiology. J Appl Bacteriol. 1996; 81: 501-508.
20. Baty F, Delignette-Muller ML. Estimating the bacterial lag time: which model, which precision. Int J Food Microbiol. 2004; 91: 261-277.
21. Dalcanton F. Modelagem matemática do crescimento de bactérias ácido lácticas em condições isotérmicas e não isotérmicas. Ph.D. thesis, Federal University of Santa Catarina. Florianópolis, Brasil: 2010. 190 p.
22. Geitenes S, Oliveira MFB, Kalschne DL, Sarmento, CMP. Modelagem do Crescimento de Bactérias Láticas e Análise Microbiológica em Apresuntado e Presunto Cozido Fatiados e Embalados a Vácuo. RECEN. 2013; 15: 113-133. 23. Cayré ME, Garro O, Vignolo G. Effect of storage temperature and gas permeability
of packaging film on the growth of lactic acid bacteria and Brochothrix
thermosphacta in cooked meat emulsions. FoodMicrobiol. 2005; 22: 505-512. 24. Pin C, Fernando GDG, Ordóñez JA, Baranyi J. Analysing the lag-growth rate
relationship of Yersiniaenterocolitica. Int J Food Microbiol. 2002; 73: 197-201. 25. Swinnen IAM, Bernaerts K, Dens EJJ, Geeraerd AH, Van Impe JF. Predictive
modelling of the microbial lag phase: a review. Int J Food Microbiol. 2004; 94: 137-159.
26. Costa JCCP. Efeito do tratamento termoquímico (óleo essencial e calor) no crescimento microbiano durante a vida útil de mexilhões (Perna perna) processados em embalagens flexíveis. M.Sc. Dissertation, Federal University of Santa Catarina. Florianópolis, Brasil: 2013. 175 p.
27. Ruiz-Capillas C, Carballo J, Colmenero FJ. Biogenic amines in pressurized vacuum-packed cooked sliced ham under different chilled storage conditions. Meat
Sci. 2007; 75: 397-405.
28. Kreyenschmidt J, Hubner A, Beierle E, Chonsch L, Scherer A, Petersen B. Determination of the shelf life of sliced cooked ham based on the growth of lactic acid bacteria in different steps of the chain. J ApplMicrobiol. 2010; 108: 510-520. 29. Vasilopoulos C, Ravyths F, Maere H, Mey E, Paelinck H, Vuyst L, Leroy F. Evaluation of the spoilage lactic acid bacteria in modified-atmosphere-packaged artisan-type cooked ham using culture-dependent and culture-independent approaches. J Appl Microbiol. 2008; 104: 1341-1351.