ORIGIN
AL RESEAR
CH
Study conducted in the city of Jequié (Bahia), Brazil.
1Universidade Estadual do Sudoeste da Bahia (Uesb) – Jequié (BA), Brazil
369
Corresponding address: Janilson Matos Teixeira Matos – Rua Cabo Lopes, no. 17, Quartel do 19º Batalhão de Caçadores – Cabula – Salvador (BA), Brazil – Zip Code: 41180-675 – E-mail: [email protected] – Finance source: own financing – Conflict of interests: Nothing to declare – Presentation: Jun. 8th, 2017 – Accepted for publication:
Oct. 3rd, 2017 – Approved by the Research Ethics Committee of the Universidade Estadual do Sudoeste da Bahia (CAAE: 49995215.3.0000.0055).
ABSTRACT | This study aimed at analyzing the association of sociodemographic, occupational, risk and health-related factors with taxi drivers’ self-perceived health. This is a cross-sectional study carried out with 100 taxi drivers from the city of Jequié (Bahia). A questionnaire consisting of sociodemographic, occupational, behavioral and health variables was used. To verify the association of independent variables with health perception, the Pearson’s chi-squared test was used, adopting a confidence interval of 95%. The frequency of positive self-perceived health was 73.0%, with statistically significant associations between negative self-perceived health and individuals with eight years or less of education (p=0.033), length of service >10 years (p=0.003), poor sleep quality (p=0.006), physical and mental fatigue at the end of a workday (p=0.002 and p=0.006, respectively) and work ability index classified as moderate and good (p=0.016, p=0.000, respectively). Negative self-perceived health in taxi drivers had association with individuals who had eight years or less of education, high length of service, poor sleep quality, physical and mental fatigue, and moderate and good work ability; which suggests the need for investments in health education actions directed to these professionals in order to promote interest in the care of their own health.
Descriptors | Occupational Health; Occupational Risks; Epidemiology; Automobile Driving; Statistics & Numerical Data.
RESUMO | Objetivou-se neste estudo analisar a associação dos fatores sociodemográficos, ocupacionais, comportamentos de risco e relacionados à saúde com
a autopercepção da saúde de taxistas. Trata-se de um estudo transversal realizado com 100 taxistas da cidade de Jequié (BA). Foi utilizado um questionário composto por variáveis sociodemográficas, ocupacionais, comportamentais e de saúde. Para a verificação da associação das variáveis independentes com a percepção de saúde, foi utilizado o teste qui-quadrado de Pearson, adotando-se o intervalo de confiança de 95%. A frequência da percepção positiva de saúde foi de 73,0%, sendo encontradas associações estatisticamente significativas entre percepção negativa de saúde e indivíduos com oito anos ou menos de estudo (p=0,033), tempo de serviço >10 anos (p=0,003), qualidade do sono ruim (p=0,006), sensação de cansaço físico e mental ao final de um dia de trabalho (p=0,002 e p=0,006, respectivamente) e índice de capacidade para o trabalho classificado como moderado e bom (p=0,016 e p=0,000, respectivamente). A autopercepção negativa de saúde em taxistas apresentou associação com indivíduos que possuíam oito anos ou menos de estudo, elevado tempo de serviço, qualidade de sono ruim, sensação de cansaço físico e mental, e capacidade para o trabalho moderada e boa; o que sugere a necessidade de investimentos em ações de educação em saúde voltadas para esses profissionais com o intuito de fomentar o interesse pelo cuidado da própria saúde.
Descritores | Saúde do Trabalhador; Riscos Ocupacionais; Epidemiologia; Condução de Veículo; Estatística & Dados Numéricos.
RESUMEN | En este estudio se propone analizar la asociación de factores sociodemográficos, ocupacionales,
Factors associated with self-perceived health in taxi
drivers
Fatores associados à autopercepção de saúde em taxistas
Los factores asociados con la autopercepción de salud en chóferes
Janilson Matos Teixeira Matos1, Cláudio Henrique Meira Mascarenhas1,Claudineia Matos De Araújo1,
de conductas de riesgo y relacionadas a la salud con la autopercepción de salud en chóferes. Se trata de un estudio transversal llevado a cabo con 100 chóferes de la ciudad de Jequié (Bahia, Brasil). Se utilizó un cuestionario que consta de variables sociodemográficas, ocupacionales, conductuales y de salud. Para analizar la asociación de variables independientes con la percepción de la salud, se utilizó la prueba chi-cuadrado de Pearson, con el intervalo de confianza del 95 %. La frecuencia de la percepción positiva de la salud fue de un 73,0 %, y se encontraron asociaciones estadísticamente significativas entre la percepción negativa de la salud e individuos con ocho años o menos de escolaridad (p=0,033); tiempo de servicio > 10 años (p=0,003); mala calidad de sueño (p=0,006); sensación de cansancio físico
y mental al final de un día de trabajo (p=0,002 y p=0,006, respectivamente) e índice de capacidad para trabajar clasificado como moderado y bueno (p=0,016 y p=0,000, respectivamente). La autopercepción negativa de la salud en chóferes ocurrió en individuos que tenían ocho años o menos de escolaridad, con alto tiempo de servicio, con mala calidad de sueño, con la sensación de cansancio físico y mental, y con la capacidad moderada y buena para trabajar; lo cual revela la necesidad de inversiones en actividades educativas en salud a estos profesionales con el fin de promover el cuidado con la propia salud.
Palabras clave | Salud del Trabajador; Riesgos Laborales; Epidemiología; Conducción de Automóvil; Estadísticas y Datos Numéricos.
INTRODUCTION
Work is an activity developed since the origin of human existence and represents an important personal achievement. Over the years, work has been suffering several transformations in the technological, economic and psychosocial areas, which can represent negative repercussions for the worker, not only on his/her integrity and health/disease process, but also on the various areas
of his/her life1,2.
One of the working classes exposed to the negative repercussions resulting from the transformations in the work environment are taxi drivers. They are subjected to long working hours, repetitive manual activities, vibrations from soil and car, heat, intense noise, pollution and risk of accidents. These factors, associated with little time for rest, little care for their own health and concern with monthly income, are potential risks to the decline in the quality of life and to the emergence
of health problems2-4.
Given this, the need for better research on these professionals’ health emerges. In the scientific milieu, one of the most reliable methods of research, which also is an important indicator of population health, is
the self-perceived health5. Such method is based on
subjective, objective and individual criteria that include biological, psychological and social aspects, influenced by socioeconomic condition, gender, age, presence of chronic diseases, occupation or no occupation, among
other factors6-8.
In this perspective, this study aimed at evaluating taxi drivers’ self-perceived health and analyzing the factors
associated with it. The results can be used to support and assist action strategies on public health, with a focus on this working class.
METHODOLOGY
This is a descriptive and analytical study of cross-sectional character, approved by the Research Ethics Committee of the Universidade Estadual do Sudoeste da Bahia (CAAE: 49995215.3.0000.0055). All taxi drivers were informed individually of the objectives, benefits, possible damage and data collection procedures. Those who voluntarily accepted to participate in research signed an informed consent form (ICF).
The population of this study consisted of men working as taxi drivers for at least six months in the city of Jequié (Bahia). Those who were in leave of absence of their professional activities in the collection period, those who were not found in their workstations after three attempts, on alternate schedules and days, and those who refused to participate were excluded.
According to the Taxi Drivers’ Union in Jequié (Bahia), this municipality has 236 taxi drivers, distributed in 34 points. Of this total, 99 employees were not found and 37 refused to participate in the study. Thus, the sample was composed of 100 taxi drivers, who were interviewed from February to April 2016.
of occupational variables: length of service as taxi driver, daily and weekly workload, whether he exercises other remunerated activities, breaks at work, satisfaction with work, relationships within the work environment, physical and mental sensation at the end of a workday, and work ability index (WAI).
The WAI is an instrument that was translated, validated and adapted to the Brazilian Portuguese. It consists of nine questions that enable the self-reported evaluation of the health state and work ability. Scores from 7 to 27 indicate low work ability; from 28 to 36, moderate work ability; from 37 to 43, good work ability; and from 44 to
49, excellent work ability9.
The third block consisted of variables related to risk behaviors, as practice of physical activity, smoking and alcohol consumption. Individuals were considered active when performing aerobic exercises with moderate
intensity for at least 2.5 hours per week10.Individuals
who smoked were considered smokers regardless of the number of cigarettes; nonsmokers were those who
had never smoked or that had no habit of smoking11.
Participants who reported consuming alcohol, regardless of the quantity, type or frequency of use, were considered
consumers of alcoholic beverage12.
The fourth block was composed of health-related variables: body mass index (BMI), sleep quality, cardiovascular risk, and self-perceived health. BMI was calculated through the formula body weight(kg)/
body height2(m2). It was classified in accordance with
the World Health Organization, in three categories:
normal weight, pre-obesity and obesity13. The quality
of sleep was evaluated through the Pittsburgh Sleep Quality Index, instrument translated, validated and adapted to the Brazilian culture. The maximum score is 21, in which scores higher than 5 indicate poor
sleep quality14.
To assess the cardiovascular risk, the Physical Activity Readiness Questionnaire (PAR-Q) was used. Through seven questions, the tool aims at detecting the cardiovascular risk before the beginning of the exercise;
each “yes” answered corresponds to a risk factor15. To
investigate self-perceived health, a single question was
posed (“how do you classify your current health state?”16),
with four response options (excellent, good, regular, bad). The self-perceived health was considered negative when the participant evaluated his health as “regular” or “bad” and positive when the participant evaluated his health
as “good” or “excellent”17,18.
Data were analyzed with the Statistical Package for the Social Sciences (SPSS) – version 21.0. First, a univariate analysis was conducted for sociodemographic, occupational, behavioral and health-related variables. For categorical variables, absolute and relative frequencies were used; for quantitative variables, mean and standard deviation.
In bivariate analysis, the association among sociodemographic, occupational, behavioral, and health-related variables with self-perceived health was verified through the Pearson’s Chi-square Test, considering significant levels of p≤0.05 and confidence interval (CI) of 95%.
RESULTS
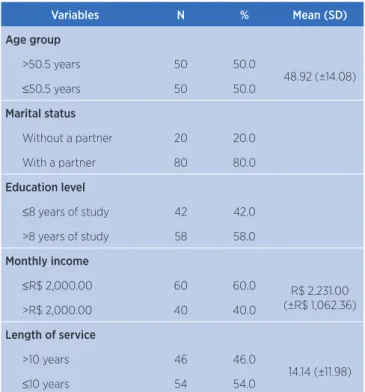
One can observe that 50.0% of taxi drivers were 50.5 or younger, 58.0% had eight years or more of education, and 40.0% were receiving more than R$ 2,000.00 per month. Considering the occupational activities, 54.0% had 10 years or less of occupation; 82.0% worked 12 hours or less per day; 97.0% stated having good relationship within the work environment; 75.0% reported mental well-being at the end of a workday; and 57.0% were classified with a great work ability (Table 1).
Table 1. Sociodemographic and occupational variables of taxi drivers. Jequié (BA), Brazil
Variables N % Mean (SD)
Age group
>50.5 years 50 50.0
48.92 (±14.08)
≤50.5 years 50 50.0
Marital status
Without a partner 20 20.0
With a partner 80 80.0
Education level
≤8 years of study 42 42.0
>8 years of study 58 58.0
Monthly income
≤R$ 2,000.00 60 60.0 R$ 2,231.00
(±R$ 1,062.36)
>R$ 2,000.00 40 40.0
Length of service
>10 years 46 46.0
14.14 (±11.98)
≤10 years 54 54.0
Variables N % Mean (SD)
Daily working hours
>12 hours 18 18.0
11.89 (±4.51)
≤12 hours 82 82.0
Other occupation
Yes 20 20.0
No 80 80.0
Meal breaks
No 5 5.0
Yes 95 95.0
Job satisfaction
No 10 10.0
Yes 90 90.0
Good relationship within the work environment
No 3 3.0
Yes 97 97.0
Physical sensation at the end of a workday
Tired 26 26.0
Well 74 74.0
Mental sensation at the end of a workday
Tired 25 25.0
Well 75 75.0
WAI
Moderate 2 2.0
Good 41 41.0
Great 57 57.0
SD: standard deviation; N: total population; WAI: work ability index
Table 2 presents data of behavioral and health variables. Most individuals practiced no physical activity (51.0%), 54.0% presented overweight, 75.0% were classified with good sleep quality and, considering self-perceived health, 73.0% presented a positive self-perception regarding their health.
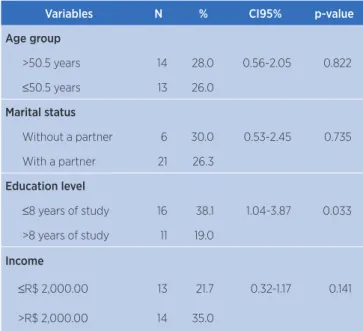
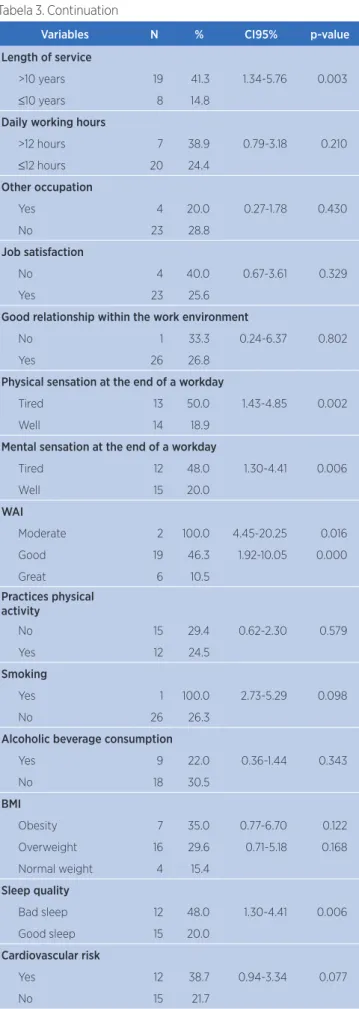
Table 3 shows data of the bivariate analysis. The numbers indicated statistically significant associations between negative health perception and individuals with eight years or less of education (p=0.333), length of service >10 years (p=0.003), poor sleep quality (p=0.006), physical and mental sensation at the end of a workday (p=0.002 and p=0.006, respectively) and WAI classified as moderate and good (p=0.016, p=0.000, respectively).
Table 2. Variables related to taxi drivers’ risk behaviors and health. Jequié (BA), Brazil
Variables N %
Practices physical activity
No 51 51.0
Yes 49 49.0
Smoking
Yes 1 1.0
No 99 99.0
Alcoholic beverage consumption
Yes 41 41.0
No 59 59.0
BMI
Obesity 20 20.0
Overweight 54 54.0
Normal weight 26 26.0
Sleep quality
Bad sleep 25 25.0
Good sleep 75 75.0
Cardiovascular risk
Yes 31 31.0
No 69 69.0
Self-perceived health
Negative 27 27.0
Positive 73 73.0
N: total population; BMI: body mass index
Table 3. Negative self-perceived health according to sociodemographic, occupational, behavioral, BMI, quality of sleep and cardiovascular risk variables. Jequié (BA), Brazil
Variables N % CI95% p-value
Age group
>50.5 years 14 28.0 0.56-2.05 0.822
≤50.5 years 13 26.0
Marital status
Without a partner 6 30.0 0.53-2.45 0.735
With a partner 21 26.3
Education level
≤8 years of study 16 38.1 1.04-3.87 0.033
>8 years of study 11 19.0
Income
≤R$ 2,000.00 13 21.7 0.32-1.17 0.141
>R$ 2,000.00 14 35.0
Table 1. Continuation
Variables N % CI95% p-value
Length of service
>10 years 19 41.3 1.34-5.76 0.003
≤10 years 8 14.8
Daily working hours
>12 hours 7 38.9 0.79-3.18 0.210
≤12 hours 20 24.4
Other occupation
Yes 4 20.0 0.27-1.78 0.430
No 23 28.8
Job satisfaction
No 4 40.0 0.67-3.61 0.329
Yes 23 25.6
Good relationship within the work environment
No 1 33.3 0.24-6.37 0.802
Yes 26 26.8
Physical sensation at the end of a workday
Tired 13 50.0 1.43-4.85 0.002
Well 14 18.9
Mental sensation at the end of a workday
Tired 12 48.0 1.30-4.41 0.006
Well 15 20.0
WAI
Moderate 2 100.0 4.45-20.25 0.016
Good 19 46.3 1.92-10.05 0.000
Great 6 10.5
Practices physical activity
No 15 29.4 0.62-2.30 0.579
Yes 12 24.5
Smoking
Yes 1 100.0 2.73-5.29 0.098
No 26 26.3
Alcoholic beverage consumption
Yes 9 22.0 0.36-1.44 0.343
No 18 30.5
BMI
Obesity 7 35.0 0.77-6.70 0.122
Overweight 16 29.6 0.71-5.18 0.168
Normal weight 4 15.4
Sleep quality
Bad sleep 12 48.0 1.30-4.41 0.006
Good sleep 15 20.0
Cardiovascular risk
Yes 12 38.7 0.94-3.34 0.077
No 15 21.7
N: total population; CI: confidence interval; WAI: work ability index; BMI: body mass index.
DISCUSSION
The self-perceived health has been increasingly investigated in scientific research due to its ability of portraying the health state of a given population, whether
it is positive or negative17-19.
This study has shown that most drivers presented a positive self-perceived health, which can be due to the fact that adults in working age have a better self-perceived health when they are working compared to
those who are away from work8. However, from those
who considered having a self-perceived health classified as negative, association with sociodemographic, occupational and health variables could be verified.
Regarding the education level, the majority of taxi drivers who reported a negative self-perceived health had eight years or less of study. This may be explained by the fact that the taxi driver profession constitutes a job opportunity that sometimes was not chosen, but rather imposed by the need to work. Still in this context, the low education level may lead the individual to have a negative perception of his/her health due to a lack of proper instruction on self-care. Analogous to this, with the increase in education level, the individuals’ health
expectancy also increases1-2,20-21.
With regard to length of work, the taxi drivers with negative self-perceived health were those with more than 10 years of profession. This can be attributed to
the presence of osteomuscular symptoms17 generated
by inadequate seats of automobiles. These seats cause
postural disorders radiologically proved22 and increase the
probability of appearance of musculoskeletal injuries in
upper extremities and in upper and lower torso23. Systemic
hypertension (SHT) can also be developed23-24, which
would make these people to associate such chronic disease
with a negative self-perceived health25. These disorders
affect negatively these professionals’ physical well-being
and quality of life17.However, the presence of these
disorders was not investigated in this study.
With regard to the quality of sleep, one can verify that there was association between bad sleep and negative self-perceived health. The deficiency in the quality of sleep can impair the ability of the brain in regulating
and restoring physical and mental functions26. The
which also had association with taxi drivers’ negative self-perceived health.
Despite taxi drivers with negative self-perceived health having reported physical and mental fatigue at the end of a workday, they presented good and moderate classification for the profession through WAI. Being the WAI a measure that depends on the individual’s subjectivity before a qualitative self-assessment about his/
her physical and mental performance27, it is possible that
taxi drivers have overestimated themselves, because, as
the work represents an important personal achievement1,
to have good mental and physical conditions for its achievement is crucial.
CONCLUSION
The negative self-perceived health in taxi drivers presented statistically significant association with individuals who had eight years or less of study, length of service over 10 years, bad sleep quality, physical and mental fatigue at the end of a workday and work ability classified as moderate and good.
The identification of these variables, which interfere directly in the self-perceived health, suggests the need for investments in health education actions directed to these professionals in order to make them aware of the occupational hazards of their profession and, thereby, to promote the interest in measures aim at reducing the need for future expenses with curative/rehabilitator treatments in Primary Care.
REFERENCES
1. Braga JCM, Zille LP. Estresse no trabalho: estudo com taxistas na cidade de Belo Horizonte. Contextus Rev Contemp Econ Gestão. 2015;13(1):34-59. doi: 10.19094/contextus.v13i1.475 2. Oliveira BG, Nascimento TLRG, Teixeira JRB, Nery AA, Casotti
CA, Boery EN. Influência da condição de trabalho na qualidade de vida de taxistas. Rev Baiana Enferm. 2016;30(1):365-74. doi: 10.18471/rbe.v1i1.14138
3. Vieira MC. Hipertensão arterial e características ocupacionais em motoristas de táxi do Município do Rio de Janeiro [dissertation]. Rio de Janeiro: Escola Nacional de Saúde Pública Sergio Arouca; 2009 [cited 2018 Oct 10]. 79 p. Available from: https://bit. ly/2RH9joO
4. Oliveira BG, Ribeiro IJS, Bomfim ES, Casotti CA, Boery RNSO, Boery EN. Cardiovascular risk factors and quality of life of taxi drivers. Rev Enferm UFPE on line. 2015;9(5):7797-803. doi: 10.5205/1981-8963-v9i5a10527p7797-7803-2015
5. Sousa LGS. As relações entre a qualidade de vida, a autopercepção de saúde e atividade física de adolescentes do município de Manhuaçu – MG [dissertation]. Belo Horizonte: Universidade Federal de Minas Gerais; 2013 [cited 2018 Oct 10]. 128 p. Available from: https://bit.ly/2ytnrsM
6. Savassi LCM. A satisfação do usuário e a autopercepção da saúde em atenção primária. Rev Bras Med Fam Comunidade. 2010;5(17):3-5. doi: 10.5712/rbmfc5(17)135
7. Agostinho MR, Oliveira MC, Pinto MEB, Balardin GU, Harzheim E. Autopercepção da saúde entre usuários da atenção primária em Porto Alegre, RS. Rev Bras Med Fam Comunidade. 2010;5(17):9-15. doi: 10.5712/rbmfc5(17)175
8. Dutra FCMS, Costa LC, Sampaio RF. A influência do afastamento do trabalho na percepção de saúde e qualidade de vida de indivíduos adultos. Fisioter Pesqui. 2016;23(1):98-104. doi: 10.1590/1809-2950/14900923012016
9. Fischer FM, Martinez MC, Latorre MRDO. Validade e confiabilidade da versão brasileira do índice de capacidade para o trabalho. Rev Saúde Pública. 2009;43(3):525-32. doi: 10.1590/S0034-89102009005000017
10. Dumith SC. Physical activity in Brazil: a systematic review. Cad Saúde Pública. 2009;25(3):415-26. doi: 10.1590/ S0102-311X2009001500007
11. Barros MVG, Nahas MV. Comportamentos de risco, auto-avaliação do nível de saúde e percepção de estresse entre trabalhadores da indústria. Rev Saúde Pública. 2001;35(6):554-63. doi: 10.1590/S0034-89102001000600009
12. Sousa TF, Silva KS, Garcia LMT, Duca GFD, Oliveira ESA, Nahas MV. Autoavaliação de saúde e fatores associados em adolescentes do Estado de Santa Catarina, Brasil. Rev Paul Pediatr. 2010;28(4):333-9. doi: 10.1590/S0103-05822010000400008 13. World Health Organization. Physical status: the use and
interpretation of anthropometry. Report of a WHO Expert Committee. Technical Report Series No. 854. Geneva: World Health Organization; 1995 [cited 2018 Oct 10]. Available from: https://bit.ly/2IQ9Wbe
14. Bertolazi AN. Tradução, adaptação cultural e validação de dois instrumentos de avaliação do sono: escala de sonolência de Epworth e índice de qualidade de sono de Pittsburgh [dissertation]. Porto Alegre: Universidade Federal do Rio Grande do Sul; 2008 [cited 2018 Oct 10]. 93 p. Available from: https://bit.ly/2NAGwi6
15. Luz LGO, Neto GAM, Farinatti PTV. Validade do questionário de prontidão para a atividade física (par-q) em idosos. Rev Bras Cineantropom Desempenho Hum. 2007 [cited 2018 Oct 10];9(4):366-371. Available from: https://bit.ly/2NzHsDu 16. Vancea LA, Barbosa JMV, Menezes AS, Santos CM, Barros,
MVG. Associação entre atividade física e percepção de saúde em adolescentes: revisão sistemática. Rev Bras Ativ Fís Saúde. 2011;16(3):246-54. doi: 10.12820/rbafs.v.16n3p246-254 17. Bezerra PCL, Opitz SP, Koifman RJ, Muniz PT. Percepção de
saúde e fatores associados em adultos: inquérito populacional em Rio Branco, Acre, Brasil, 2007-2008. Cad Saúde Pública. 2011;27(12):2441-51. doi: 10.1590/S0102-311X2011001200015 18. Silva RJS, Smith-Menezes A, Tribess S, Rómo-Perez V, Virtuoso
19. Oliveira SKM, Pereira MM, Guimarães ALS, Caldeira AP. Autopercepção de saúde em quilombolas do norte de Minas Gerais, Brasil. Ciênc Saúde Coletiva. 2015;20(9):2879-90. doi: 10.1590/1413-81232015209.20342014
20. Dachs JNW, Santos APR. Auto-avaliação do estado de saúde no Brasil: análise dos dados da PNAD/2003. Ciênc Saúde Coletiva. 2006;11(4):887-94. doi: 10.1590/S1413-81232006000400012
21. Cavelaars AE, Kunst AE, Geurts JJ, Crialesi R, Grötvedt L, Helmert U, et al. Differences in self reported morbidity by educational level: a comparison of 11 western European countries. J Epidemiol Community Health. 1998;52(4):219-27.
22. Carvalho DE, Callaghan JP. Influence of automobile seat lumbar support prominence on spine and pelvis postures: a radiological investigation. Appl Ergon. 2012;43(5):876-82. doi: 10.1016/j. apergo.2011.12.007
23. Luna JS, Souza OF. Sintomas osteomusculares em taxistas de Rio Branco, Acre: prevalência e fatores associados. Cad Saúde Coletiva. 2014;22(4):401-8. doi: 10.1590/1414-462X201400040014
24. Brito GMG, Gois CFL, Almeida AF, Martins AWR, Rodrigues EOL, Junior JPG. Fatores de risco para hipertensão arterial entre motoristas de ônibus. Rev Baiana Enferm. 2016;30(2):1-7. doi: 10.18471/rbe.v30i2.14653
25. Martinez MC, Latorre MRDO, Fischer FM. Capacidade para o trabalho: revisão de literatura. Ciênc Saúde Coletiva. 2010;15(1):1553-1561. doi: 10.1590/S1413-81232010000700067 26. Goldstein AN, Walker MP. The role of sleep in emotional brain
function. Ann Rev Clin Psychol. 2014;10:679-708. doi: 10.1146/ annurev-clinpsy-032813-153716