Legislature Size and Welfare:
Evidence from Brazil
∗Umberto Mignozzetti
†Gabriel Cepaluni
‡Abstract
What is the effect of legislature size on public service provision? While the literature relates legislature size to representation and government expenditure, its implications for welfare remain understudied. In this paper, we investigate the effects of legislature size on welfare, exploiting exogenous changes in city-council size in Brazil between 2005 and 2008. We show that adding a legislator improves education and health care. However, the results prove true for the services that are believed to be highly salient to voters and are easiest to claim credit for. In this sense, education quality and preventive health care remain unaffected while primary school enrollment and infant mortality significantly improve. To investigate the mechanism, we surveyed former councilors and analyzed 346,553 bills proposed by municipalities in the period. This analysis largely corroborates our findings, showing that politicians prefer to provide private and local public goods. This paper has implications for the design of legislative institutions.
Keywords: Legislature size; welfare; regression discontinuity design; local public goods; Brazil; education; health care
∗We would like to thank Victor Araujo, Eric Arias, Taylor Boas, Natalia Bueno, Guilherme Fasolin,
Danilo Freire, Andrea Freitas, Saad Gulzar, Shoaib Jillani, James Mahon, Lucas Mingardi, Lucas No-vaes, Ingrid Oliveira, Nelson Ruiz, and Denis Stukal for their valuable comments. We also thank the participants of seminars and conferences at the CEPESP-FGV, CUNY, INSPER, IPSA, IR - FGV, LACEA, LASA, MPSA, Notre Dame, NYU, PUC Chile, SPSA, and Uppsala. Any and all remaining errors are the sole responsibility of the authors. The authors thank FAPESP for the support, grant number 2017/07290-5. The data, replication instructions, and the data’s codebook can be found at https://dx.doi.org/doiREDACTED.
†Ph.D. Candidate, NYU. Corresponding author. Email:umberto.mig@nyu.edu.
Introduction
Legislative institutions are crucial for welfare and service provision in democratic countries. Historically, the division of power and the birth of a representative
gov-ernment placed the legislatures at the center of popular consent (North and Weingast
1989). In modern democracies, most countries have legislatures at all levels of
gov-ernment, and these institutions determine the quality of policymaking (Weingast and
Marshall 1988; North and Weingast 1989; Auriol and Gary-Bobo 2012), taxation, and
government expenditure (Weingast et al. 1981; Primo and Snyder Jr. 2008; Stasavage
2011), improve the information and quality of legislation (Krehbiel 2010), check and
veto the other political powers (Tsebelis et al. 2002), and oversee service provision
(McCubbins and Schwartz 1984;Poulsen and Varjao 2018).
Legislatures vary in many aspects, but they all have one feature in common: more than one legislator composes them. This fact makes the understanding of the effects of legislature size essential for studying the consequences of legislature on welfare.
Leg-islature size relates to collective action problems (Crain 1979; Rogers 2002),
govern-ment spending (Weingast et al. 1981; Primo and Snyder Jr. 2008), and representation
(Allen and Stoll 2014), but how these features affect welfare remain understudied. On
the one hand, government spending and lawmaking can improve some services, es-pecially those that have been under provided. On the other hand, adding a legislator can increase the number of veto players and broaden the collective action problems, paralyzing the government, and hindering service provision. Therefore, it is unclear what we should expect in terms of welfare from larger legislatures.
This paper fills this gap by studying the effects of legislature size on service provi-sion. Assuming that politicians want to further their careers, we argue that two vari-ables determine service provision: the perceived importance of the service by voters and the capacity to claim credit for its provision. Politicians perform a simple cost-benefit analysis: if providing a service results in a high electoral yield and it is easy to claim credit for, politicians will provide this service abundantly. When a service is hard to credit claim for, the service should be highly preferred by voters. Finally,
when services are both hard to claim credit for and of low importance to voters, they are placed at the bottom of the politicians’ priorities.
To test this theory, we exploit an exogenous variation in Brazilian city council sizes. In 2004, the judiciary reinterpreted the constitution, unexpectedly changing the num-ber of city councilors in Brazilian municipalities. Before the decision, municipalities could freely choose their council size, but in March 2004, the Superior Electoral Court created population thresholds for council size, adding one councilor for each sets of 47,671 inhabitants. Around the thresholds, this decision represents an exogenous change in city council size, allowing us to investigate the welfare effects of increasing the legislatures in Brazil.
Studying the 2005 to 2008 Brazilian mayoral term, when the ruling was in effect, we find improvements in health care and education. Increasing the council size by one legislator lowers infant mortality by 1.99 per one thousand infants born and increases elementary school enrollment by 2.58 children in kindergarten classrooms. However, we find no influence of city council size on the number of families enrolled in the Fam-ily Health Program, the major preventive health care program in Brazil; the proportion of infants born to mothers who accessed more than six prenatal care consultations; and primary and middle school education quality indicators. As predicted by our theoreti-cal argument, as voters place a high electoral premium on health care and as mediating school enrollment is relatively easy to claim credit for, they improve with legislature size. On the other hand, preventive health care is harder to claim credit for and school quality improvements are expensive and payoff only in the long-run. Thus, these ser-vices remain unchanged even with larger legislatures.
Finally, as our findings are aggregated at the municipal level, we need to demon-strate that they are consistent with the micro-level representation practices of city councilors. We present three sets of evidence in this direction. First, we show that the new councilor has access to governmental resources and uses public office ap-pointments to mediate service provision. They have a 91% chance of belonging to the mayoral coalition, and they appoint an average of 105 extra bureaucrats for many
positions at the mayor’s office.1 Second, we analyzed 346,553 bills approved by city councilors in municipalities regarding council size thresholds. In line with our the-ory, we find that councilors prefer to provide local public goods (72.9% of all bills), as they satisfy the populations’ needs and are easier to credit claim. Finally, we ran an online survey among the councilors during the period, showing that most coun-cilors believe that voters prefer local public goods (68.8%) to municipal-level public
goods and lawmaking (24.6%) and oversight (30%).2 We also refute four alternative
explanations: increased representation of women and non-white legislators; change in electoral competitiveness; and larger average of approved legislation by each individ-ual councilor.
We structure the paper as follows. Section1discusses the current theories on
legis-lature size and proposes a framework to understand how larger legislegis-latures affect wel-fare. Then, we provide background on the Brazilian context, present the data sources,
and the identification strategy used in this paper. Section5present the empirical
find-ings, discussing how the political incentives skew the provision of services and section
6 investigates the mechanics behind the results. The paper concludes with a
discus-sion of how our results contribute to the scholarship and with consideration of the implications of our findings for welfare and legislative design.
1
A Theory on Legislature Size and Service Provision
What is the effect of larger legislatures on public service provision? The most striking feature of a legislature is the fact that decisions are undertaken collectively. Legisla-tors have to propose changes in the status-quo, agree upon what they want to decide, appreciate proposals put forward by mayors, discuss and improve the proposals, and decide which changes they will carry on.
1These results are crucial, as mayors have extensive control over service allocation in Brazilian
mu-nicipalities: having a loyal official inside the bureaucracy can help with access to resources. In the Online Supplemental Materials, we show that mayoral characteristics remain unchanged around the thresholds, ensuring that the results do not come from the mayors.
In this sense, legislature size is critical in determining the efficiency of the decision-making process. Upon adding a new city councilor, the most elementary change is the increased production capability. Legislative production, analogous to what happens
in firms, may increase when adding an extra legislator (Crain 1979; Crain and
Tolli-son 1982; Rogers 2002). For instance, suppose that working full time, politicians can
approve five bills a month. Ten politicians can together approve 50 bills while 11 can approve 55. This increases the number of bills approved, and if bills enact services to
constituencies, then we shall witness an increase in service provision.3
However, increasing the size of legislatures also carries considerable costs. Larger
legislatures can raise the transaction costs (Weingast and Marshall 1988), increase
col-lective action problems (Crain 1979), and make forming majorities more costly (Crain
and Tollison 1982). These negative features, together with the fact that legislators
may free-ride on each others’ proposals, may decrease legislative productivity. For instance, if decisions need a majority or qualified majority to be approved, more leg-islators create a perverse incentive, increasing the difficulty of approval. Moreover, legislators are pressured to provide targeted services for their constituencies at the
expense of the entire polity (Weingast et al. 1981;Primo and Snyder Jr. 2008), and this
can raise inefficiencies in expenditure allocation. Additionally, transaction costs within
legislatures may increase the difficulty of passing bills (Weingast and Marshall 1988;
Baron and Ferejohn 1989). Therefore, it is unclear whether and how larger legislatures
impact lawmaking and service provision.
In our view, to understand the effects of larger legislatures, we need to consider the political motivations behind the legislator’s work. While an extra politician may increase the productivity frontier of a legislature, the types of services that will be favored remain unclear. To understand the political motivations, we need a theory
3An alternative explanation relates to the Condorcet Jury Theorem. In these models, there is a binary
choice with one of them being ex-ante the best. If legislators access the best choice with a probability higher than 0.5, more legislators will increase the change of selecting the best choice (Myerson 1998). However, this logic assumes that politicians choose among exogenously provided proposals, which makes sense in the case of a jury, but is somewhat uncommon for legislatures.Auriol and Gary-Bobo
(2012) compute the optimal size of legislatures considering that this is the solution to the interplay between specialization costs and citizens’ preferences.
that accounts for the cost-benefit calculations performed by politicians.
When deciding which service to prioritize, politicians look into two dimensions of the service provision. First, the competition with other legislators motivates politi-cians to provide services that they believe voters want, regardless of whether these policies improve long-term welfare. For instance, suppose that there are three ser-vices, organized hypothetically based on beliefs about which of these three voters are
more likely to reward:4 improving a local health clinic (most preferred), building a
playground (second most preferred), or increasing the quality of education (least pre-ferred). Politicians seeking recognition will mostly want to improve the health care system, which they believe will most benefit their electoral yields. After getting this done, they will shift efforts toward the playground construction and finally to educa-tion quality. Therefore, increasing legislature size will disproporeduca-tionately increase the provision of services that the politicians believe voters prefer and will reward the most in the polls.
Second, to get reelected, besides providing the services that voters prefer,
politi-cians have to take credit for facilitating provision (Weaver 1986; Fiorina et al. 1987;
Gulzar and Pasquale 2017;Nielsen and Moynihan 2017;Silva and Whitten 2017).
Typ-ically, the services that are easiest in terms of credit claiming are either providing local public goods, such as improving a neighborhood health clinic, or purely clientelistic
and personalistic services (Weingast et al. 1981; Kuschnir 2000; Stokes 2005; Nichter
2011; Stokes et al. 2013; Luna 2014; Vieira 2015; Bertholini et al. 2018). This explains
why clientelism and pork-barrel are persistent in democratic polities. Table1
summa-rizes the incentives.
These two dimensions provide a simple, yet powerful, guide of the politicians’ incentives. When voter places a high premium on the provision of a given service and it is easy to claim credit for the provision, politicians will concentrate their efforts in
4Note that there is a difference between what voters actually want and what politicians believe voters want.
Although politicians and brokers mostly access voters beliefs accurately (Finan and Schechter 2012;
Stokes et al. 2013), the crucial signal that a politician gets is vote shares, which are aggregated, and it
is hard to disentangle which service generated the greatest electoral yield for the politician. Therefore, the politician’s beliefs play an important role on the services that they prioritize.
Table 1: Effects of Legislature Size on Service Provision
Hard for Credit Claim Easy for Credit Claim
Low ranked by voters
No changes None or mild
or deterioration improvements
(Preventive Health) (Honors bills)
High ranked by Voters
Mild to low Mild to strong
improvement improvement
(Infant Mortality) (School Enrollment)
providing it. The more politicians, the higher the provision of the service. Consider, for instance, constituency service, such as getting a child enrolled at a public school. Service such as this are highly ranked by the voters, and the politicians can broke the school access directly, getting all the credit for the provision. Therefore, these services tend to increase, up to the point of being over provided.
When a service is hard to credit claim, in order to be provided it has to be highly ranked by the voters. Consider services that decrease infant mortality. Although poli-cies in this direction might be harder to be directly associated with one given politi-cian, every politician wants to be know as the ones that diminished infant mortality. The death of a child has devastating effects over a polity, and no politician wants to be associated with it. On the other hand, every parent would be extremely thankful for the politicians that improved health care and saved their child. Moreover, politi-cians might facilitate access to medication and hospitals, that in turn is easier for credit claiming. Therefore, this services will have anywhere from modest to substantial im-provements.
Suppose now that a service is easy to credit claim for, but gives low electoral yield. In this case, although the provision can be unquestionably traced back to the legislator, voters care little about the provision. For instance, honors and appraisal legislation are very common in Brazilian municipalities. However, they are perceived by politicians as low electoral yield, but the legislator that proposed the homage usually gets asso-ciated with it. These types of legislation increase with legislature size, but their effect
on welfare is negligible.
Finally, services that are difficult to credit-claim, or that politicians believe that vot-ers care very little about, are expected to receive little invested effort from politicians. For instance, consider preventive health care. Preventive care refers to health mea-sures, such as pre-natal care or vaccination, undertaken to lower the chances or the severity of a disease(s) in the future. However, it is a compounded chance: the voter has to consume the service, but its effectiveness depends on voters getting sick. Nowa-days we are witnessing how hard it is to vaccinate children, despite all the scientific evidence demonstrating its effectiveness. Moreover, rational voters may fail to punish politicians for low investments in preventive public policies, such as natural disasters
or climate change mitigation (Gailmard and Patty 2019). Hence, voters might also not
punish politicians for low investments in preventive health care because they might only observe whether a politician properly invested in preventive public policies in cases of emergency. Therefore, we shall expect little to no improvement in these types of services with larger legislatures.
In sum, these considerations suggest that instead of looking for overall positive or negative effects, the effects of legislature size should manifest diversely, conditional on the type of service studied. The most significant changes should be expected in services that voters want and that are easier to claim credit for. Services with only one of these characteristics will be intermediate in terms of their priority and efforts exerted by politicians in their provision and will improve with less intensity. Services hard to credit claim and low ranked by voters will tend to be unaffected or under-provided by lawmakers.
2
The Brazilian Case: Background
In 2004, Brazil was comprised of 5,560 municipalities. According to the Brazilian Con-stitution, each municipality has to provide its citizens: health care, primary education, transportation, and necessary infrastructure. Municipalities can have local laws and
collect taxes on housing and services. Even though the tax collection is around 5% of the total revenue, municipalities receive a considerable sum of resources from the state and the central governments.
A mayor and a city council ranging from 9 to 55 councilors govern a municipality. Mayors and councilors are elected by direct vote in the same election. The mayor, who has a more prominent role, may propose laws, tax changes, and organize the provision of goods and services, as well as the bureaucratic organization. The mayor presents these policies as proposals to the city council, which can accept or reject them.
For the city council, the constitution states that councilors have two primary duties. First, they should propose, discuss, and vote on legislation put forward by themselves or by the mayors. Second, they oversee public accounts, the bureaucracy, and the pro-vision of public services. Councilors can also propose laws and requirements, aiming to provide public goods and services to their constituencies.
Councilors also provide an array of public and personal services for their con-stituents. They help voters access public hospitals, transport patients to hospitals, se-cure prescription medication, facilitate school enrollment or public employment, and
even pay utility bills, or buy food (Nichter 2011). Lopez and Almeida (2017b)
con-ducted interviews in twelve municipalities in the state of Minas Gerais and found that councilors spend their time responding to a vast array of voters’ needs. One councilor stated, in one of the interviews, that she receives “... all kinds of requests. Covering everything from LPG gas cylinders to airfare, and everything in between: living sta-ples, medication, utility bills, rent, airfare, fares for ground transportation, aid, fifty
reais in spending money, grocery bills... (Councilor M. M.) (Lopez and Almeida 2017b).
Regarding organization of city councils, the most critical component is size. From 1988 to 2004, the constitution loosely set rules regarding the number of seats, and some places ended up with either a very large or a minimal number of councilors. As an illustration, Nova Russas in Ceará used to have 21 city councilors with only 30 thousand inhabitants (around one legislator per 1,429 citizens). On the other extreme, Sorocaba in São Paulo had only 15 councilors with more than 500 thousand inhabitants
(one legislator per 35,249 citizens). In 2003, the council-size problem gained visibility as Mira Estrela, a small municipality in the state of São Paulo with only 2,651 residents, reduced their city council from 11 to 9 seats. The change motivated a legal dispute that reached the Supreme Court. The Court favored the municipality’s decision and ruled that the size of any city council should correspond with precise population thresholds. In March 2004, the Superior Electoral Court (TSE) issued resolution 21,702/2004,
establishing a series of population thresholds for all municipal legislatures.5 The
change regulated the city council’s size for the 2004 election and used the 2003 pop-ulation projections by the Brazilian Institute of Geography and Statistics (IBGE). The resolution presented the following reasoning. First, municipalities must have at least nine councilors. For populations falling in the range of zero to a million inhabitants, the maximum is 21 councilors. Therefore, the Electoral Court Judges divided a million by 21, getting a threshold of 47,619 inhabitants. They started with nine legislators, increasing one by one until they reached 21. Then the council size remained constant from 571,428 (12 × 47,619) to one million inhabitants. After that, the cutoff jumps to
33and increases one by one up to the maximum number of legislators allowed (55).
We are not using cutoffs above one million inhabitants because there are only a few municipalities with such large populations.
This decision makes Brazil the ideal testing ground for our theory. Although an endogenous choice motivated the change that municipalities made, the rule was ut-terly unpredictable. As a consequence, around the thresholds, the cities that lied in the right-hand side are comparable to the cities that lied in the left-hand side of the discon-tinuity, with the exception that on the right they gained a new councilor. This change in council size happened seven months before the election, making it impossible for candidates to change their service provision strategies for the 2004 election. Therefore, during the 2005 to 2008 term, the changes in council size allow us to study the increase in the legislature size, holding other characteristics constant. Around each threshold,
5In Brazil, there is a distinction between the Superior Electoral Court and the Supreme Court. The
Supreme Court rules on constitutional cases while the Superior Electoral Court implements electoral rules.
we have an exogenous shock on the council size that allows us to quasi-experimentally estimate the causal effect of legislature size on service provision and welfare.
3
Variables and Data Sources
In this paper, we use three groups of variables. First, we study variables on municipal-ities’ characteristics that should remain constant around the thresholds (pre-treatment variables). Second, we use indicators of education and health care in Brazilian cities. Third, we employ variables to uncover the mechanism driving the results. We also included data from an online survey conducted to explore the mechanism and col-lected data on bills approved by city councils in municipalities around the population thresholds. The summary statistics follow in the online supplemental materials.
As pre-treatment variables, we collected the number of city council seats in the 2000 election, the population in 2000, the municipal GDP in 2000, and the proportion of low-income families in 2000. These variables come from the Superior Electoral Court (Tribunal Superior Eleitoral–TSE) and 2000 Brazilian Census by the Brazilian Insti-tute of Geography and Statistics (Instituto Brasileiro de Geografia e Estatística–IBGE). As these variables refer to a period before the council size resolution, the thresholds should have a null effect on them. Moreover, the main treatment variable, the TSE 2004 city council sizes, varies sharply with the thresholds decided by law.
To measure welfare, we collect variables on education and health care provision. For education, we included the average enrollment in primary (K–4) and secondary (5–8) school. To measure quality of education, we used the Education Development Index (Índice de Desenvolvimento da Educação Básica–IDEB). The Ministry of Edu-cation issues this indicator every other year since 2005. The EduEdu-cation Development Index is a weighted mean of Portuguese, Math, and age-grade compatibility.
To measure general health care, we collect data on infant mortality and postnatal infant mortality. To measure preventive health care, we collected the coverage of the
Family Health Program6and the proportion of pregnant women that attended at least
seven prenatal care consultations. All variables are from the Brazilian Ministry of Health data center (DataSUS).
To investigate the micro-level mechanisms, we look into municipal-level data, city councilors’ characteristics, approved legislation data, and former legislator survey data. The municipal-level data is comprised of: the number of councilors belonging to the mayoral pre-electoral coalition; the councilor’s gender and race; the number of po-litically appointed employees at the mayor’s office; the number of career employees; and finally, the number of appointed employees in the councilors’ cabinets—all vari-ables come from the Superior Electoral Court and the Brazilian Institute of Geography and Statistics.
We also collected 346,553 bills for the municipalities within 10 thousand inhabitants of the legislature size thresholds. We collected the information regarding the types of proposals, discriminating between local public goods, municipal-level public goods, oversight, and other types of legislation (mostly honors). This information allowed us to investigate what types of services legislators attempt to provide via city council.
Lastly, we ran an online survey with 174 former city councilors, asking them what types of policies were more electorally attractive from the voters’ perspectives. To-gether, all this evidence provides a clear picture of the pattern of representation in Brazil, from macro-level municipal welfare consequences to their micro-level mecha-nisms.
4
Empirical Strategy
Here, we use a regression discontinuity design (RDD), exploiting the population thresholds established by the Superior Electoral Court resolution. These thresholds represent a source of exogenous variation in the municipalities’ city-council size. As these cutoffs were implemented in the 2004 elections, politicians could not foresee the
care to low-income families. The program is funded by the Federal Government, but the implementa-tion is local.Copque and Trad(2005), analyzing the municipalities in the state of Bahia, show that the implementation varies considerably from one municipality to another.
changes and optimally adapt to them. Consequently, around each cutoff, the munici-palities are arbitrarily similar, with the only difference being their city-council sizes.
Figure 1 displays the distribution of municipalities within each city-council size
bin. These population thresholds remained in effect till 2009, when the Congress
amended the Brazilian Constitution.7 The period of this study is between 2005 and
2008, which comprises a full mayoral and city-council term in the Brazilian munici-palities following the 2004 elections.
● ●●●● ● ● ● ● ●●● ● ● ● ● ●●● ●●● ●● ● ● ● ● ● ●●● ●●● ●●●●●● ●● ● ●●●●● ●● ● ●●● ● ●●●● ●●●● ●●●●●●●● ● ●●●● ●●●● ●● ●●● ● ● ● ● ●● ● ● ● ● ●● ●●● ●● ● ● ●● ● ● ● ●● ● ● ●● ● ●● ● ● ● ● ● ●●●●●●●●●●●●●●●●● ● ● ●● ● ●● ●● ● ● ●● ● ●● ● ●● ●● ●● ● ● ● ●●● ● ●●● ●●● ● ● ● ● ● ● ●●●● ●● ● ● ● ●● ● ● ● ●●●●●●●● ● ● ● ●●●● ●●●●●●●●● ● ●● ● ● ● ● ●● ●●●● ●● ● ● ● ● ● ●● ●●● ● ●●● ●●● ●● ● ●● ● ●●● ●●● ● ● ● ● ● ● ● ● ●● ● ● ● ●● ●● ●● ●● ● ● ● ● ● ● ● ●●●●●●●● ● ● ● ● ●● ●● ●●● ●●● ● ● ● ● ● ●● ●●● ● ● ● ● ● ● ●● ● ● ●●●● ●● ● ● ● ● ●●●●●● ●●●● ●●● ● ●● ● ● ●● ● ● ● ●● ● ● ● ● ● ● ●● ●●● ● ● ● ● ●●●●● ● ● ● ● ●●●●●●● ●● ● ● ● ● ● ● ● ● ● ●● ● ●● ●● ● ● ● ● ●●● ● ● ●●●●● ●● ●●● ●● ●●●● ● ●●●●●●●● ● ●● ● ●●●●● ●● ●●●●●● ●● ● ● ●● ● ●● ●●● ● ●●●●● ●● ● ● ● ●● ●●●●●● ● ●●●● ● ● ●● ●●●●● ●● ● ●●●●●●●●●●● ●●●● ●● ●●●●●●●●● ● ● ● ● ●● ● ●● ● ●●●●●●●● ●● ● ●● ● ● ● ● ● ●●●● ● ●● ● ●● ● ● ●●● ● ● ● ●● ● ●●●●● ● ● ● ● ● ●● ● ● ● ●● ● ● ●● ● ● ● ● ● ●● ● ● ● ● ● ● ●● ● ●● ● ● ● ●● ● ●● ● ● ● ● ● ● ●●● ●● ● ● ● ● ● ● ● ● ●● ● ● ●● ● ●●●●● ● ● ● ● ●● ● ● ●● ●● ●● ● ● ● ● ● ●● ● ●● ● ●● ● ● ● ●● ● ●●● ● ● ● ● ● ● ● ● ● ● ●●●●● ●● ●● ● ● ●●●●●●●●● ● ● ● ●●●●●●●●●●●●●●●●● ●● ● ● ● ● ●● ● ● ●●●●●● ●● ● ● ● ● ●● ● ● ● ● ● ● ● ● ●●●●●●● ●●● ● ● ● ● ● ●●●● ● ● ● ● ● ● ● ● ●●●●●●● ● ● ● ●● ●●●●●● ●●● ● ●● ● ●●● ●●●●●●● ● ●● ●●●●●●●● ● ● ● ● ● ● ● ●● ● ● ● ● ● ●● ● ● ● ●●●●●●● ● ● ● ● ● ●●●●●●●● ● ●●●●●●●●●●● ●●● ● ●●● ● ● ● ● ●●●●●●● ● ●● ●● ●● ● ● ● ●● ● ● ● ● ● ● ● ● ●●● ●●●●●● ● ● ●● ●● ● ●●● ● ● ●● ● ● ●● ●● ●● ● ● ● ●●●● ●●●● ●● ● ●● ● ● ● ●● ● ● ● ● ●● ● ●●● ● ● ● ●●●●● ● ●● ●●●●● ● ● ● ●●●●●● ● ● ●●● ● ● ● ●●●●●● ●●● ● ●● ● ● ● ●● ● ●●● ● ● ● ● ● ● ●● ● ●● ● ●● ●● ● ● ● ●● ●●● ●● ●● ● ●● ● ● ● ●● ● ● ●● ● ●● ● ● ● ● ●● ●● ● ●●●●●●●●●●●● ●●●●●● ● ●● ● ● ● ● ● ●● ● ● ● ●●●●●●●● ● ● ●●●●● ●●●● ● ● ● ● ● ● ● ● ● ● ● ● ● ● ● ●●● ● ● ●●●●● ●●●●●● ● ● ● ●● ● ● ● ● ● ● ● ● ●●●● ●●●●●● ● ●●●●●●●●●●●●●●●●● ● ● ● ●●● ● ● ● ● ● ● ● ●●● ●● ●● ● ● ● ●● ●● ● ● ●●●● ●● ● ● ● ● ●● ● ●● ● ●●●●● ● ● ●●● ●●● ●● ● ●●● ● ● ●● ●● ●●● ●●● ●● ● ● ● ●●●●●●●● ●●● ● ●●● ● ● ● ●●●●●●●●● ● ●● ●● ● ● ● ● ● ●●●●●●● ● ● ● ● ● ● ●●● ●● ● ●● ● ●●●●●●●●●●●●● ● ● ●● ●●●●●● ● ● ● ●●● ●●● ●● ●●● ●●●● ●●●●● ●●● ●● ●● ●●● ● ● ● ●●● ● ●●●● ●●●●● ● ● ● ● ● ● ●●● ● ● ● ●●●● ● ● ●●● ● ● ● ● ● ● ● ● ● ●●●●●●●●●●● ●●● ● ● ● ●●● ● ●●● ●● ●●●● ●●●●●●● ●●●●●●●●●●●●● ● ● ● ● ● ● ● ● ●●●● ● ● ● ● ● ●● ●●●●●● ●●●●●● ● ●●● ● ●● ●● ● ● ●●●● ● ●●● ● ● ● ● ●●●●● ● ● ●●● ●●●●● ● ● ● ● ● ● ●●● ● ● ●●●● ●● ● ●●● ● ● ● ● ●● ●●●●●●● ● ● ●●● ● ● ●●● ● ● ● ●●●●●●●●● ● ● ●●● ●● ●●●●● ● ● ● ●●●●●●●●● ● ●●● ●●● ● ●●● ● ● ● ●●●● ● ● ● ● ● ●●●●● ●● ●●● ● ● ● ● ● ● ● ● ●●●● ●● ● ● ● ●●●● ●●● ●●● ● ● ● ● ●● ●●●● ● ●●● ●● ● ● ●●●●● ● ●●● ● ●● ● ● ● ●●● ● ● ●● ● ●● ●● ● ●● ●●● ● ● ● ●● ● ●●●●● ●●● ●● ● ●●●● ●● ● ●●●●●● ●● ●●●●●● ● ● ● ●● ● ●● ● ● ● ●● ● ●●●●●●● ● ●●● ●● ●● ● ●● ● ● ●●●● ●● ● ● ●● ●●● ●●●● ● ● ● ●● ●●● ● ● ● ● ● ●● ●● ● ●● ● ● ● ●●● ● ●●●● ● ●●●●●●●●●●●●●●●●● ● ● ● ● ● ● ● ● ● ● ● ●●● ● ● ● ●● ● ●●● ●●●● ● ●●●●● ●●●● ● ● ●● ● ●●●●●● ●●●●●● ●●●● ●● ● ●● ● ●● ● ●●●●●●●●● ● ● ● ● ●● ●● ● ●●● ●●●●●●●●●●● ●●●●●●● ●●●●●●● ● ● ● ● ●● ● ●●●●●● ● ● ●● ● ● ● ●● ●●● ●● ●●● ●● ●●● ●●● ●●●●●●●●● ● ● ● ● ●●●●●●●●●● ●● ●●● ●●● ●● ● ●●●●● ● ● ●● ●●●●●●●● ●● ●● ● ● ●● ● ●● ● ● ● ● ●●● ● ● ●● ● ● ● ● ● ● ●●● ●● ● ●●●●●● ●● ● ● ● ● ●●●●● ● ● ● ●●● ●●●● ●●●● ●● ●●●●●●● ● ● ● ● ● ● ● ● ● ● ● ● ●●● ● ●●● ● ● ● ●● ●●●●●●●●●●●●● ● ●● ● ● ● ●● ●●●●● ● ● ● ● ● ● ●● ● ●●●●● ● ●●●●● ● ● ● ● ● ● ●● ●● ●●● ●●●●●●● ● ● ● ●● ●●● ● ● ● ●● ● ●●●●● ●●●●●●● ● ●●● ●●● ●● ●●●●●● ●●● ●●●●● ●●●● ●● ●●●●●● ● ● ● ● ●● ●●●● ●●●●● ● ● ●● ●● ●●●● ● ● ● ● ● ● ● ●●● ● ● ● ● ● ●●● ● ● ● ● ●●● ● ● ● ●● ●●●● ● ● ● ● ● ● ● ● ● ● ● ● ● ● ● ● ● ● ● ● ●● ● ● ●●●●● ●● ●●●●● ● ● ●● ● ● ●●● ●● ● ● ● ● ● ●● ● ● ● ● ● ● ● ● ● ● ● ● ●● ● ● ● ● ●●●●●●●●●● ● ●●● ●● ● ●● ●● ●● ● ●● ● ● ●●●● ●●●● ● ● ● ●● ● ● ● ● ● ● ● ● ● ● ● ● ● ● ●●●● ● ● ●● ●● ●●● ● ●●●●●●●● ●● ● ● ● ●●● ●●● ●●● ●●●●●●●●● ● ● ●●● ● ● ● ●●●●● ●●●●● ●●●●●●●●●●●●●●●●●●● ● ● ●●● ● ●●●●●●● ●●●●●●● ●● ● ● ●●●●● ●●●● ● ●● ●●●●●●●●●●●● ● ● ● ● ● ●●●●●●●●●●●● ● ● ●●● ● ●●●●●● ● ●● ●● ●●●●●● ● ● ● ● ● ● ● ●●●●●●●●●●● ●●●●●●●●●●●●●●●●● ● ● ● ● ●●●● ● ●●● ●● ● ● ● ●● ● ● ●●● ● ● ● ● ● ● ● ● ● ● ● ● ● ●●● ● ●● ●● ● ● ● ● ● ● ● ● ●●●●● ● ● ● ● ●● ●●●●●● ●● ● ● ● ● ●●●● ● ● ● ● ● ●● ● ● ●● ● ● ● ●● ●●●●● ● ●●●●● ●●●●●●● ●● ● ● ●●●● ● ● ● ● ● ● ● ● ● ● ● ● ● ● ● ● ● ● ●● ● ● ● ●●● ● ● ● ● ● ● ● ● ● ● ● ● ●●●●●●●● ● ● ● ● ●● ● ● ● ● ●●●● ●● ● ● ● ●● ● ● ●●● ● ● ● ● ● ● ● ● ● ● ● ●●●● ●●●●●●● ● ●● ● ● ● ●●●●●● ●● ●●●●●●●●●●●●●●●●●●●●●●●●●●●●●●●●●●●●●●●●●●●●●●●● ● ● ●● ●●●●● ●● ●●●●●●●●●●●● ●●●●●● ● ●●●●●●●●●●●●● ●●● ● ●●●●●●●●●●●● ● ●●●● ●●●● ● ●● ●●● ● ●● ● ●● ● ● ● ●●●●●●●●●●●●●●● ● ●●●●●● ●●●●●●●●●●●●● ● ●●●●●●●●●●●● ● ●●●●●●●●●●● ● ● ● ●●●● ● ● ● ● ●●● ● ● ● ● ● ● ●● ●●●●●●● ●● ●●● ●●●●●● ●●● ● ● ●●● ● ● ● ● ● ● ●● ● ● ● ● ● ●●●●● ● ● ●●● ● ● ● ● ● ● ● ● ● ●●●●●●●●● ● ● ●● ● ●●●● ● ● ●●● ●● ● ●●● ● ●● ● ●● ● ● ● ● ● ●●●●●● ●● ●● ● ● ● ● ● ● ●● ● ● ● ●●●● ●●●● ● ● ●●●●● ● ● ●● ● ●●●● ●●●● ●● ● ●●●●●●●●●●●●●●● ● ● ● ● ●●●● ● ●●●●●●●●● ● ● ● ● ● ● ● ● ●● ● ● ● ● ●●●●● ●●●●●● ●●●●●●●●●●●●● ●●●●●● ● ● ● ● ● ●● ● ●●●● ● ● ● ●● ● ● ●● ● ● ● ● ● ● ●●●●●●●●●●●●●● ●● ●●●●●●●●●●●●●● ● ● ● ● ● ● ●● ● ● ●●●● ● ●●●● ●●●●● ● ●●● ●●●●●●●●●●● ● ● ●● ●●●●● ●● ● ● ● ●● ●● ● ●● ●●● ● ● ●●● ● ● ●● ●●● ● ● ● ● ● ● ●●●●●●●●● ● ● ● ● ●● ● ● ● ● ● ● ● ● ● ●●●● ●●●●●● ● ● ● ● ● ● ● ● ● ● ● ● ● ● ● ● ●● ● ● ● ● ● ● ● ● ● ●● ● ● ● ● ● ● ● ● ●● ●●●●● ● ● ● ● ● ● ● ● ● ● ● ● ● ● ● ● ● ● ● ● ● ● ●●●●●●●●●●●●● ● ●●● ● ● ●●● ●● ● ● ● ●●● ● ● ●●● ●● ● ● ●● ●●●●●●● ●●● ●●●●●● ●● ●●●●●●●●●●●●●● ● ● ●●●● ● ● ● ● ● ● ● ● ● ●●●●●● ● ●●● ● ●● ●● ● ●●●●●● ● ●●●● ● ● ● ● ●●●●● ● ● ●● ● ●●●● ●●●● ● ●●●● ●●●● ● ●●●●● ●● ●●●●● ● ●● ● ● ● ● ●● ● ● ● ● ● ● ● ● ●● ● ● ● ● ● ● ● ●● ● ● ● ● ● ●● ●●● ●●●●●● ● ●●● ●● ●●●●●●● ● ● ● ● ● ● ● ●● ● ●●● ● ●●●● ● ● ● ● ●● ● ●● ●● ●● ●●●●● ●●●●● ● ● ● ● ●● ● ●● ● ● ● ●● ● ●● ● ●● ●● ●●●● ●●●●● ● ● ● ● ●● ● ●●●●● ● ● ●●● ●● ● ● ● ●●● ●● ●● ● ● ● ● ●● ● ● ●●● ● ●●●●●●●●● ● ●●●● ●● ●● ●●● ●●● ● ● ●●●●● ● ●● ●●●● ● ● ●●● ● ●●● ● ●●●● ● ● ●● ● ● ● ● ● ● ● ● ● ● ● ● ● ●●●●●●● ●● ●●●●● ●● ● ● ● ● ● ● ●●●●●●● ●● ● ● ● ● ●● ●● ● ●●●●●● ● ●●● ●●●●●●●● ●● ● ● ● ●●●● ●●●●●● ●●● ● ●●● ●● ●●●● ●●● ● ●●●●● ●● ●● ● ●●●● ●●●●● ●● ●●●● ●● ● ● ● ●●●● ●●●●● ●●● ● ●● ● ●●●●● ● ● ● ●●●● ●●● ●● ●●● ● ● ● ● ●● ●● ● ●●●● ●●● ● ● ●●● ●●●●● ● ● ● ● ●● ●● ●● ● ● ● ● ● ● ● ● ● ● ● ●● ● ●●●● ● ● ●● ● ● ● ● ● ● ● ● ●● ● ●● ● ● ● ● ● ●●●● ● ●●●●●● ●● ● ● ● ● ● ● ●●● ●● ● ●●● ●● ●●● ●●● ● ● ● ● ●● ●● ● ●●● ●● ●● ● ●●●●●●● ●● ●● ●●● ● ●● ● ● ● ●● ● ● ● ● ●● ● ● ● ● ●●●● ●●●● ●●●●●●● ●●● ●●●●●●●●● ● ● ● ●●●●● ● ● ● ● ●●● ● ● ● ● ● ●● ● ● ●●●● ● ● ● ● ● ● ● ●●●● ● ● ● ● ● ● ● ● ● ● ● ● ● ● ● ●● ● ● ●●●●●● ● ●● ● ● ● ● ● ● ●● ●● ● ● ●●●● ● ● ● ● ●● ● ● ●● ● ● ● ●●●●●●● ● ●●● ● ● ● ● ● ● ●● ● ● ● ● ● ● ● ● ● ●● ●●●●●●● ● ● ●●●● ● ● ●● ● ●●● ●● ● ● ●●●● ●●●● ● ● ● ● ● ●●●●●●●●●●●●●●● ●● ●●●●●●● ● ● ● ● ●●●●●● ● ● ● ●●●●● ●●● ● ● ● ●●● ●● ● ● ● ●●●● ● ● ●● ● ● ● ● ● ● ● ●●●● ●● ●●●●●● ●●●●●●● ●●● ● ● ● ● ● ● ● ● ●●●● ● ●● ● ● ● ● ● ● ●●●● ● ● ●● ●●●● ● ● ● ● ● ●● ●●●● ● ● ●●●● ● ● ● ● ●●●●●●●●●● ● ● ●●●●●●● ●●●●●●●● ● ● ● ● ● ●● ● ●● ● ●● ●●● ●● ●●●●●● ●●●●●● ● ● ● ● ● ● ● ● ●●● ●● ● ● ●● ● ● ● ●●● ●● ● ● ● ● ● ● ●● ● ● ● ●●●●●● ● ● ● ● ● ● ● ● ● ● ●● ● ● ● ● ● ●● ● ● ●● ●● ● ● ● ●●●●●●● ● ● ● ● ● ● ● ● ● ● ●● ● ● ● ● ● ● ● ● ●● ●● ● ● ● ● ●● ● ● ● ●●● ● ● ● ●●●● ●● ●● ● ● ● ● ● ● ● ● ● ● ● ●● ● ● ●●●● ●●● ● ● ● ● ● ● ● ●● ● ●● ● ● ● ● ●● ●● ● ● ● ●● ● ●● ●●●●●●●●●● ● ●● ●● ● ● ● ● ● ●●● ● ● ● ●●● ● ● ● ● ●● ●●●● ● ● ● ● ● ● ● ●● ●● ●●●●●●● ● ● ● ● ● ● ● ● ●●● ● ● ● ● ● ● ● ● ●● ● ● ● ● ● ● ● ● ● ● ● ● ● ● ● ● ●●● ● ● ● ●● ● ● ● ●● ● ● ● ● ●● ● ●● ●●●●●●●●● ● ● ● ● ● ●● ● ● ● ● ● ●● ●●● ●●●● ● ● ● ● ● ● ● ●●●●●●●●●● ●●● ●●●● ●●●●● ● ● ● ●●●●●●●●●●●● ●●●●● ● ● ●●●●● ●●● ● ● ● ● ●● ● ● ●● ● ● ●●● ●●● ●● ● ● ● ● ● ● ● ● ● ● ●● ● ● ● ● ●● ● ● ● ● ● ● ● ● ● ● ● ● ●●● ●● ● ● ●● ● ● ● ● ● ● ● ● ● ● ● ●●●●●●● ● ● ● ● ●●● ●● ● ● ● ● ●● ● ● ● ● ● ● ●●● ●●●●●● ● ● ● ● ●● ● ● ●● ●●●●●●●● ●● ● ● ● ●● ●●●●●●●●● ● ● ● ● ● ● ● ● ●●● ● ● ● ● ● ● ●●● ● ● ● ●● ● ● ● ●● ●● ● ● ● ● ● ● ● ● ● ● ●● ● ●● ● ●●●●● ● ● ● ●●● ● ● ●●●● ● ● ● ●●● ● ● ● ● ●● ● ●● ● ● ● ●● ● ● ● ●● ● ● ● ● ● ● ● ● ● ●● ●●●●●●●●●●● ● ●●●● ● ●●● ● ●●● ● ●●● ●●● ●●● ● ●●●●●● ● ●● ●●●●●●● ●● ●● ● ● ● ●●●● ●● ●●●● ●● ●● ●●●● ● ●●● ●●●●● ● ● ●●●●●●● ●●●●●●●●●●●●●●●●●●●●●●●●●●●●●●●●●●●● ●● ● ● ● ● ● ●● 9 10 11 12 13 14 15 16 17 18 19 20 21 47.619 95.238 142.857 190.476 238.095 285.714 333.333 380.952 428.571 476.190 523.809 571.428 Population in 2003
Number of Seats 2004 Elections
Type
Cutoffs Placebo
Figure 1: Distribution of Municipalities by Population and City-Council Size
The credibility of the causal claim relies on three main assumptions. First, we need to show that no municipality could select on which side of the discontinuity it would lie. Second, as this is a sharp regression discontinuity, the council size should increase precisely as the law mandates. Finally, pre-treatment variables, collected before the 2003 Supreme Court decision, should not be affected by the 2004 ruling on council
7In 2009, the Brazilian Congress amended the constitution changing the number of legislators and their
salary caps, making it impossible to study only the effects of legislature size after 2008. We provide more details on these changes in the Online Supplemental Materials.
size.
For the first assumption, McCrary(2008) proposes a measure of the distributional
imbalance around the discontinuity, testing whether cases are more abundant in the left or the right of the cutoff. For our research, the McCrary statistic is 0.391 (SE = 0.299), showing no evidence of manipulation. In the Online Supplemental Materials,
we run the Cattaneo et al.(2019) test of distribution imbalance, that also confirm the
non-sorting hypothesis.
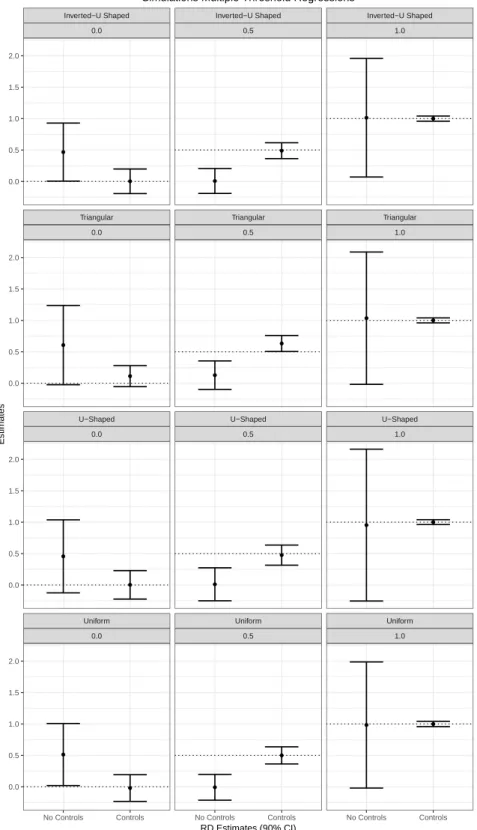
For the second assumption, we know that running RDD in multiple thresholds may lead to inconsistent estimates when there is an imbalance in the running
vari-able’s distribution around the cutoffs (Bertanha 2017;Cattaneo et al. 2016;Eggers et al.
2018). For example, in our dataset, we have twelve discontinuities, and at each
thresh-old we have a sharp increase of one councilor, from 9 to 21. When running an RDD on these discontinuities, a consistent estimator should fit an exact change of one coun-cilor. However, if we pool all the discontinuities together with no correction, we find an increase in council size of 1.63 councilors. This is because when we pool together all the discontinuities, we are implying that changes in municipalities right below the 47,619 cutoffs (9 to 10 councilors) are comparable to changes in municipalities right above the 571,428 cutoffs (20 to 21 council members). That is incorrect, not only be-cause we could be comparing a municipality with nine councilors with one with 21 councilors, but also because these municipalities diverge in many other aspects, such as population to GDP per capita.
To avoid this problem, we show by simulation that adding controls, especially the variables responsible for the multiple threshold assignments (in our case, the popula-tion in 2003), improves the consistency and efficiency of the estimates. Relying on this fact, we add five controls to our estimates: population in 2003; GDP per capita; num-ber of seats in 2000; year; and a dummy for the northeast municipalities. The reason for the first variable is the multiple threshold assignments. We add GDP per capita be-cause richer municipalities tend to be more productive and have better public services. The number of seats in 2000 intends to control for the fact that some municipalities
could experience a change provoked by the previous council size, confounding our estimates. The year and the northeast dummies serve to improve efficiency. Adding
controls improves efficiency in RDD (Calonico et al. 2019) and also improves the
con-sistency in the multiple thresholds RDD. See the Online Supplemental Materials for further tests and simulations.
For the last assumption, we should have no changes in pre-treatment covariates. These pre-treatment covariates are variables measured before the primary outcomes. As the threshold rule selected by the Brazilian Electoral Court was unpredictable, it should not detect any variation before the thresholds were in place.
Additionally, we propose a placebo test consisting of running the same models but with “fake cutoffs.” We build these placebo cutoffs by creating a new cutoff between each pair of real cutoffs. For example, as the first real cutoff is in 47,619 inhabitants, then the first “fake cutoff” is at 47,619/2 = 23,809.5, and so on until the last cut added in the main model. We run placebo tests for all the municipal-level variables studied in this paper.
Table 2displays the results of the validity checks. At the top of the table, we run
the first-stage regressions, both using and not using the controlling covariates strategy proposed, for both real and the placebo cutoffs. At the bottom, we estimate the pre-treatment covariate balance.
Notice that without controls, the first stage overestimates the change in the primary treatment and underestimates the change in the placebo regressions. After adding covariates, the results improve, and the point estimates are now one for the primary model and zero for the placebo regressions, which are the correct values. Moreover,
Panel B of Table 2show that the pre-treatment covariates remain unchanged around
Table 2: Research Design Validity Check
Panel A: Validity Check — First Stage
(1) (2) (3) (4)
Additional Num. Placebo Add. Additional Num. Placebo Add.
Seats 2004 Num. Seats 2004 Seats 2004 Num. Seats 2004
(Without Controls) (Without Controls) (With Controls) (With Controls)
LATE 1.63∗∗∗ -0.31∗∗ 1.00∗∗∗ -0.00 (0.51) (0.14) (0.0004) (0.0000) N Left 5184 4621 5184 4621 N Right 343 906 343 906 Eff N Left 199 638 49 886 Eff N Right 145 385 51 477 BW Loc Poly 8.717 6.700 3.008 8.629 BW Bias 13.620 12.114 5.008 13.466
Panel B: Validity Check — Pre-Treatment Variables
(5) (6) (7) (8)
Number of Population GDP % of Poverty
Seats 2000 2000 Census 2000 Census 2000 Census
LATE 0.17 -2057.60 0.06 -9.72 (0.67) (1926.33) (0.18) (6.27) N Left 5178 5131 5131 5131 N Right 343 343 343 343 Eff N Left 208 219 200 194 Eff N Right 147 157 145 142 BW Loc Poly 8.970 9.368 8.739 8.530 BW Bias 13.860 15.029 14.752 13.035
Note:∗∗∗p < .01;∗∗p < .05;∗p < .1. RD local linear estimates usingCalonico et al.(2019) opti-mal bandwidth quadratic selection and triangular kernel. Robust standard errors, clustered at the municipal level, in parentheses. Controls: population, GDP per capita, number of seats in 2000, year, and dummy for northeast region. N Left and N Right represent the total number of observation in the left and right sides of the thresholds (untreated). Eff N Left and Eff N Right are the number of cases within the bandwidth. BW Loc Poly is the Bandwidth used to com-pute the Local Average Treatment Effect (LATE). BW Bias is the Bandwidth used to comcom-pute the standard errors.
5
Legislature Size and Welfare: Empirical Analysis
We study the impact of legislatures on two essential groups of services for welfare: education and health care. We collect eight indicators of welfare in these services, four in education, and four in health care. Each of the outcomes is further divided into two groups.
In the first group, we include services that are easier to provide, attractive to credit claiming, or both. These types of services increase the electoral profile of councilors, as they are considered as preferred by the electorate and have an intensive advertising effect. In this category, we have school enrollment and infant mortality.
In the second group, we place services that are either considered less critical by voters or that are harder to credit claim. These services do not translate into votes easily or are harder to target and advertise. In our models, we use preventive health care and quality of education as examples of such services.
According to our theory, we should expect that increasing legislature size will have a positive effect on services that voters want and that they can easily target. Whereas, if our theory is incorrect, services that are both hard to credit claim and hard to provide,
and considered as unimportant by voters should also improve. Table3 presents the
results for education and health care outcomes.
The results for education largely corroborate our expectations. Table3shows that
enrollment in elementary schools increased by 2.58 children on average per school with the addition of an extra city councilor. This result represents a change of around 0.20 standard deviations. For grades 5 to 8, council size has no influence. At this point, the dropout rates makes spots on grades 5 to 8 to be oversupplied, meaning that we have more spots than students. For the quality indicators, the results are insignificant,
showing no changes in school quality with larger city councils.8 As expected, the
placebo regressions are also insignificant.
Enrolling a child in a public school in Brazil is particularly difficult in the early years. Although Brazil achieved universal elementary school enrollment, there are still very few spots for schooling until the first grade. Finding public pre-kindergartens and nursery schools is hard, and enrolling is even more difficult, but taking care of a small child puts a considerable burden on parents in poor households. This is a strategic time to contact a councilor, who can facilitate, in this case, enrollment. From
8As education quality takes longer to improve, we look into the 2015 education quality index in the
Online Supplemental Materials. There are null effects, showing that no long-term investments were taken by councilors.
T able 3: Public Service Outcomes Education Outcomes Health Care Outcomes (1) (2) (3) (4) (5) (6) (7) (8) A verage A verage Elem. School Middle School Infant Post-Natal Cov . Family Pr . Born w . 6+ Enr oll. K-4 Enr oll. 5-8 Qu ality Index Quality Index Mortality Mort. Rate Health Pr ogram Pr e-Natal Consult. LA TE 2.58 ∗∗∗ -0.01 -0.04 -0.11 -1.99 ∗∗ -0.90 ∗ -1.67 -4.23 (0.81) (1.07) (0.13) (0.11) (0.78) (0.48) (2.09) (4.01) N Left 10156 7306 8597 5037 12299 5441 19280 15548 N Right 686 581 670 529 1030 672 1297 1030 Ef f N Left 196 475 387 279 513 314 281 615 Ef f N Right 202 312 283 195 390 242 301 438 BW Loc Poly 5.132 11.208 8.724 7.824 7.720 7.183 4.185 8.891 BW Bias 10.615 16.694 15.186 13.714 12.289 10.726 8.310 15.007 Education Outcomes – Placebo Cutof fs Health Care Outcomes – Placebo Cutof fs (9) (10) (11) (12) (13) (14) (15) (16) A verage A verage Elem. School Middle School Infant Post-Natal Cov . Family Pr . Born w . 6+ Enr oll. K-4 Enr oll. 5-8 Qu ality Index Quality Index Mortality Mort. Rate Health Pr ogram Pr e-Natal Consult. LA TE 0.45 0.97 -0.10 -0.12 -1.14 -0.25 1.85 -2.22 (0.61) (0.98) (0.11) (0.09) (1.05) (0.65) (1.25) (2.92) N Left 9040 6350 7529 4243 10614 4449 17198 13861 N Right 1802 1537 1738 1323 2715 1664 3379 2717 Ef f N Left 1186 1138 1202 931 1213 775 2575 1575 Ef f N Right 724 672 734 580 890 557 1483 1004 BW Loc Poly 6.325 6.975 6.686 7.198 4.840 5.360 6.999 5.796 BW Bias 9.860 12.598 10.029 11.004 7.268 7.943 11.213 9.559 Note: ∗∗∗ p < .01; ∗∗ p < .05; ∗ p < .1. RD local linear estimates using Calonic o et al. ( 2014 ) optimal bandwidth quadratic selection and triangular kernel. Robust standar d err ors, cluster ed at the municipal level, in par entheses. Contr ols: population, GDP p er capi ta, number of seats in 2000, year ,and a du mmy for the northeast region. N Left and N Right repr esent the total number of observations on the left and right sides of the thr esh-olds (untr eated). Eff N Left and Eff N Right ar e the number of cases within the bandwidth. BW Loc Poly is the Bandwidth used to compute the Local A verage T reatment Ef fect (LA TE). BW Bias is the bandwidth used to compute the standar d err ors.
the councilor’s perspective, the classroom is there and the politician only needs to pressure the school’s bureaucracy to accommodate an extra child. Such an effort comes at virtually no cost to the politicians, who benefit handsomely from this proposal, as the credit claiming is unquestionable.
The effects on infant mortality rates are also substantial. First, an extra legislator lowers the infant mortality by 1.99 deaths per 1,000 children born. This impact is significant in absolute terms, but in standard deviations, this represents an effect of 0.14, which is reasonable. Second, it decreases post-natal mortality by 0.90 casualties per 1,000 children born. This result also represents a standard deviation of 0.14 in terms of improving these health care outcomes. However, neither the coverage by the Brazilian Family Health Program nor the proportion of newborns that had more than six prenatal consultations change significantly, and even the coefficient signs would be inconsistent with welfare improvements. As expected, the same changes in the placebo regressions were statistically insignificant.
Infant mortality is hard to improve, but it is great for credit claiming and it is highly
electorally sensitive, as it can provide substantial rewards for the councilor.9
Decreas-ing infant mortality—by improvDecreas-ing services, monitorDecreas-ing the health care bureaucracy, mediating hospitalization, or even by pushing the creation of a health clinic in an under-served neighborhood—is considerably easier for councilors to mediate. Im-proving health care is good for campaigning and also has an intense emotional impact on voters, triggering a strong reciprocity behavior in voters who in turn support the
politician (Finan and Schechter 2012).
Conversely, the Family Health Program and improved prenatal care are great ser-vices to prevent future diseases; however, they are either harder to claim credit for or expensive to provide. Preventive health care focuses on lowering the future incidences of becoming ill. If voters do not perceive these chances as real possibilities, they are unlikely to reward politicians who focus on providing those services. Moreover, even
9Survey findings provide further evidence for the fact that Brazilians rank health care higher than
ev-ery other public service. Moisés and Meneguello(2006) run a survey in 2006 asking which are the essential services for citizenship. Brazilian citizens mentioned health care 23.8% of the time; fulltime employment had 16.6% mentions and education 12.0% mentions.
if the voter were fully rational, there are instances when the provision of the service
might be outside her control (Gailmard and Patty 2019). In the case of the Family
Health Program, the municipality has leeway, but the funding is federal, and the cen-tral government mandates the requirements and standards of most of the procedures. From the council-member perspective, these services fall short in their cost-benefit cal-culations, and therefore, politicians will place low priority on and dedicate little effort to improving them.
Hence, there are considerable welfare improvements resulting from a larger city council. Along with other services, most scholars agree that improvements in infant mortality and school enrollment are extraordinary welfare achievements. However, the improvements are skewed toward services that agree with the councilor’s inter-ests. When councilors believe that they can use the services instrumentally to get more votes, they improve. Otherwise, the service receives little to no attention by the councilor.
In any case, our results on health care and education by themselves are insufficient to understand what drives changes in welfare. First, it is unrealistic to think that all politicians have free rein over services and can target and change these services at will. Mayors and bureaucrats mediate most of the access to these services, and they may filter the councilor’s demands in ways that could hinder their credit-claiming capabil-ity. Second, councilors may not perceive the provision of such services as electorally attractive, or the improvements in these services may be caused by policy and legis-lation, instead of councilors direct efforts. Therefore, the micro-level mechanics of the results remain unclear: we need to show that politicians have access to resources and that they perceive the services they are providing as generating high electoral yields. The next section discusses the mechanism, investigating how council size leads to im-provements in certain services.
6
From Council Size to Welfare: Mechanism
City council size causes an improvement in specific welfare indicators, but how? City councilors in Brazil are the lowest-level representatives and are the closest politicians to the population. However, the literature presents them as very inefficient and
clien-telistic (Castro et al. 2009;Lopez and Almeida 2017b;Leal 2012). Thus, the mechanism
that takes us from council size to welfare requires further clarification.
In this section, we discuss the possible channels for the council size and welfare nexus: changes in the representation of women and racial minorities; improved law-making capabilities; increased electoral competition; and greater provision of private and local public goods.
We study three evidential sources: municipal level outcomes on representation and access to municipal services; the content of bills voted by a city council; and an online
survey of former city councilors during 2005–2008.10
Municipal-level aggregated outcomes
Table4presents the results for the municipal-level outcome data. We divide the results
into two panels: in Panel A, we present the alternative explanations for our claimed mechanism. In Panel B, we present evidence that corroborates our arguments.
First, improvements in representation could cause changes in health care and
ed-ucation (Pande 2003; Chattopadhyay and Duflo 2004; Chin and Prakash 2011; Duflo
2012). More councilors from specific groups could shift public-service provisions
to-ward these groups. In columns (1) and (2), we show that neither gender nor represen-tation of non-white legislators significantly improves. These estimates illustrate that our results are not driven by improved representation. We also tested whether com-petition (3) or the approval of legislation by the mayor (4) increased with council size.
10We also had access to 108 structured interviews conducted by Almeida and Felix at the Brazilian
Economics Planning Institute (IPEA) in 2009. These interviews asked councilors about their daily jobs and their representation practices. The interviews reinforced that councilors see private and local public goods as electorally profitable and better in terms of electoral yields than legislating or overseeing executive policies (Lopez and Almeida 2017a).
Table 4: Mechanism Regressions – Aggregated Municipal Level Outcomes Panel A: Representation, Competition, and Legislation Approval
(1) (2) (3) (4)
Num. Female Num. Non-white Candidates Prop. Laws
Councilors Councilors Per Seat Approved Council
LATE 0.22 0.60 -0.19 -0.02 (0.38) (0.85) (1.11) (0.08) N Left 5183 239 5184 3424 N Right 343 158 343 270 Eff N Left 194 47 179 227 Eff N Right 144 47 132 142 BW Loc Poly 8.564 2.954 8.126 11.080 BW Bias 13.569 4.917 12.049 16.921
Panel B: Access to Resources and Patronage
(5) (6) (7) (8)
Mayoral Num. Politically Num. Career Num. Councilor
Coalition Size Appointed Empl. Bureaucrats Assistants
LATE 0.91∗ 105.09∗ 71.57 2.09 (0.50) (62.12) (218.12) (4.37) N Left 5168 15536 15531 5179 N Right 343 1028 1027 344 Eff N Left 240 351 513 99 Eff N Right 161 334 388 101 BW Loc Poly 9.906 6.019 7.695 5.134 BW Bias 15.846 10.170 11.780 8.902
Note:∗∗∗p < .01;∗∗p < .05;∗p < .1. RD local linear estimates usingCalonico et al.(2014) opti-mal bandwidth quadratic selection and triangular kernel. Robust standard errors, clustered at the municipal level, in parentheses. Controls: population; GDP per capita; number of seats in 2000; year; and dummy for northeast region. N Left and N Right represent the total number of observations on the left and right sides of the thresholds (untreated). Eff N Left and Eff N Right are the number of cases within the bandwidth. BW Loc Poly is the Bandwidth used to com-pute the Local Average Treatment Effect (LATE). BW Bias is the Bandwidth used to comcom-pute the standard errors.
Both variables were statistically insignificant.
Panel B in Table 4shows the results for our claimed mechanism. First, councilors
need access to resources in order to want to provide them: a councilor can only provide services the provision of which they can control or influence. In a Brazilian munici-pality, mayors have direct control of health care and education provision, by funding and staffing hospitals and schools. Consequently, councilors need ties with the mayor to access these services. In Brazil, these ties start around a year before the election, in the pre-electoral coalition period. Belonging to the mayoral pre-electoral coalition is an excellent indicator of ties to the mayor and provides access to resources after the election. Column (5) in Panel B shows that the extra legislator has a 91% chance of
be-longing to the mayoral coalition.11 As the extra legislator is a mayor’s ally, she tends
to have more access to public resources.12
Second, city councilors need to staff the municipal bureaucracy in order to influ-ence service provision. Patronage, defined as the appointment of selected bureaucrats to public service jobs, is a powerful way to solve the commitment problems between politicians and bureaucrats: to keep their jobs, politically appointed employees have
to help the appointing councilor get reelected (Robinson and Verdier 2013). Column
(6) of Panel B shows that adding one councilor increases the number of appointed em-ployees in the municipality by 105. This represents a standard deviation of over 0.30, showing that councilors have strong ties with the administration. This facilitates the councilors’ mediation of service provision.
Additionally, the councilors could be affecting the overall administration, which may, in turn, improve state capacity and welfare. In order to rule out this
possibil-11The Electoral Justice allocates seats for parties and coalitions according to their vote shares using the
D’Hondt method. Pre-electoral coalitions have advantages, as they pool all parties votes together. These laws make pre-electoral coalitions crucial for the mayor’s strategy to govern after the election.
12It could also be that the new coalition councilor has facilitated the lawmaking process by the
may-ors. Indeed, mayors are the most important politicians in the municipality, and it could be that we are actually estimating the effects of mayors on policymaking. Moreover, Bueno(2018) shows that mayors and their ties to the central government are crucial for municipal service provision. In the On-line Supplemental Materials, we investigate whether municipalities vary according to their mayoral party composition and municipal city council party composition. We show that the composition of municipal political parties remains unchanged around the thresholds.
ity, we consider the number of career bureaucrats in the municipality.13 The result in Column (7) Panel B rules out this possibility. Finally, city councilors could be hiring employees to work on their staff, which would increase the number of appointed offi-cials without a connection to the municipal service-provision machinery. However, we find a null effect of council size on an average number of council cabinet employees.
Disaggregated data: approved legislation and city councilor’s survey
We need fine-grained evidence that our mechanism operates among the city councilors in their representation practices. To demonstrate the micro-level mechanism at work, we analyzed two datasets. First, we collected and analyzed 346,553 bills proposed in 64 of the 202 municipalities that are within 10 thousand voters from the popula-tion thresholds. We selected these 64 municipalities, which keep their voting records available online.
We separate the legislation presented into four categories: local public goods, municipal-level public goods, oversight, and other types of legislation. Local public goods consist of services that are targeted at the personal, group, or neighborhood
lev-els.14 Examples are fixing potholes, improving a given health clinic, requesting school
bureaucracy to accommodate an extra child, or proposing sewage improvements on a given street. Municipal-level public goods comprise proposals of laws and policies that cover the entire municipality. For instance, a proposal to improve the standards of health care across the entire municipality or to provide training for all the school teachers to meet the requirements for a municipal-level public good. Oversight bills
13Career bureaucrats have to undergo rigorous public selection that afterward prevents them from being
fired for political reasons. These jobs have higher pay and better pension schemes than comparable jobs in the private sector.
14Note that our theory does not differentiate between pure clientelism and local public goods, as it is
hard to disentangle these intentions from a legislator’s service provision. On the one hand, fixing a pothole may be motivated by a request from one particular vote, but it is still a local public good, with non-excludable benefits in the areas in which the construction is performed. On the other hand, a politician could adopt the strategy of helping any person be admitted to a hospital regardless of their previous electoral commitment. This breaks with the clientelistic logic, but it is still considered private service provision. This strategy seems odd, but asKuschnir (2000) shows in her qualitative work, the Silveira Family in Rio de Janeiro did exactly that: they helped anyone that asked for help in the community they represented. As a result, one of the family members was elected with the highest vote share seen in the Rio de Janeiro elections in 2000.