An innovative food truck chain, strategic planning inspired
from the lean start up methodology
Paul Tavares Peñate
Project submitted as a partial requirement for the conferral of Master in Marketing
Supervisor:
Maria Conceição Santos, Assistant Professor in Marketing, DMOGG
III Apresentação do Projeto (Portuguese abstract)
Suportada pela abordagem Lean , o Projecto apresenta um modelo de negócios de uma nova marca de Food Truck, inicialmente a ser lançada na Bélgca. Foodies’TruckZ é a marca sugerida para um novo modelo de negócio de Food Truck que procura inovar alavancando economias de escala, sobretudo em Marketing, e através de uma frota co-propriedade das carinhas food truck. Neste modelo de negócio a partilha no investimento do camião, na comunicação e outros aspectos de marketing e das operações, permite a quem gere as operações de cada camião uma abordagem menos arriscada pelo menor investimento inicial e uma marca global entre vários camiões.
A idéia é criar uma frota de co -propriedade caminhões de alimentos entre Foodies ' TruckZ e empresários de caminhões de alimentos (os chefes de cozinha) que serão geridos também em partilha pelos Chefes (na preparação do menu) e a Foodies ' TruckZ com o responsabilidade na concepção, monitorizaçlão, consultoria de marketing, a análise dos mercados e estudos, a criação de menus e otimização, o trabalho administrativo e o lobbying da administração e outras operações possíveis de serem transversais aos vários camiões. A vantagem competitiva da Foodies TruckZ será seu potencial significativo de economia de escala, em comparação com os proprietários individuais de caminhões de alimentos como resultado de:
uma rede optimizada de abastecimento
partilha de concepção e preparação dos menus e cozinha
partilha de espaço de escritório
marketing e comunicação em sinergia
partilha do conhecimento do mercado
IV Project Presentation (English Abstract)
Foodies’ TruckZ is an innovative food truck chain business that leverages economies of scale where market expertise builds a strong and profitable co-owned fleet of Food Truck businesses. It offers a solution by:
Solving food truck entrepreneurs’ frustrations by allowing them to start their business
with a less risky, less expensive and seamless approach
Leveraging economies of scale in sourcing, marketing and management
Developing an internal expertise of the food truck industry for operation management,
regulations and marketing management of the business
The idea is to create a fleet of co-owned food trucks between Foodies’ TruckZ and food truck entrepreneurs (the Chefs). The operation will be managed physically by the chefs, while Foodies’ TruckZ will be responsible for back office supervison. This structure will allow for a faster and more expandable business model.
Foodies’ TruckZ will act as a strategic advisor and decision maker for the food trucks operations. The company will manage: the operation optimization, the marketing and communications, the markets analysis and studies, the menu creation and optimization, administrative paper work and administrative lobbying. While the Chefs will make sure that their food truck day to day operations run smoothly and deliver the best product to the customers.
Foodies TruckZ major competitive advantage will be its potential for significant economy of scale in comparison to solo food truck owners, as the result of:
an optimal supply network
shared preparation kitchen space
shared office space
marketing and communication synergies
shared market knowledge
V
In gratitude to my thesis supervisor Maria Conceição Santos. Thank you to my friend and future partner Nicolas Gerin for opening my mind to the Lean Startup. Thank you to the academic staff of ISCTE for allowing me to develop my marketing and entrepreneurial ambitions. First and foremost I would like to thank my parents, my brother Erick and my friends for their support during all these years. Lastly, thank you also to Kristin L. Boeck for proofreading this work and for her support.
VI Table of Contents
Apresentação do Projeto (Portuguese abstract) ... III Project Presentation (English Abstract)... IV
I. Executive Summary ... 7
II. Summary ... 11
A. How does it work? ... 12
B. The opportunity and risks ... 12
III. Literature Review and reference framework ... 13
A. Strategic Planning tools ... 13
B. Environment analysis tools ... 17
C. The Market Study ... 21
D. Development and Implementation ... 24
E. Operational Marketing and Positioning ... 26
IV. Market Analysis ... 31
A. Organisation Environnement Analysis (Internal Analysis) ... 34
B. Value Chain Analysis ... 34
C. VRIN analysis ... 37
D. Competitive Analysis (SWOT) ... 38
V. Market Study ... 39
VI. Development and implementation strategy ... 41
A. Strategic Statement ... 41
1. Mission ... 41
2. Vision ... 41
3. Values ... 41
B. Growth engine ... 41
C. Business Model Canvas ... 42
D. Strategic Marketing ... 44 1. Segmentation ... 44 2. Targeting ... 45 3. Positioning... 45 E. Operational marketing ... 45 1. Product/Brand ... 45 2. Place ... 48 3. Price... 48
VII
4. Promotion and communication ... 49
VII. Financial Evaluation ... 55
A. Business Model summary ... 55
B. Assumption ... 56
1. Fleet size & number of head office employees ... 56
2. Daily Sales target ... 56
3. Pricing ... 57
4. Margins ... 57
5. Company Cost Budgeting ... 58
6. TruckZ and TrailerZ cost budgeting ... 60
C. Financial viability (Results forecasts) ... 60
D. Chefs counterparty analysis ... 62
E. CF position forecast ... 64
F. Cash Flow Position analysis data ... 65
VIII. Conclusion... 66
I. Executive Summary
The changing economic environment is one of entrepreneur main challenge and opportunity. Eric Ries recent research on the Lean Startup (2011) tries to provide an alternative approach to create a business. The Lean Startup aims to chase any waste from the business creation process using the “Build-Measure-Learn feedback loop” tool the organisation will be able to create a flexible and scalable Business Model. This approach as became a full part of the entrepreneurial scheme with companies has big as “Procter and Gamble” starting to develop innovation strategies similar to the lean Startup (Brown, 2010).
This final project was written as a conclusion to the Master of Science in marketing program at the ISCTE Business School (Lisbon). This thesis entitled “An innovative food truck chain, strategic planning inspired from the lean start up methodology” aims to provide future entrepreneurs a clear vision of the strategic planning tools available to create their business and to bring them an illustration of a Food Truck Chain business planning based on the Lean Startup methodology.
To achieve this goal a critical literature review of the existing strategic planning tool available to entrepreneurs and an analysis of their main differences, strengths and weaknesses was conducted. This showed Eric Ries (2011) approach innovative strength as an alternative way to create a new business without overexposing entrepreneur to important financial risk. The following major differences were identified in comparison between the Lean Startup approach and classic business planning: the lean startup avoids the practice of market studies and financial forecasting; this more practical approach focuses on collecting solid “validated learning” data directly from the market.
The literature reviews shows that the Lean Startup approach in association with the more classic tool of Business Plan and Business Model Canvas from Osterwalder’s and Pigneur (2011), it becomes a very solid tool to plan the launch of a new venture. In addition the literature review explores some practical Market analysis tool to back the business strategic planning.
This work presents an illustration of a combined Lean Stratup approach, Business Planning and Business Model Canvas for an innovative Food Truck chain business called Foodies’ TruckZ. It applies the Lean Stratup teaching methods to the classic business planning in order to keep the best of both methodologies.
8
Foodies’ TruckZ is a co-owned Food Truck chain that allows entrepreneurs to invest seamlessly in a food truck at a minor cost. The chain will cover most of the “painful” elements linked to running a food truck business while simultaneously providing essential strategic and operating advisory to increase entrepreneurs’ performance. The following diagram provides a visual representation of the relation between the chain and the entrepreneurs.
Relation between entrepreneurs and Foodies’TruckZ
Figure 1 Illustration of the relation between entrepreneurs and the chain As showed in the upper diagram the entrepreneur invest 49% of the initial cost of the food truck while Foodies’ TruckZ invest the 51% remaining. In exchange the entrepreneurs will give the chain a commission (15% for trailers 30% for trucks) and cover their share of the food truck chain expenses (staff, marketing, advisory, legal, office etc.). The chain on its side will provide the operating staff (extra cook), take care of advertising, monitor the market, set up the supply, and make a preparation kitchen and storage available to the chefs.
This structure allows the entrepreneurs to invest in a food truck at lower cost, lower risk and provides them a seamless approach to create their very own food truck. This ownership structure allows to create significant economies of scale by negotiating supplies at better deals, creating marketing synergies, centralizing accounting, regrouping sourcing, sharing preparation and private kitchen space.
9
The financial analysis of the business model shows great potential for both TruckZ chefs and Foodies’ TruckZ organization. With an initial investment of a minimum of 38’000€ the team should be able to set up and run the business self-sufficiently.
The document presented an extensive strategic marketing analysis which should act as the foundation for the venture launch. The business strategic planning of “Foodies’ TruckZ conducted in this document suggested 5 key strategic action for the team to take. These where the result of a SWOT. They are:
Recruiting expert in Food Truck operations
Creating an MVP (first 3 TruckZ)
Starting the implementation of the testing feedback loop
Lobbying local administration to secure high sales potential locations
Reaching out for high potential Chefs whiling to get into the food truck business
These emerge from the 7 key success factors from Porter and PESTEL analyses which where:
Generating significant economy of scales
Keeping short order fulfilment time
Preserving proximity with clients
Maintaining competitive pricing
Lobbying administrations
Reaching different segmentations of the market
Expanding fast
And from the internal VRIN and value chain analyses which suggested to:
Create an innovative organization
Use a Lean Start Up approach
Expand quickly to generate larger economies of scale
A short market study set the foundation for the financial analysis of Foodies’ TruckZ business model. It also allowed the team to confirm their assumption that most food truck don’t allow enough strategic management and marketing.
The development and implementation strategy showed that Foodies’ TruckZ’s mission is to create a better place for food truck entrepreneurs and food lovers.
10
Finally the financial analysis around Foodies’ TruckZ business model revealed that the business is financially viable and could finance its working expenditure after 3 months of operations and for an total investment of 38’000€. The financial analysis confirmed that the business model is viable for both chefs and the chain if Foodies’ TruckZ versus Chefs commissions over revenues are 15/85% for trailers and 30/70% for food trucks. It also forecasted that the chain could potentially reach a total revenue of 2,2million € during its third year of operation.
11
II. Summary
This final dissertation describes and applies an innovative business strategic planning based on Eric Ries’s (2011) Lean Startup approach to business creation.
It presents the existing literature of strategic planning and some useful models that are part of it, with a focus on keeping the positive elements of each models. It then applies these model to create an innovative business plan for a food truck chain business based on a co-owned truck structure operated under the strategic supervision of an expert team of managers. The business plan shows an existing opportunity for this venture to grow and survive in this developing industry.
In perspective this work provides business practitioners and a literature exploration of a new innovative business planning methodology that combines Eric Ries (2011) Lean Startup approach with the more traditional tools of a Business Plan (Sahlman, 1997) and Business Model Canvas (Dubosson-Torbay, et al., 2001). Additionally it provides an illustration for a food truck chain business.
12 A. How does it work?
TruckZ owns a fleet of food trucks which are owned at a majority of 51% by TruckZ and 49% by the food truck chefs. This ownership frame allows TruckZ to keep the strategic leadership on its Food TruckZ fleet. The trucks profits are then split according to the business model. From a food truck entrepreneur point of view, this is a more accessible and less risky approach. Benefiting from the expert advice of the chain, Chefs should be able to accomplish higher sales performance than they would on their own. Moreover, the highly proactive management and back office work of the chain should guarantee them a significant competitive advantage in comparison to individually owned trucks in terms of larger economies of scale. It is also a seamless investment approach for an entrepreneur, as Foodies’ TruckZ will provide them with a lot of the challenging aspects of the business including but not exclusively: ingredients supply, truck/trailer supply, operating staff, market analysis, legal and administrative aspect of the business, marketing and communication.
B. The opportunity and risks
Foodies’ TruckZ employs a rather measurable business model with large growth potential in an outgrowing industry. The business model is consistent and agile; therefore, it enables the company to react to the industry changes and quick shifts. The risk is split through the different types of trucks and their geographical location. However, since the trucks are co-owned they represent a relatively small investment compared to potential profits.
The financial risk of starting such a business is relatively small, especially when applying a lean start up approach to the business creation (explained in the literature review).
TruckZ will naturally edge the risk of failure as the business grows and the truck fleet increase and diversify over different market segments and geographical zones.
13
III. Literature Review and reference framework
This section intends to define the concepts used to build the Foodies TruckZ business plan. It provides a summary of existing researches relevant to the subject and explores important models used throughout this master thesis.
The first key concepts to be addressed are those relating to the Business Plan, Business Model and Lean Startup Methodology. The second concepts to be addressed focus on environment analysis tools including: Porter, Pestel, VRIN, Value Chain and SWOT. This analysis is backed by models which allow for the creation of a market study questionnaire. This section is followed by a research over the strategic statement. Finally models of development and implementation are reviewed as part of the entrepreneur’s strategy guide for success.
A. Strategic Planning tools
A Business Plan (BP) should be the roadmap of every entrepreneur, for, “every traveller knows, a journey is lot less risky when you have directions”. A business plan appears to be the
reference tool to convince an executive board of investors. It should explain four key elements
of the business, “the people, the opportunity, the context and the risk & reward”. The people refers to the humans involved in the project, including outside parties. According to Arthur Rock, world famous venture capital (VC) involved in the formation of Apple, Intel and Teledyne, investors “invest in people, not ideas”. The foundation for this thought being that if you invest in the good people and they appear to be wrong on the product they make a switch. The opportunity is the analysis of the venture product environment. This includes the market conditions, the industry’s attractiveness, the product value proposition and the competitive environment. The opportunity should be carefully studied in the business plan. It is crucial to be sure that the costumers are “ready to pay for the product and that you have an economically viable access to customers.” The context analysis ensures the venture viability in the long run. Trends and arbitrage opportunities are never long term viable opportunities. Finally, the risk &
reward comprises the financial aspects of the project, studying costs and revenue forecasts over
short and mid-term: between 1 and 10 years. (Sahlman, 1997)
Recently, a more modern approach to strategic planning appeared in the scientific literature and in business practices: The Business Model (BM) and the New Generation Business Model. Such literature offers different definitions of the Business Model; however, we will adhere to the two most accepted ones:
14
“The architecture of a firm and its network of partners for creating, marketing and
delivering value and relationship capital to one or several segments of customers in order to generate profitable and sustainable revenue streams” (Dubosson-Torbay, Osterwalder, & Pigneur, 2001).
“A Business Model describes the principles by which an organization creates, delivers
and captures value”. “Put simply it’s the Logic by which an enterprise earns its livehood”.
These definitions already reveal the divergence between the two concepts of Business Planning and Business Modelling. As specified in the definitions above, the Business Model focuses on a design intensive approach. Osterwalder & Pigneur’s models provide an analysis tool to explain “how organizations provide value to customers”. This notion is better known as the Business Model Canvas, or a model that divides a business in 9 interacting components. The Canvas aims to link these 9 components in order to create a value generating system. (Osterwalder & Pigneur, 2010)
Graph 1 The Business Model CANVAS (Osterwalder & Pigneur ,2010)
Eric Ries, the author of the Lean Startup (2011), reveals the failures of conventional Business Planning. Ries condemns entrepreneurs for providing only the “rosiest” picture of their business in an attempt to convince an executive board of investors. Ries describes the classic approach of Business Planning as a selling tool which fails to challenge entrepreneurs’ assumptions or provide them with guidelines to run their business in the long run. He also criticizes the static dimension of these models, as they are not designed for an agile environment. The Business
15
Model Canvas does, however, challenge entrepreneurs to help them understand how their business works and how it generates value. Yet, it still fails to provide them with long term manage guidelines. Ries also accuses the BP and BM of being solely based on the entrepreneurs’ visions and assumptions. These are the “leap of faith assumptions” that entrepreneurs make about their product and market.
Ries’s Lean Startup approach can be seen as “a scientific methodology for business creation”. It is, in fact, a methodology that aims to help entrepreneurs to create a lean and agile organization where development is based on data verified assumptions. A Lean Startup is a Lean Institution that is able to generate sustainable, disruptive innovation through the implementation of a “Build-Measure-Learn” feedback loop. The Lean Startup resides in five
principles:
1. Entrepreneurs Are Everywhere: being a startup doesn’t mean your company operates from a garage.
2. Entrepreneurship Is Management: startups are institutions that require management; they are not only a product but a “new kind of management specifically geared to its context.”
3. Validated Learning: startups “exist to learn how to build a sustainable business.” Leap of faith assumptions should be scientifically validated through an experimentation process.
4. Build-Measure-Learn: startups turn ideas into a product as part of a “build-measure-learn feedback loop”. Therefore, after the build step they focus on “measuring how customers respond to the product, and then learn whether to pivot or persevere.” A successful startup should always work on accelerating this feedback loop. The shorter the feedback loop the more agile the institution.
5. Innovation Accounting: today’s environment and data availability allows the use of new more representative and more specific accounting: “innovation accounting”. This is the most efficient way to measure the real progress of a startup. Ries accuses “vanity” metrics of showing a false image of a business and therefore recommends relying on actionable metrics to properly interpret data and transform than into learning. (Ries, 2011)
16
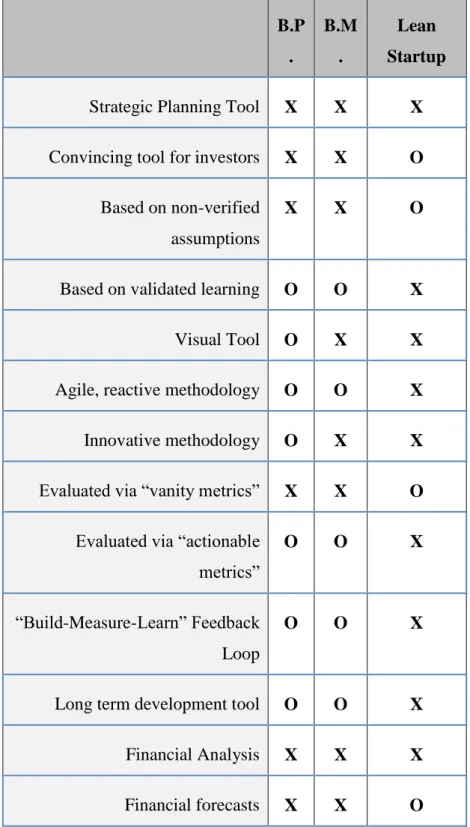
A recapitulative view of these three approaches is proposed hereunder. It creates a clearer depiction of the main differences between these three complementary models.
Differences between the 3 Strategic planning tools of B.P, B.M. and Lean startup
B.P . B.M . Lean Startup
Strategic Planning Tool X X X
Convincing tool for investors X X O
Based on non-verified assumptions
X X O
Based on validated learning O O X
Visual Tool O X X
Agile, reactive methodology O O X
Innovative methodology O X X
Evaluated via “vanity metrics” X X O
Evaluated via “actionable metrics”
O O X
“Build-Measure-Learn” Feedback Loop
O O X
Long term development tool O O X
Financial Analysis X X X
Financial forecasts X X O
17
The methodology chosen for this project’s strategic planning will be a consensus among these three approaches. The suggested strategic planning tries to include all positive aspects of the three approaches.
Thus, the strategic planning will follow a “conventionnal” structure while simultaneously incorporating the Lean Startup and Business Modeling key elements. Therefore, this “innovative business plan” is divided into five main chapters:
Market analysis which includes both an internal and external environment analysis
Market study which lays the foundations of the entrepreneur’s leap of faith
assumptions (the loop zero of the build-measure-learn feedback loop).
Development strategy which provides a strategic vision of the business using strategic
tools.
Milestone planning which allow the team to visualize what is coming next and provides
a roadmap of the targeted achievements
Financial study provides a first look at the potential financial viability of the business
model. It focuses on costs budgeting and quickly projects the potential financial results of the company according to the leap of faith assumptions which are based on the market study. These should not be seen as forecasts.
B. Environment analysis tools
The strategic planning of this project will require an attentive investigation of the institution’s external environment. This will be based on two major models: the Porter analysis and the PESTEL analysis.
Porter’s model aims to define an industry structure. This is particularly useful when studying
the external environment of an institution. Porter’s model defines the industry’s structure and values its attractiveness in terms of “competitive intensity”. A postulate of Porter’s model states that the fundamental mission of an organization is to obtain a competitive advantage, where competition is define as “any power to harm one’s capacity to generate profit or to limit its competitive advantage”. Porter’s model focuses on identifying 5 forces in the environment:
threat of New Entrants,
threat of Substitutes,
the Bargaining power of Buyers,
the Bargaining power of Suppliers,
18
The Porter model aims to list and classify these forces so that the manager can identify the “Key
success factors” of his environment. These are the strategic elements that the organization must
obtain to gain a competitive advantage. (Porter, 1982; Johnson et al., 2011)
PESTEL’s model aims to influence the large influence variables that impact all industry
players. These are classified into 6 major environment influential variables:
Political: these highlight the power of government and public powers.
Economical: these are the economical macro-economic constrains.
Sociological: these are the cultural and demographic variables that might have an
impact to the organization.
Technological: these are the technological breakthrough, the innovations around an
industry that might be game changers.
Environmental: these are the ecological aspects that influence a market
Legal: these are the legislator potential restrictions or norms imposed to the market.
PESTEL’s analysis should always include an identification of the changing elements that have a potential, significant power to impact the industry’s structure. These are called “pivot
variables”. (Johnson et al., 2011; Thomas, 2007)
In addition to this external investigation, two other models will be applied to diagnose the institution strategic capacity: the Value Chain analysis and the Value Rare Imitable Non-substitutable (VRIN) analysis.
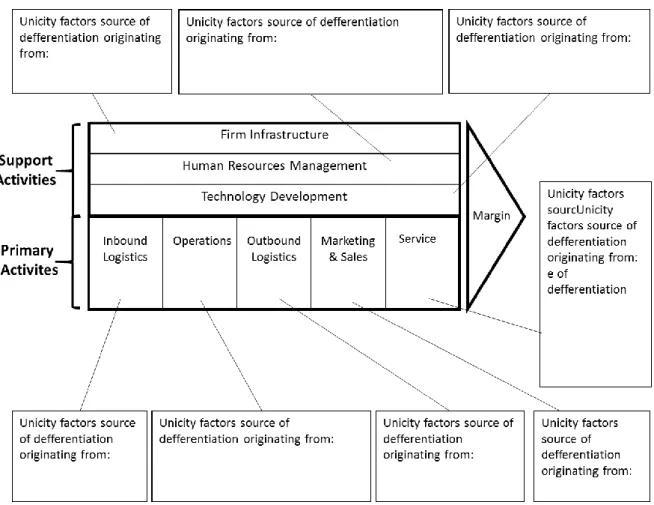
The Value Chain analysis was developed by Porter in 1985; it describes the steps that occur within an organization to create value for their customers. This analysis relies on a company description based on “a set of activities performed to design, produce, market, distribute and support its products”. The analysis aims to identify the “unicity factors” of an institution. These are the company controlled elements that are a source of differentiation from the competition and generate value. These elements are split into two segments:
The primary activities directly involved in the value creation:
o Inbound logistics: the supply material involved in the product manufacturing that are sources of value to customers.
o Operations: efficient operations clearly add values to the final product by avoiding manufacturing defect, reducing retail price…
19
o Outbound logistics: adding value source can be reducing response time to orders
o Marketing & Sales: great marketing can be source of value and competitive advantage. It is important to convince customers of the offer’s value.
o Services are part of the value proposition.
The support activities contribute to the effectiveness and efficiency of the primary
activities:
o Firm infrastructure: information systems, finance, planning, and quality control.
o Technology & development
o Human Ressource (HR) management: recruitment, training, development and motivation of individuals.
(Lambin et al., 2008; Johnson et al., 2011)
The analysis is presented in comprehensive, visual diagram hereunder.
20
The value analysis will help us determine the internal venture environment and determine its strengths and weaknesses.
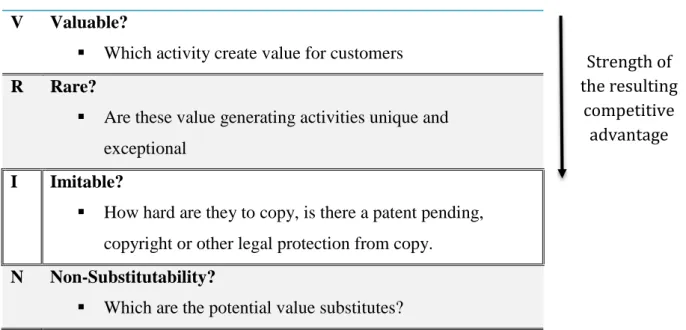
The VRIN analysis identifies the Value, Resources, Imitable and Non-substitutable components of an organization and its product. The four elements are presented into a table as follow (Johnson et al, 2011; Lambin et al., 2008):
V Valuable?
Which activity create value for customers
R Rare?
Are these value generating activities unique and exceptional
I Imitable?
How hard are they to copy, is there a patent pending, copyright or other legal protection from copy.
N Non-Substitutability?
Which are the potential value substitutes?
Figure 3 VRIN diagram canvas inspired from Johnson et al. (2011)
The Strength Weaknesses Opportunities and Threats (SWOT) model is a visual tool that summarizes the external environment KSF and Pivot variables from Porter’s and PESTEL’s models (Threats and Opportunities) and the internal environment Strengths and Weaknesses obtained through the Value Chain and VRIN analysis. The SWOT analysis aims to establish an adequacy between the organization’s strategic capacity and the key success factors of its environment by taking action on one of these. This means to either secure new resources/competencies, reaching a new market or “revolutionizing” the market practices. The SWOT can be seen as an intuitive presentation of the external and internal environment analysis. It provides a wider view of Porter, PESTEL and the strategic capacity analysis. The following graphic suggest a visual presentation of the model. (Johnson et al., 2011)
Strength of the resulting
competitive advantage
21
Figure 4 SWOT diagram canvas inspired from Johnson et al. (2011) After concluding the environment analysis, the various strategic planning tools suggest that the venture founders plan proper business objectives and milestones. These are usually represented in the form of key objectives as way of minimizing the list timeline. Within these you should finds the key elements of the development strategy and the implementation
strategy.
C. The Market Study
The market study is a useful tool when building the team’s first “leap of faith assumptions”. Though according to Eric Ries it should only serve as an indication to guide the entrepreneur team’s leap of faith assumption founding the MVP. The survey can’t be viewed as possible validated learning as it can by biased in comparison to “validated learning”. (Ries, 2011) Survey method should follow strict recommendation. Commandments to the writing of good survey questions involve:
“Subtle wording differences can produce great differences in results”
“Questions placed out of order or context should almost always be avoided”
“Be specific in what you want to know”
22
“Respondent may not want, or may not be able to provide the information requested”
“Do you have all the options covered”
“Unbalanced scales may be appropriate for some situations and biased in others”
“Never ask two questions simultaneously”
“Answers should always be independent”
“Long questions should be used wisely”
(Lloyd, 2013)
It is also important to mention the existing disparity between a “questionnaire respondents fill out themselves and one that a professional interviewer administers”. The latter one of these requiring particular guidelines:
“It should be simple, straightforward, and logical.”
The questionnaire “should assume the respondent has an eight-grade education.”
“Interviewer-administered questionnairs can easily accommodate skip patterns”.
“Knowing what questions should be asked early on in the questionnaires, in the middle,
or towards the end.”
“Understanding how to phrase questions.”
“Being sensitive to the questionnaire length.”
(Kaden, 2006)
Särndal et al. propose a methodology to structure the building of the survey which is summarized by the following graph:
23
Figure 5 Total survey design process (Särndal et al., 2013) These tools will allow the creation of a market survey that will then be submit to a sample of Food Truck owners to guide the team leap of faith assumptions.
The strategic statement is a communication and motivation tool (Verma, 2009 in Cady et al., 2011). It includes the "core values and sense of purpose beyond just making money that guides and inspires people throughout the organization and remains relatively fixed for long periods of time" (Collins et al., 1997 in Cady et al., 2011).
The strategy statement will clearly inform decision makers so that they don’t have to interpret the company’s strategy themselves. The statement should answer the question “how does the
24
organization make a difference?” (Montgomery, 2008). The strategy statement is sometimes referred to as an “identity statement,” “mission statement,” “value statement,” etc. Note that all such terminology serves to summarize the strategic intention of the organization. (Cady et al., 2011)
Johnson’s et al. divides this “identity statement” into three major elements: Mission, Vision and Values:
The Mission: is the organization’s assertion of its fundamental values; the reason for its
existence. It answers such question: “What is our business?” “What would be lost if the organization no longer existed?” “What is our difference?”
The Vision: is what “the organization’s aspires to become.” The vision is supposed to
“aspire and motivate,” as well as answer the question: “what do we want to achieve?”
The Values: are the commandments, rules or principles which the organization obeys.
They “underlie the strategy and define how the organization should act.” They should remain rigid throughout time. (Johnson et al., 2011)
D. Development and Implementation
The development strategy framework should be developed as an analysis of the institution’s
growth engine. This is the “company’s invisible force that drives its growth.” According to
Ries, it “should be designed to keep the startup team focusing on what really matters” (2011). Three engines of growth are defined in Ries’s approach: the sticky engine of growth, the viral engine of growth and the paid engine of growth.
The sticky engine of growth relies on the customers’ retention and is therefore tracked through customer retention rate. In addition an organization relying on this engine should track their attrition or churn rate (“the fraction of customers in any period who fail to remain engaged with the company’s product”). In fact, these companies should achieve a higher
retention rate in comparison to their churn rate (compounding rate). (Ries, 2011) The viral engine of growth is based on the fact that customers will spread the awareness of the
product. Companies using this growth engine use word to mouth as a spreading tool, making customers acting unintentionally as brand evangelists. Examples of companies using this engine are Tupperware, Facebook, and Instagram. This growth engine can be measured using a viral
25
coefficient, or the measure “of how many new customers will use the product as a consequence of each new customer who signs up.” This means that a company achieving a viral coefficient above 1 should achieve exponential growth. Note that depending on the organization business model, other metrics can be essential source of growth. Social networking, for example, relies on indirect advertising and therefore should value the time people spend on their platform. Whereas Tupperware should additionally focus on increasing their costumers’ lifetime value. (Ries, 2011)
The paid engine of growth is the more traditional engine; basically it relies on acquiring new customers based on advertising or commercial investments. Two metrics should measures these organizations performance: the cost of acquiring a new customer (CPA- cost per acquisition) and the revenue each customer brings (LCV-Lifetime customer value). (Ries, 2011)
This leaves the paid engine of growth businesses with two choices: they can enhance their growth by increasing the LCV of each customer or they can reduce their CPA.
The implementation plan focuses on creating an operational marketing plan and building the right Build-Measure-Learn feedback loop. Operational marketing is divided into two analyses: a strategic marketing analysis and an operational marketing analysis. These are define as:
Strategic marketing
The strategic marketing analysis studies the market in a three step approach that is explained by this diagram:
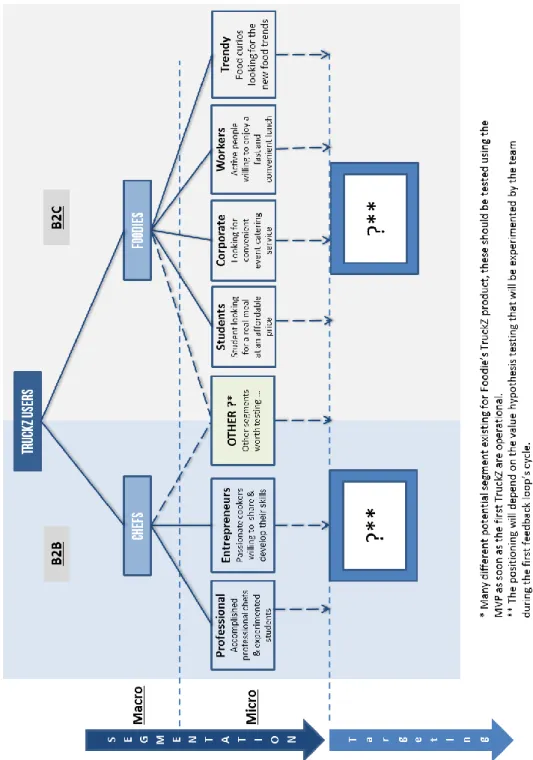
The segmentation is “the division of the total market into subsets, called “segments.”
Such can be divided in regards to homogeneous view of the needs, behaviors or purchases and may constitute distinct potential markets motivations”. The company can chose to either develop a:
o Macro Segmentation which identifies the products, market or industry. These are respectively: “a particular solution to a generic problem for a specific client group”; “a solution aggregate which answers a determinate need or a group of client”; “a solution which answers any needs for all client groups”.
26
o Micro Segmentation which divides the market in a sub-segment of customers valuing similar product attribute cart.
The targeting is the strategic selection of one or more of client segments that the
organization wants to range. The targeting can be concentrated or wide depending on the market and strategic objectives of the organization.
(Lambin & de Moerloose, 2008)
The positioning is the development of an operational marketing plan. It is the act of
designing a brand and its image in order to differentiate it from competition from a costumer perspective (Ries & Trout, 2000). This operational marketing plan is develop using the 4P’s analysis hereunder.
E. Operational Marketing and Positioning
Positioning is typically achieved through a 4P’s analysis. This is a study and planning of a company’s product, place, price and promotion in accordance with its competitors. The 4P’s are defined as follows:
Products or Brand Analysis
A brand or product both presents specific attributes (tangible and intangible) that represents one of the company’s differentiation sources and/or competitive advantage. In order to compare a company’s product with its competitors, it is interesting to define whether a product has a set of attributes, called the “attribute cart”. These are the functional values of a product and the surrounding value adding features that it possesses. These additional features can be split between the essential, necessary features and the other. These are usually presented in an onion shape diagram in which the core represents the basic features, surrounded by the necessary features and finally, the additional features. Another useful tool to analyze an institution product or brand is the product/brand identity prism. It is usually represented as shown in the following diagram. (Lambin et al., 2008).
Another tool used to visualize the brand identity is the brand identity prism. Developed by Kapferer (2004), the prism is presented as follows:
27
Figure 6 Brand Identity prism canvas inspired from Kapferer (2004) The prism defines the six facets of brand identity:
Physics: physical characteristic of the brand
Personality: human like features; brand’s temperament
Culture: value system, inspiration and reference universe of the brand
Relation: climate relationship inspired by the brand
Reflect: the external image that as it is experienced by the target/customer, even
though it does not actually match the target
Metallization: internal mirror of the target/image of the brand’s users
manipulation of the product (Kapferer, 2004)
Name
The name of the company is a sensitive parameter of a venture. It should be carefully studied and choosen. It will support the brand positioning as “the point of attachment between explicit and implicit information conveyed around a product” (Lambin et al., 2008).
The company’s logo is its visual identity. Recommendations to create a logo include:
Simple: a logo needs to be easily remembered and kept in mind. “Logos
28
Versatile/adaptable: “Does your logo work well on a billboard, business
card, brochure, or t-shirt?”
Web friendly: a logo should be easily adapted into a web bottom or icon
Coherent: representative of the company’s culture (values and identity)
Unique: a logo must be recognizable among the mass of other existing
logos
Timeless: a logo should not become easily outdated
(Schmidt, 2012; des Marais, 2014; Glaser, 2014)
Slogan
The company’s slogan is a short, remarkable and unforgettable catchphrase. It should be used to advertise the product. Commandments in regards to creating a good slogan include:
Keeping it short and simple
Making it rhyme
Descriptive: describing what the company offers and its commitment
Story telling
Honest about the organization and/or product.
Highlighting the key benefits
(Cody, 2013; Young Entrepreneur Council, 2013; Smith, 2014)
Place
The place analysis allows the venture to match their offer with the demand. It is sometime necessary to involve third parties to match this offer and demand. The place analysis studies the organization of the involved parties in the product distribution and its channels. (Lambin et al., 2008).
29 Price
The price represents the monetary expression of the value customers give to a product (Lambin & al., 2008). It is essential to be able to determine it precisely in order to maximize sales and profit.
Promotion and communication
A key pillar of the 4P’s analysis is the promotion analysis, which studies how a company will promote and communicate its product to the market.
The means of marketing and communications are according to Lambin et al. (2008):
Sales power: “communication « customized » personal and bilateral providing
information to the company and is designed to encourage customers to take immediate actions.”
Sales promotion: “incentives that are non-permanent and often locally,
strengthen the work of advertising and/or sales force and are implemented in order to generate, with target referred, creating or changing a purchase behavior.”
External relations or publicity: which aims to “establish, by deliberate effort,
planned and sustained psychological climate of understanding and mutual trust between an organization and its audiences”
Direct marketing: is the “means of direct sales like direct mail, telemarketing,
catalogue sales, online sales, etc.”
Media publicity: “mass communication, paid unilaterally from an advertiser
presented itself and designed to support directly or indirectly the activities of the company.”
These means can be developed using the following theoretical frameworks: a communication
plan, a star strategy analysis and a media plan.
The communication plan can be based on Harold Lasswell 5 W’s communication plan: “who says what to whom in what channel with what effect”. Or in the form of a table:
30
Table 2 Marketing communication plan inspired from Libaert (2013) While the star strategy is the identification of the physical treat, the personality and the tone communication of the product or brand should be made on. It is typically presented in the form of a table. (Lambin et al., 2008)
Lastly, the Media plan is the study of the respective strengths and weaknesses of the different media adapted to the product or brand. It is also presented in the form of a table.
Medias Types STRENGTHS WEAKNESSES
Daily Press …
Magazines …
Table 3 Media Plan Canvas inspired form Kotler (2006)
Communication objectives Messages (what) Targets (whom) Means (with) Evaluation (what effect)
31
IV. Market Analysis
In 2012 Intuit estimated that food truck industry revenue in the United States would jump from 650 million in 2012 to 2.7 billion by 2017 (Intuit, 2012). In fact, the Food truck industry has been thriving over the past 10 years, beating recession and showing over 12.4% industry revenue increase over the past five years. In 2014 the U.S. food truck market was worth $856.7 million, showing 3.5% annual growth over 2013 (IBIS world, 2015; Statistic Brain Research Institute, 2015; Intuit, 2012). In the EU “food trucks have grown at a very strong rate” and according to Fabrice Willot, president of the Belgium Food truck association, the number of food trucks should increase and stabilize by 2020, around 600-700 units for the Belgium market only (Zucchi, 2015).
The U.S. market represents more than 4000 trucks nationwide, with average yearly revenue per food truck of $290’556 (Statistic Brain Research Institute, 2015). It is interesting to note that U.S. more matured market has already been infiltrated by food chain giants like Jack In the Box, Sizzler and Taco Bell (Jonelle, 2012).
Pivot variables
PESTEL’s framework allows us to identify TruckZ Pivot variables as follow.
Political: Governments have limited influence over the food truck industry as long as
the country remains politically stable and that regulation is enforced consistently.
Economical: the Food truck industry as proved to be solid over the last years despite
the crisis. On a macroeconomic level the food industry is still at growth and mobile catering is a high growth potential branch of it. (Intuit, 2012) Regarding the food truck industry’s sensitivity to macroeconomic variable, it should be noted that TruckZ supply cost will highly depend on both the food industry and the energy market. Macro shifts in aliments and energy pricing will directly impact TruckZ costs/pricing.
Sociological: people have proven their interest for food trucks in the U.S.A. and other
part of the world. There are no real sociological or cultural drawbacks in regards to the food truck industry.
Technological: the industry’s primary technological challenge is accumulating
sufficient energy to exploit the trucks without requiring an external power supply source. Consistent technology already exists with long lasting batteries and fuel cells.
32
Upcoming innovation will surely optimize these technologies, though no disruptive technology seems to be on the edge of breaking out.
Environmental: the food truck industry doesn’t appear to be directly impacted by the
ecological environment. Though, as with all industrial endeavors, it does inevitably impact the environment and responsibility should be taken.
Legal: the legislation has significant influence over the food truck market. They have
the power to regulate the market’s competition and geography through regulations. In this particular market, the legal environment exists as the main drawback for the food truck industry. The Legislative power can therefore be seen as a threat or opportunity depending on the situation. (Jonelle, 2012)
The emerging Pivot variables are:
Legislation of the industry by country and cities
Energy storage technology
Energy & Food market industry pricing
Key Success Factors
Porter’s analysis identifies the KSF of an industry. In the food truck industry Porter’s 5 forces can be described as follows:
Threat of New Entrants: as explained earlier in this document the threats faced by
new entrants are characterized by the easiness for new competitors to enter the industry. In the food truck industry the initial investment is limited compared to other industries and the set up time is pretty short: less than 6 months. Therefore, the market presents a high threat for new entrants. TruckZ tackles this threat by focusing on economy of scale to beat competitors in term of margin. Moreover, due to the higher expertise level of the franchise, TruckZ should be able to leverage its marketing and strategic planning expertise to offset competitors. Finally, TruckZ has a higher growth capacity than solo entrepreneurs due to its shared truck ownership structure.
Threat of Substitutes: many substitutes exist for food trucks. The main one is the brick
and mortar restaurant, followed by the delivery food services, along with take-away. All of these are tangible threats, with each one presenting distinct characteristics. The restaurants offer a comfortable, sit-down meal experience, but are more expensive and
33
time consuming in comparison to the trucks. Take away, on the other hand, poses less dissimilarity in regards to the food truck experience. It essentially offers the same experience, but from a brick and mortar establishment. The downside of take away is its lack of mobility (which from the consumer point of view means a less diversified experience). Moreover, take away is, in effect, a pre-existing brick and mortar restaurant offering the option for customers to order food to go. In general, these establishments take more time to fulfil an order; thus, separating it even further from the food truck experience. Finally, delivery food appears to pose the most threats since it is mobile, doesn’t consume much time and as a high range of variety. However, it presents the major failure of not being a spontaneous purchase since it requires a delivery time between 30-60 minutes in most cases.
Bargaining power of Buyers: buyers are very powerful opponent in the battle for
market shares. They have a significant impact in regards to pricing and value. They will always set pressure on the industry to obtain the best price value they can, depending on the competitors offer.
Bargaining power of Suppliers: suppliers on the other side have the capacity to
pressure price of supply materials, though this capacity is quite limited due to the high competitive environment of the food supply industry. Moreover, part of TruckZ value proposition resides in its ability to realize economy of scale in its supply. The bargaining power of TruckZ should therefore grow as TruckZ expand its fleet of trucks.
Industry’s Rivalry: the food truck industry is still underexploited in most European
cities, meaning that for now the industry’s rivalry remains very low. Note that this low rivalry is outbalanced by the low entry barriers of the industry. It is, therefore, important to create barriers for opponents entering the industry by obtaining great locations for the trucks, reducing costs, optimizing margin, as well as diversifying the trucks in order to reach numerous market segments.
This analysis can be summarized into a graphic expressing the different level of each force; consequently, highlighting the most threatening ones and indicating the industry’s environment attractiveness.
34
The emerging KSF are:
Generate significant economy of scales by optimizing the supply chain and leverage
synergies between trucks
Keep short order fulfilment time
Preserve proximity with clients
Remain competitive in pricing with direct and indirect competition
Obtain rights to exploit most profitable locations
Diversify trucks menu in order to reach more customer segments and diversify the risk
A. Organisation Environnement Analysis (Internal Analysis)
This section is dedicated to the internal organization environment analysis. This internal analysis identifies the strengths and weaknesses of the environment.
B. Value Chain Analysis
First, a value chain analysis will allow us to understand the potential sources of competitive advantage within the organization structure and those that are sources of weaknesses.
35
Figure 7 TruckZ value chain inspired from Lambin & de Moeloose (2008) and Porter (1985) As shown in the figure, the major elements that will impact in its value creation will be:
The firm infrastructure: The financial implication of Truckz chefs will provide them
with great incentive for success, while allowing TruckZ to enlarge its fleet faster by offering chefs less costly access to a truck.
The human resource: TruckZ chefs should be careful when selecting its Chefs and
employees since there are the heart of the company and will be those who carry it to the next level.
The Inbound logistics: This is probably the number competitive advantage from
TruckZ. TruckZ supplies will benefit significant economies of scale compared to privately held food trucks; therefore, allowing TruckZ to reach a higher margin (or lower pricing) level through cost reduction.
The operations management & outbound logistics: Operations management will be
36
should be considered as a new startup and be carefully developed using the Build-Measure-Learn process. From project to project, as the loop cycles are achieved, TruckZ will become an expert in Food Trucks management.
The marketing and sales: This is a very time consuming time for a Food Trucks owner,
as well as a vital element of food truck success that many owners overlook due to their overwhelmingly busy daily life. TruckZ will allow TruckZ chefs to remain separate from this element of the business by managing marketing and sales for them.
All these elements should be viewed as a major strength from TruckZ and its sources of competitive advantage.
37 C. VRIN analysis
The Value-Rare-Imitable-Non-substitutable analysis provides a clearer perspective of the potential threat that surrounds TruckZ. These are summarized in the following figure.
V Valuable?
Product quality vs. pricing through enhanced menu design and great inbound logistics.
Fast serving time & accessibility (proximity) through clear advertising and operation optimization
R Rare?
The inbound logistic optimization is a great a difficult element to implement for other food truck owners. But we should still set this element in perspective since other exiting brick and mortar restaurant chains could decide to enter the industry and turn this at their advantage.
I Imitable?
The business model can easily be copied; no patent protects it from other competitors inspiring from it. .
Imitating a food truck remains easy but barriers for
potential entrants remain high due to the initial investment of buying and equipping a food truck.
N Non-Substitutability?
The food trucks industry main substitutes are brick and mortar restaurants, delivery services and take away
restaurants. Though as identify in the market analysis, these substitutes still differ from the Food Trucks and cannot bring some of the value proposition food truck can easily deliver.
Figure 8 VRIN diagram of TruckZ inspired from Johnson et al.(2011)
Strength of the resulting competitive
38 D. Competitive Analysis (SWOT)
The environment study presently provides all of the necessary information to build a SWOT analysis. This analysis is presented using Johnson et al. canvas.
39
V. Market Study
As previously explained in the literature review, this market “study” aims only to provide the foundation of the entrepreneurs’ leap of faith assumptions.
Following Särndal et al. (2013) methodology and the recommendations presented in the literature review, the following questionnaire was established:
Questionaire 1 (Questions & Specifications)
Questions asked to contact Relevant information obtained
Web link Company's Name Contact date
Contact Name & Surname Contact phone#
Contact email How many trucks do you run? #trucks
How many people work in your
truck(s)? #employees / trucks
Regarding the price of your menus, Price of Menus:
How much is a premium menu (if you
have any)? Ultra Menu
your regular menu? Prix du menu
moyen? Super Menu
your cheap menu? Prix du menu le
moins cher? Classic Menu The price of a drink on average? Prix
moyen d'une boissons? Drink average price Regarding your Sales, Average # menu sold per day:
How many premium menu do you sell
per day? Ultra Menu
regular menu per day? Super Menu cheap menu per day? Classic Menu drinks per day? Drink average sales #per day How many days per month do you
exploit the truck? # days spend on the street/month
Are you on social networks? Which
one? Social Network presence
Facebook Twitter Instagram How much posts per week do you do on
each network?
Social Network presence in # post/week
Facebook Twitter Instagram Do you have a professional website? Website exists YES=1 No=0
How much did you spend on the
website creation? Website cost
How much budget do you spend on
marketing per month? Marketing Budget
How many time do you spend doing your food truck's marketing per week?
Marketing time consuming task? (hour/week)
Do you enjoy doing your food truck day to day marketing on a 1 to 5 scale
where 5 is loving it and 1 is hating it. Enjoyable task?
How long did it took you to set up your truck from business planning to launch in months.
Time to launch a food truck for chef without Foodies' TruckZ How much did you intially invest in the
truck. Investissement initiale? Amount of intial cost
Do you do any major investment after
that. Yes =1 or No=0
If yes how large was the investment?
Amount invested in the truck after launch If yes how many years after the launch? #years before investment
S a l e s S t a t s M a r k e t i n g I n f o C o s t s s t a t s Contact Info
40
The questionnaire was then submitted through a telephone call to over fifteen trucks which lead to six successful phone interviews. The results of these interviews are presented in the table below, with the last column providing synthetization of the insight conveyed through these interviews.
Questionaire 1 (questions, specifications & answers)
Ma rk eti ng Su rvey Q ue st io ns a sk ed to c on ta ct Re le va nt in fo rm at io n ob ta in ed Su rv ey 1 Su rv ey 2 Su rv ey 3 Su rv ey 4 Su rv ey 5 Su rv ey 6 W eb li nk w w w .e lc am ion . be w w w .u rb an coo k. be w w w .k ee pon to as tin g. be w w w .c ar av an ki tc he n. be w w w .v roo m vr o om cof fe e. com Com pa ny 's Na m e El C am ion U rb an C oo k Ke ep O n Toa st in g Ca ra va n Ki tc he n Si n St re et F oo d vr oo m v roo m cof fe e Con ta ct d at e 10 /0 8/ 20 15 10 /0 8/ 20 15 10 /0 8/ 20 15 10 /0 8/ 20 15 10 /0 8/ 20 15 10 /0 8/ 20 15 Con ta ct Na m e & S ur na m e / / / / / / Con ta ct p hon e# / / / / / / Con ta ct e m ai l / / / / / / AVE RA G E St an d. D EV. Co m m en t f or th e le ap o f f ai th a ss um pt io n H ow m an y tr uc ks d o you ru n? #t ru ck s 1 3 1 1 1 1 1, 3 0, 82 M os t e nt re pr en eu rs ow ns a s in gl e tr uc k H ow m an y pe op le w or k in y ou r tr uc k( s) ? #e m pl oy ee s / tru ck s 2 3 1 2 2 1 1, 8 0, 75 M os t t ru ck op er at es w ith a t l ea st 2 s ta ff m em be rs Re ga rd in g th e pr ic e of y ou r m en us , Pr ic e of M en us : H ow m uc h is a p re m iu m m en u (if y ou ha ve a ny )? U ltr a M en u € 2 0, 00 € 1 0, 00 € 5, 00 € 9, 00 € 8, 00 € 3, 20 € 9 ,2 0 € 5 ,8 7 a ll tr uc k ke ep th ei r p re m iu m m en u un de r 1 0€ y ou r r egu la r m en u? P rix d u m en u m oy en ? S up er M en u € 1 1, 00 € 9, 00 € 4, 00 € 7, 00 € 6, 00 € 2, 30 € 6 ,5 5 € 3 ,1 9 y ou r c he ap m en u? P rix d u m en u le m oi ns c he r? C la ss ic M en u € 8, 00 € 7, 00 € 4, 00 € 5, 00 € 5, 00 € 2, 00 € 5 ,1 7 € 2 ,1 4 T he p ric e of a d rin k on a ve ra ge ? Pr ix m oy en d 'u ne b oi ss on s? D rin k av er age p ric e € 3, 00 € 2, 00 € 2, 00 € 1, 50 € 2, 00 € 2, 50 € 2 ,1 7 € 0 ,5 2 Re ga rd in g you r S al es , Ave ra ge # m en u so ld p er da y: La rge d iff er en ce s ex is t b et w ee n tr uc ks p er for m an ce H ow m an y pr em iu m m en u do you s el l pe r d ay ? U ltr a M en u 70 100 10 15 15 50 43 ,3 36 ,5 6 re gu la r m en u pe r d ay ? Su pe r M en u 70 100 20 40 30 70 55 ,0 30 ,1 7 ch ea p m en u pe r d ay ? Cl as si c M en u 100 200 10 15 20 70 69 ,2 73 ,3 8 dr in ks p er d ay ? Dr in k av er age s al es # pe r d ay 400 50 10 25 25 210 12 0, 0 15 5, 92 H ow m an y da ys p er m on th d o you ex pl oi t t he tr uc k? # da ys s pe nd o n th e st re et /m on th 8 25 25 25 15 20 19 ,6 7 6, 98 M os t t ru ck op er at es 6 d ay s a w ee k Ar e you on s oc ia l n et w or ks ? W hi ch on e? So ci al N et w ork p re se nc e Al l t he tr uc ks h av e at le as t 1 s oc ia l n et w or k ac cou nt Fa ce boo k 1 1 1 1 1 1 1, 0 0, 00 Tw itt er 0 1 1 0 0 0 0, 3 0, 52 In st agr am 1 0 0 0 0 0 0, 2 0, 41 H ow m uc h pos ts p er w ee k do you d o on ea ch n et w or k? So ci al N et w ork p re se nc e in # po st /w ee k M os t t ru ck s ha ve a s low a ct iv ity on s oc ia l n et w or ks Fa ce boo k 1 2 1 0, 5 0, 5 1 1, 0 0, 55 Tw itt er 0 2 10 0 0 0 2, 0 4, 00 In st agr am 0 0 0 0 0 0 0, 0 0, 00 Do you h av e a pr of es si on al w eb si te ? W eb si te e xi st s YE S= 1 N o= 0 1 1 1 1 0 1 0, 8 0, 41 O nl y on e tr uc k di dn 't ha d a w eb si te H ow m uc h di d you s pe nd on th e w eb si te c re at ion ? W eb si te c os t € 3 0 00 ,0 0 € 1 00 ,0 0 € 1 0 00 ,0 0 € 1 00 ,0 0 € - € 5 00 ,0 0 € 78 3, 33 € 1 1 47 ,9 0 m os t t ru ck s sp en d ov er H ow m uc h bu dge t d o you s pe nd on m ar ke tin g pe r m on th ? M ark et in g Bu dg et € - € - € 5 00 ,0 0 € - € 3 0 00 ,0 0 € 70 0, 00 € 1 3 03 ,8 4 O nl y tw o tr uc ks h ad a d ed ic at ed m ar ke tin g bu dge t H ow m an y tim e do you s pe nd d oi ng you r f oo d tr uc k' s m ar ke tin g pe r w ee k? M ark et in g tim e co ns um in g ta sk ? (h ou r/ w ee k) 0 5 6 2 0 3 2, 7 2, 50 Do you e nj oy d oi ng you r f oo d tr uc k da y to da y m ar ke tin g on a 1 to 5 sc al e w he re 5 is lov in g it an d 1 is h at in g it. En jo ya bl e ta sk ? 1 5 5 3 2 3 3, 2 1, 60 Tr uc ks ow ne rs w he re on a ve ra ge in di fe re nt to doi ng th ei r m ar ke tin g H ow lon g di d it too k you to se t u p you r tr uc k fr om b us in es s pl an ni ng to la un ch in m on th s. Ti m e to la un ch a foo d tr uc k for c he f w ith ou t F oo di es ' T ru ck Z 1 6 18 6 12 16 9, 8 6, 59 M os t t ru ck too k ov er 6 m on th to la un ch th ei r t ru ck s H ow m uc h di d you in tia lly in ve st in th e tr uc k. In ve st is se m en t i ni tia le ? A m ou nt o f i nt ia l c os t € 2 5 00 0, 00 € 5 0 00 0, 00 € 5 0 00 0, 00 € 6 0 00 0, 00 € 1 8 00 0, 00 € 5 0 00 0, 00 € 42 1 66 ,6 7 € 1 6 61 8, 26 T he in iti al in ve st m en t of th e tr uc ks e xc ee de d 40 '0 00 € on av er age Do you d o an y m aj or in ve st m en t a ft er th at . Ye s =1 o r N o= 0 1 1 1 0 1 1 0, 8 0, 41 M os t t ru ck s do ex tr a in ve st em en ts in th ei r t ru ck s af te r la un ch If y es h ow la rge w as th e in ve st m en t? A m ou nt in ve st ed in th e tr uc k af te r la un ch € 1 3 00 0, 00 € 4 0 00 ,0 0 € 5 0 00 ,0 0 € 4 0 00 0, 00 € 1 0 00 0, 00 € 14 4 00 ,0 0 € 1 4 77 4, 98 F or a m ou nt b et w ee n 5' 00 0€ -4 0' 00 0€ If ye s how m an y ye ar s af te r t he la un ch ? #y ea rs b ef or e in ve st m en t 7 1 1 4 2 3, 0 2, 55 An d m os t of th em d id it d ur in g th e fir st 3 y ea rs of op er at ion S a l e s S t a t s M a r k e t i n g I n f o sCtoasttss Co nt ac t I nf o