http://www.uem.br/acta ISSN printed: 1806-2636 ISSN on-line: 1807-8672
Acta Scientiarum
Doi: 10.4025/actascianimsci.v36i2.22161
Microbial protein synthesis and nitrogen metabolism in cows bred
on tropical pasture and fed on cassava root and corn
Ádler Carvalho da Silva*, Mauro Pereira de Figueiredo, Paulo Bonomo, Mara Lúcia Albuquerque Pereira, Yann dos Santos Luz and Edileuza de Jesus Santos
Programa de Pós-graduação em Zootecnia, Universidade Estadual do Sudoeste da Bahia, Praça Primavera, 40, 45700-000, Itapetinga, Bahia, Brazil. *Author for correspondence. E-mail: adlerzootecnia@yahoo.com.br
ABSTRACT. Current experiment evaluated the effect of replacement of full corn meal by dehydrated ground cassava roots at levels 0, 25, 50, 75 and 100% in experimental supplements for lactating cows grazing on irrigated and fertilized tropical pastures. Ten Holstein cows were divided into two 5 x 5 Latin squares, with average initial 150 days of lactation, milk production 22±3.30 kg day-1 at the beginning of
experiment and initial body weight of 603±65 kg. Cows were maintained on pasture consisting of elephant grass (Pennisetum purpureum, Schum) cultivar Pioneiro, intercropped with Tifton 85 (Cynodon nlemfuensis), fertilized with 600 kg nitrogen per hectare year-1. There was no significant difference
(p > 0.05) between the substitution levels of corn meal by ground and dehydrated cassava root in the concentrate on the synthesis of microbial protein with an estimated average of 1,288.49 g day-1 and
efficiency in the synthesis of microbial protein per kilogram of TDN with estimated average of 91.30 g kg-1
TDN. Nitrogen equilibrium showed an estimated average of 218.79 g day-1 of retained nitrogen. The
microbial protein synthesis and nitrogen balance were not affected by treatments.
Keywords: microbial nitrogen, purine derivatives, urea nitrogen plasma.
Síntese de proteína microbiana e metabolismo de nitrogênio em vacas suplementadas com
raiz de mandioca e milho em pastagem tropical
RESUMO. Síntese de proteína microbiana e metabolismo de nitrogênio em vacas suplementadas com raiz de mandioca e milho em pastagem tropical. O experimento foi realizado para avaliar o efeito da substituição do milho moído por raiz integral de mandioca moída e desidratada nos níveis 0, 25, 50, 75 e 100% nos suplementos experimentais, para vacas lactantes mantidas em pastagens tropicais irrigadas e adubadas. Foram utilizadas dez vacas da raça Holandesa, divididas em dois quadrados latinos 5 x 5, com média inicial de 150 dias de lactação, produção leiteira inicial de lactação de 22±3,3 kg dia-1 e peso corporal
inicial médio de 603±65 kg, mantidos em pastagem formada por capim-elefante (Pennisetum purpureum, SCHUM) cultivar Pioneiro, consorciado com capim Tifton 85 (Cynodon nlemfuensis), adubada com 600 kg de nitrogênio por hectare ano-1. Não foram encontradas diferenças significativas (p > 0,05) entre os níveis
de substituição do milho moído por raiz de mandioca moída e desidratada no concentrado, sobre a síntese de proteína microbiana, que apresentou média estimada de 1.288,49 g dia-1 e, eficiência na síntese de
proteína microbiana por quilograma de NDT com média estimada de 91,30 g kg-1 NDT, o balanço de
nitrogênio apresentou média estimada de 218,79 g dia-1 de nitrogênio retido (p > 0,05). A síntese de
proteína microbiana e balanço de compostos nitrogenados não sofreram efeitos dos tratamentos.
Palavras-chave: nitrogênio microbiano, derivados de purinas, nitrogênio ureico no plasma.
Introduction
Besides the supply of additional nutrients, supplementary nutrients, supplied by concentrates, provide synchronization, for use by microbial populations, of nitrogenated compounds with more soluble energy sources, such as starch.
According to Pimentel et al. (2012), it is highly interesting to find methods to enhance the efficiency of nutrients by ruminants. Through the evaluation of different ingredients in balanced
186 Silva et al.
Microbial protein contribution is an important area of study in ruminants´ protein nutrition. Consequently, the estimated contribution of microbial protein in the intestinal flow of protein is incorporated into the protein assessment systems (MENDONÇA et al., 2006).
Current nutritional assay evaluated the effects of replacing ground corn by crushed and dried whole cassava roots in the concentrate by assessing the excretion of purine derivatives, estimation of microbial protein production, urea nitrogen in urine, plasma and milk, and nitrogen balance.
Material and methods
The assay was performed at the Sítio Beija-flor, a milk production farm, in the hinterlands of the municipality of Vitória da Conquista BA Brazil, 14° 51' 38"S and 40° 52' 51"W, at 923 m. The experiment was conducted between March and May 2012, with ten Holstein cows, featuring average initial 150 days of lactation, with mean milk production 22±3.30 kg at the start of the assay and average initial body weight 603±65 kg. The cows were subjected to five treatments in Latin square design 5 x 5 (5 animals, 5 periods and 5 treatments), with two squares used simultaneously. The cows grazed on predominantly elephant grass (Pennisetum purpureum, Schum) intercropped with Tifton 85 (Cynodon nlemfuensis),
fertilized with 600 kg of nitrogen per hectare year-1.
Minimum and maximum temperature means during the assay period were 20.5 and 27.5°C
respectively; mean solar radiation index at 7.9 KJ m-2
and mean rainfall 4.5 mm. Climate data were retrieved from the meteorological station of the Universidade Estadual do Sudoeste da Bahia in Vitória da Conquista, Bahia State, Brazil.
Assay was conducted for 75 days, with ten days adaptation for each period, followed by five days of data collection. The animals were supplemented with experimental concentrates with different percentages of ground corn and with ground and dehydrated whole manioc root, isonitrogenous and isoenergetic, at levels 0, 25, 50, 75 and 100%. Diets were formulated to meet maintenance requirements and milk production at 25 liters of milk with 3.8% fat (NRC, 2001). Estimated intake of 60% of forage dry matter and of 40% of concentrate dry matter was adopted and the prediction
of dry matter intake was 19.48 kg day-1, following NRC
(2001).
All experimental concentrates received the addition of root bark shavings of fresh cassava to facilitate the intake of the bran concentrate at an average proportion of 70% of the concentrate, coupled to 30% of shavings (dry basis). The animals were initially provided with an
average 10 kg concentrate per animal day-1, or rather, 7
kg day-1 of formulated concentrate (dry matter), plus an
3 kg day-1 (dry weight) of wet cuttings of cassava root
bark with daily intake control and adjusted to the intake of the previous day. Supplements were given twice a day in the morning and in the evening, after milking. The troughs were made of concrete on a cement floor, separated by wooden divisions and covered with a fiber cement roof.
The cows were kept in 2.05 hectares within a rotation grazing system. Pasture was composed of
Penissetum purpureum Schum CV Pioneer
(predominantly grass) intercropped with Cynodon
nlenfluensis. The area was divided into 41 paddocks with
approximately 494 m2 each, mean forage allowance of
70 kg of fresh matter animal-1 day-1. The estimated
availability of green forage was calculated by methodology by Freitas et al. (2004), modified. The animals consumed forage grass in the paddock after the afternoon milking, at approximately 18 hours 30 min., and left intake at 17 hours the following day.
The experimental concentrates in the assay were composed of corn which was replaced by cassava at different levels 0, 25, 50, 75 and 100%) (dry matter base), as Table 1 shows.
Table 1. Composition in % of experimental concentrates.
Replacement levels (%) Ingredients
0 25 50 75
Ground corn (%) 72.00 54.00 36.00 18.00
Ground/dried whole manioc root (%) 0.00 18.00 36.00 54.00
Soybean meal (%) 3.53 8.93 14.33 19.73
Cottonseed meal (%) 21.97 16.57 11.17 5.77
Urea (%) 2.50 2.50 2.50 2.50
Mineral supplement (g day-1) 300 300 300 300
Sodium bicarbonate (g day-1) 250 250 250 250
The level of assurance of the mineral supplement were: Calcium (min) 190.00 g kg-1 and (max) 220.00 g kg-1; Phosphorus (min) 60.00 g kg-1; Sulfur (min) 20.00 g kg-1, Magnesium (min) 20.00 mg kg-1
, Potassium (min) 35.00 g kg-1
; Sodium (mE) 70.00 g kg-1
, Cobalt (min) 15.00 mg kg-1, Copper (min) 700.00 mg kg-1, Chromium (min) 10.00 mg kg-1; Iron (min) 700.00 mg kg-1, Iodine (min) 40.00 mg kg-1; Sodium monensin 1000.00 mg kg-1; Manganese (min) 1600.00 mg kg-1, Selenium (min) 19.00 mg g-1, Zinc (min) 2500.00 mg kg-1, Vitamin A (min) 200,000.00 IU kg-1, Vitamin D3 (min) 50000.00 IU kg-1, Vitamin E (min) 1500.00 IU kg-1, Fluor (max) 600.00 mg kg-1
.
Minerals and sodium bicarbonate supplementation was performed in the trough, manually mixed to formulated concentrates, plus shavings of the root bark of fresh cassava, and divided between feeding periods in the morning and in the afternoon.
Urine samples were collected on the 15th day
Rumem, ruminal microbiota, starch 187
uric acid. Subsequently, spot urine samples were stored in labeled plastic containers and frozen for creatinine, urea, allantoin and uric acid analysis.
Blood collection was performed on the 15th
day of each experimental period, approximately 4 hours after the morning concentrate, following Rangel et al. (2008) with modifications, from the
mammary vein with 5 mL Vacutainer® tubes and
needles, with EDTA K3 as anticoagulant. After
collection, the Vacutainer® tubes with blood were
conditioned in an icebox and maintained cool for transport. In the laboratory, the blood was centrifuged at 3500 rpm for 15 minutes for the sedimentation of red blood cells and platelets. Plasma was collected and stored in labeled eppendorf flasks and stored at – 20°C for the analysis of urea.
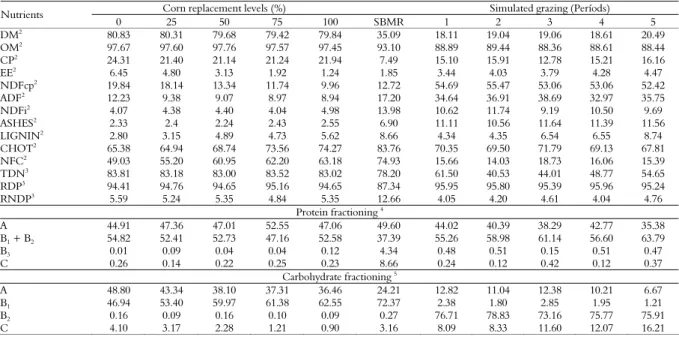
Table 2 shows the chemical composition, in percentage, of the concentrates´ dry matter, shavings of the bark of the cassava root (SBCR)
and roughage with grasses (Pennisetum purpureum
Schum) intercropped with cv. Pioneer Tifton 85 (Cynodon nlemfuensis), which were evaluated taking into consideration the specificity of each experimental period.
Urea nitrogen in milk was determined from milk samples collected during the morning milking, at 5:00 am, and obtained from the milk meter of the milking machine and placed in a standard vial with
preservative Bronopol®. Flasks with milk samples were
conditioned in an icebox and sent for analysis at the Milk Clinic/ ESALQ/ USP.
Daily urine volume may be estimated by the ratio between estimated daily urine excretion, 24.04 mg of creatinine per kilogram of body weight (CHIZZOTTI et al., 2007) and creatinine concentration in spot urine, by the expression: urine volume (liter) = body weight
(BW)*creatinine excretion (mg kg-1 BW)/ creatinine
concentration (mg liter-1). The excretion of other
metabolites was also estimated by multiplying their concentration in the spot sample by daily urine volume. Uric acid, allantoin, urea and total nitrogen were quantified by urine (PAIXÃO et al., 2006).
Creatinine in spot urine samples was calculated by the colorimetric endpoint method for determination of creatinine by fast commercial test Bioclin K016. Nitrogen in feces was determined by Kjeldahl methodology described by Detmann et al. (2012). Samples were taken from spontaneous defecation or from the rectum ampoule between the
10th and 13th day of each experimental period.
Individual feces samples were conditioned at -10°C, dehydrated, ground and analyzed.
Urea concentrations were determined in spot urine and blood plasma samples by the colorimetric enzymatic test by 2,2-dicarboxy-indophenol proportionality with (Laborclin) commercial kit.
Table 2. Chemical composition (%) of the dry matter of concentrates, shavings from the bark of the manioc roots and (SBMR) and simulated grazing1.
Corn replacement levels (%) Simulated grazing (Períods)
Nutrients
0 25 50 75 100 SBMR 1 2 3 4 5
DM2 80.83 80.31 79.68 79.42 79.84 35.09 18.11 19.04 19.06 18.61 20.49
OM2 97.67 97.60 97.76 97.57 97.45 93.10 88.89 89.44 88.36 88.61 88.44
CP2
24.31 21.40 21.14 21.24 21.94 7.49 15.10 15.91 12.78 15.21 16.16
EE2 6.45 4.80 3.13 1.92 1.24 1.85 3.44 4.03 3.79 4.28 4.47
NDFcp2 19.84 18.14 13.34 11.74 9.96 12.72 54.69 55.47 53.06 53.06 52.42
ADF2 12.23 9.38 9.07 8.97 8.94 17.20 34.64 36.91 38.69 32.97 35.75
NDFi2 4.07 4.38 4.40 4.04 4.98 13.98 10.62 11.74 9.19 10.50 9.69
ASHES2
2.33 2.4 2.24 2.43 2.55 6.90 11.11 10.56 11.64 11.39 11.56
LIGNIN2 2.80 3.15 4.89 4.73 5.62 8.66 4.34 4.35 6.54 6.55 8.74
CHOT2 65.38 64.94 68.74 73.56 74.27 83.76 70.35 69.50 71.79 69.13 67.81
NFC2 49.03 55.20 60.95 62.20 63.18 74.93 15.66 14.03 18.73 16.06 15.39
TDN3 83.81 83.18 83.00 83.52 83.02 78.20 61.50 40.53 44.01 48.77 54.65
RDP3
94.41 94.76 94.65 95.16 94.65 87.34 95.95 95.80 95.39 95.96 95.24
RNDP3 5.59 5.24 5.35 4.84 5.35 12.66 4.05 4.20 4.61 4.04 4.76
Protein fractioning 4
A 44.91 47.36 47.01 52.55 47.06 49.60 44.02 40.39 38.29 42.77 35.38
B1 + B2 54.82 52.41 52.73 47.16 52.58 37.39 55.26 58.98 61.14 56.60 63.79
B3 0.01 0.09 0.04 0.04 0.12 4.34 0.48 0.51 0.15 0.51 0.47
C 0.26 0.14 0.22 0.25 0.23 8.66 0.24 0.12 0.42 0.12 0.37
Carbohydrate fractioning 5
A 48.80 43.34 38.10 37.31 36.46 24.21 12.82 11.04 12.38 10.21 6.67
B1 46.94 53.40 59.97 61.38 62.55 72.37 2.38 1.80 2.85 1.95 1.21
B2 0.16 0.09 0.16 0.10 0.09 0.27 76.71 78.83 73.16 75.77 75.91
C 4.10 3.17 2.28 1.21 0.90 3.16 8.09 8.33 11.60 12.07 16.21
188 Silva et al.
Urea in the sample spot urine and blood plasma was analyzed by UV-visible spectrophotometer UV1240 Shimadzu BioSpec Mini, calibrated with a mean wavelength of 600 nm.
The transformation of urea (mg dL-1) into urea
nitrogen (mg dL-1) was obtained by multiplying urea
rates by 0.4667. Rates in mg dL-1 were multiplied by
0.167 to convert mg dL-1 into international measure
units (mmol L-1).
Allantoin and uric acid are purine derivates (PD) and PD daily excretion in cattle is linearly co-related to the amount of absorbed microbial purines. Since the proportion of purine protein in the mixed microbial population is a constant, PD secretion provides an index for the calculation of the intestine microbial protein flux. Allantoin is the most abundant PD in cattle. However, in the case of uric acid, xanthine and hypoxanthine and the high activity of the enzyme xanthine oxidase, which converts hypoxanthine and xanthine into uric acid, the excretion of allantoin and uric acid is approximately 98% of urinary purine derivatives. Therefore, the contributions of xanthine and hypoxanthine are insignificant to determine the total excretion of PD (RENNÓ et al., 2000; SINGH et al., 2007).
Total PDs were determined by the sum of the rates of uric acid excretion from urine and urine allantoin de-proteinized milk.
Milk was de-proteinized by adding 5 mL of trichloroacetic acid 25% to 10 mL of milk; it was kept at rest for 10 min. and then filtering on filter paper. The filtrate was used to determine the allantoin rate.
Urine uric acid was determined by enzyme and calorimetric evaluation with commercial test (Laborclin). Uric acid from urine was converted
into an international unit (mmol L-1) by
multiplying concentration in mg dL-1 by 0.0594.
Allantoin was calculated by colorimetry, following Chen and Gomes (1992), modified. Analysis was performed by spectrophotometer UV- visible, BioSpec mini UV1240 Shimadzu, calibrated with mean absorbance 522 nm of wave length.
The formula to calculate microbial purine bases absorbed in the cattle is given by the sequence
Y = 0.85*X + (0.385 PV0.75), in which X = exogenous
absorption of purines (mmol day-1); PV0.75 = metabolic
weight of the animal, or rather, its body weighed raised to 0.75 (kg). Y is determined by the sum of purine derivates and X is calculated, providing the absorption of
exogen purines, in mmol day-1.
Rate of exogen absorption of purines (x mmol
day-1), obtained by the previous equation, was
used to calculate estimates of microbial nitrogen production in gram of N per day, Yield of microbial N was calculated by Microbial N
(g N day-1) = X (mmol day-1) * 70/ 0.116
*0.83*1000. The formula may also be written
0.727*X (mmol day-1) with digestibility of
microbial purines 0.83, as the mean rate of microbial digestibility of nucleic acids. N rate of
purines is 70 mg N day-1. The proportion
N-Purine: Total N of mixed ruminal micro-organisms is calculated as 11.6: 100 (CHEN; GOMES, 1992; SINGH et al., 2007).
The balance of nitrogenated compounds was obtained by the difference between total nitrogen intake and total nitrogen excreted in feces, urine and in milk, following the formula: Total Nitrogen Intake – Excreted Nitrogen in Feces – Excreted Nitrogen in Urine – Excreted Nitrogen in Milk. Total nitrogen intake (concentrated and forage ration) and feces nitrogen were determined by Kjeldahl methodology described by Detmann et al. (2001).
A Latin square was used with five animals for the statistical evaluation of nitrogen balance. Two Latin squares were employed for the statistical analysis of the other data.
Data underwent statistical analysis by PROC GLM and the development of freedom degrees by orthogonal contrasts, using statistical program SAS 9.1 (SAS, 2004).
Results and discussion
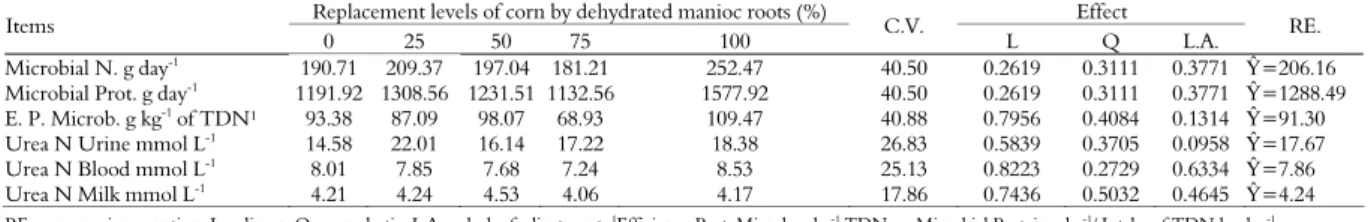
Different inclusion levels of ground and dehydrated manioc root in the concentrate did not have any significant effect (p > 0.05) in estimates on nitrogen and microbial protein production and on the efficiency of the microbial protein synthesis per kg of consumed total digestible nutrients (TDN), shown in Table 3.
Table 3. Estimates of microbial nitrogen synthesis (Microbial N g day-1
) and Microbial Protein (g day-1
), Efficiency of synthesis of microbial protein gram per kg of TDN (E. P. Microb. g kg-1 of TDN), Urea Nitrogen in Urine (mmol L-1), Urea Nitrogen in Blood (mmol L-1
), Urea Nitrogen in Milk (mmol L-1 ).
Replacement levels of corn by dehydrated manioc roots (%) Effect
Items
0 25 50 75 100 C.V. L Q L.A. RE.
Microbial N. g day-1 190.71 209.37 197.04 181.21 252.47 40.50 0.2619 0.3111 0.3771 Ŷ=206.16
Microbial Prot. g day-1
1191.92 1308.56 1231.51 1132.56 1577.92 40.50 0.2619 0.3111 0.3771 Ŷ=1288.49
E. P. Microb. g kg-1 of TDN¹ 93.38 87.09 98.07 68.93 109.47 40.88 0.7956 0.4084 0.1314 Ŷ=91.30
Urea N Urine mmol L-1 14.58 22.01 16.14 17.22 18.38 26.83 0.5839 0.3705 0.0958 Ŷ=17.67
Urea N Blood mmol L-1
8.01 7.85 7.68 7.24 8.53 25.13 0.8223 0.2729 0.6334 Ŷ=7.86
Urea N Milk mmol L-1 4.21 4.24 4.53 4.06 4.17 17.86 0.7436 0.5032 0.4645 Ŷ=4.24
189 Silva et al.
Danes et al. (2013) evaluated microbial protein synthesis of dairy cows, average 129 days lactation, mean daily production of 20 kg of milk and average body weight of 451 kg, grazing on tropical pasture fertilized with nitrogen and supplemented with three protein levels in the concentrate. Results were: mean production of microbial
protein 1,220; 1,123; 1,260; 1,107 g day-1 for 8.7%
CP, with corn; 13.4% CP, processed soybean meal with solvent; 18.1% CP, processed soybean meal with solvent; and 13.4% CP, with urea, respectively, with no significant difference (p > 0.05). All concentrates evaluated had corn at an average of 86.3% of dry matter.
Quantities of microbial protein 1,288.49 g day-1
(Table 3) in current study were similar to those by Danes et al. (2013). The above suggests that the predominant use of corn or manioc starch sources does not modify the synthesis of microbial protein, as has been observed for different sources and protein rates by the first authors.
According to NRC (2001), microbial-originated protein synthesis per kg of TDN may vary between 53 and 140 g. According to this parameter, the experimental diets analyzed provided a synthesis of microbial protein in gram per kg of TDN, within expected averages, revealing mean 91.30 g of microbial protein per kg of TDN, as given by Table 3.
Lack of differences between nitrogen and microbial protein amounts, provided by different supplements tested, indicated that the carbohydrate sources used had similar potential use by rumen microorganisms.
Results show that chemical differences between the dietary participations of carbohydrate energetic fraction B1 (46.94, 53.40, 59.97, 61.38 and 62.55, in Table 2) in experimental concentrates for 0, 25, 50, 75 and 100% respectively, of ground corn replacement by crushed and dehydrated cassava root did not affect the synthesis of microbial proteins, regardless of the differentiated molecular structure of starch in the two tested sources.
Daily excretion of urea nitrogen in urine and in blood plasma and daily excretion of urea nitrogen in milk (p > 0.05) were not affected by treatments
(p > 0.05) (Table 3).
Lack of effect on daily excretions of urea nitrogen in urine among the concentrates evaluated showed that diet nitrogen and ammonia produced in the ruminal fermentation of concentrates and that absorbed as amino-acids the
duodenum were similarly used by dairy cows ingesting the concentrates´ distinct diets. When there is nitrogen excess in the diet not used by microorganisms, they convert it into ammonia which, absorbed by the ruminal epithelium, is excreted by the kidneys in the form of urea or recycled to the rumen through the saliva or rumen wall (PEREIRA et al., 2005). This parameter shows the ability that starch in the corn or in the manioc root has as an energy source in the concentrate and thus contributes for the equilibrium in the use of nitrogen and protein.
According to Lima et al. (2004), average levels of urea nitrogen in the blood plasma of dairy cows with different body conditions and milking stages
may vary between 7 and 23 mg dL-1 (2.50 and 8.21
mmol L-1), whereas, according to Beserra
et al. (2009), in the case of milk, levels of nitrogen
urea between 10 and 14 mg dL-1 (3,57 and 4,99
mmol L-1) may be easily found.
Blood urea levels varying between 7.24 and
8.53 mmol L-1 (Table 3) show that there was no
increase above physiological limits for this parameter, as reported by Lima et al. (2004). The above may indicate an excess of degradable protein in the rumen or lack of diet carbohydrates.
However, Pereira et al. (2009) evaluated urea nitrogen in blood and milk and provided results which were lower for cross-breed dairy cows, average 117 days lactation and average production 17.4 kg, in pastures with elephant grass and supplemented with three levels of nitrogen in the concentrate. The same authors reported rates
11.5, 12.2 and 14.4 mg dL-1 (1.92, 2.04, 2.40 mmol
L-1) for urea nitrogen in the blood (UNB), with
increase in UNB concentration (p < 0.05) when crude protein levels in the concentrate increased. Probably, in this case, the production of ammonium nitrogen in the rumen was low, reflecting the low rates of urea nitrogen in the blood.
Rates 14.1; 14.6 and 15.8 mg dL-1 (2.35, 2.44, 2.64
mmol L-1) were registered for concentration of urea
nitrogen in milk (UNM), with no difference (p > 0.05) among levels 15.2, 18.2 and 21.1% of crude protein in the concentrate (PEREIRA et al., 2009). The above rates were lower than those described in current
assay (4.24 mmol L-1, Table 3).
190 Silva et al.
12.8; 14.6; 11.6 mg dL-1 (1.8, 2.14, 2.44, 1.94 mmol L-1)
for 8.7% CP, with corn; 13.4% CP with soybean meal processed with solvent; 18.1% CP, with soybean meal processed with solvent; and 13.4% CP, with urea, respectively, with no significant effect (p > 0.05). All concentrates included corn, averaging 86.3% of dry matter.
The levels of plasma urea nitrogen (PUN) and urea nitrogen in milk (UNM), reported by Pereira et al. (2009), and levels of plasma urea nitrogen (PUN), registered by Danes et al. (2013), were lower than those in current assay.
The intake of quick usage nitrogen fractions (fraction A), contained in concentrates and forage due to the inclusion of urea and high nitrogen fertilization, may have probably contributed towards increased nitrogen concentrations in plasma and milk, causing them to have higher rates than those previously evaluated.
Although rates were higher than those reported by the two above mentioned researchers, urea nitrogen
rates in the blood and milk (7.86 and 4.24 mmol L-1) lie
within the physiological range of variation for milk and blood, mentioned by Lima et al. (2004) and Beserra et al. (2009).
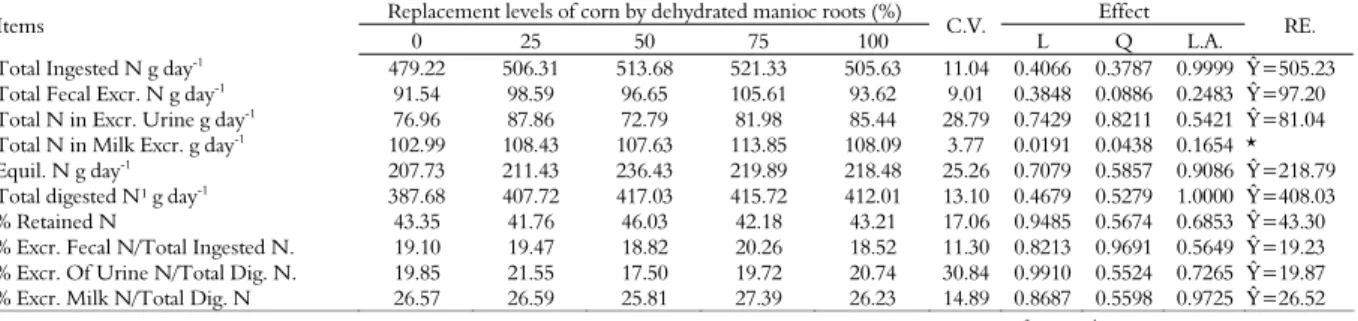
It has been observed that experimental iso-nitrogenated concentrates with replacements of carbohydrate sources, ground corn replaced by cassava root, did not differ significantly (p > 0.05) in total nitrogen intake, as Table 4 shows.
The lack of effect among experimental diets with concentrates for total nitrogen intake was influenced by the lack of effect of treatments (p > 0.05) in dry matter intake of forage with averages 13.10±1.91; 12.91±1.88; 13.71 ± 2.00; 12.87±1.88 and 13.50±1.97; intake of concentrate with averages 6.71±0.64; 7, 92±0.76; 7.00±0.67; 8.00± 0.77 and 7.31±0.70, respectively for 0, 25, 50, 75 and 100% substitution levels of corn by whole ground and dehydrated cassava root in the concentrate, with intake estimates 64.09% for forage and 35.91% for concentrate (p > 0.05).
Excretion of total nitrogen in the feces did not differ significantly (p > 0.05) among the replacement levels of ground corn by ground and dehydrated manioc root in experimental concentrates (Table 4). Since there was no significant effect on the excretion of total nitrogen in urine with the replacement of ground corn by ground and dehydrated whole manioc root (p > 0.05), retained nitrogen metabolism of the experimental diets may be similar (Table 4).
There was a quadratic effect (p < 0.05) in the secretion of total daily nitrogen in milk, with maximum nitrogen secretion at 66.19% of the replacement of ground corn by ground and dehydrated whole manioc root in the concentrate (Table 4). Equilibrium between nitrogen intake and excretion, in g, did not affect diets with experimental concentrates (p > 0.05) (Table 4).
Similarity in the synthesis of microbial nitrogen among the diets tested (Table 3) certainly contributed to the lack of significant effect on nitrogen balance (Table 4). Further, the fractionation of dietary nitrogen of iso-nitrogenous experimental diets produced close rates and contributed towards results which did not differ significantly in nitrogen equilibrium. The occurrence of a balanced supply of essential microbial amino-acids may be presumed available for absorption at duodenal level.
No significant difference (p > 0.05) was reported in mean digested total nitrogen in the diets with different levels of replacement of corn by cassava in the concentrate (Table 4). Similar to what occurred to the nitrogen balance, the consequence of the lack of effect on the synthesis of microbial nitrogen (Table 3) may have contributed to current result.
There was no significant effect (p > 0.05) on replacement levels of ground corn by ground and dehydrated whole cassava root in retained nitrogen percentages similar to percentages of total nitrogen excretion in feces when compared to total ingested nitrogen (Table 4).
Table 4. Daily intake of nitrogen, daily excretion of total nitrogen in feces (g day-1), urine (g day-1) and milk (g day-1), nitrogen equilibrium (g day-1
), total digested nitrogen (g day-1 ).
Replacement levels of corn by dehydrated manioc roots (%) Effect
Items
0 25 50 75 100 C.V. L Q L.A. RE.
Total Ingested N g day-1
479.22 506.31 513.68 521.33 505.63 11.04 0.4066 0.3787 0.9999 Ŷ=505.23
Total Fecal Excr. N g day-1 91.54 98.59 96.65 105.61 93.62 9.01 0.3848 0.0886 0.2483 Ŷ=97.20
Total N in Excr. Urine g day-1 76.96 87.86 72.79 81.98 85.44 28.79 0.7429 0.8211 0.5421 Ŷ=81.04
Total N in Milk Excr. g day-1 102.99 108.43 107.63 113.85 108.09 3.77 0.0191 0.0438 0.1654 *
Equil. N g day-1
207.73 211.43 236.43 219.89 218.48 25.26 0.7079 0.5857 0.9086 Ŷ=218.79
Total digested N¹ g day-1 387.68 407.72 417.03 415.72 412.01 13.10 0.4679 0.5279 1.0000 Ŷ=408.03
% Retained N 43.35 41.76 46.03 42.18 43.21 17.06 0.9485 0.5674 0.6853 Ŷ=43.30
% Excr. Fecal N/Total Ingested N. 19.10 19.47 18.82 20.26 18.52 11.30 0.8213 0.9691 0.5649 Ŷ=19.23
% Excr. Of Urine N/Total Dig. N. 19.85 21.55 17.50 19.72 20.74 30.84 0.9910 0.5524 0.7265 Ŷ=19.87
% Excr. Milk N/Total Dig. N 26.57 26.59 25.81 27.39 26.23 14.89 0.8687 0.5598 0.9725 Ŷ=26.52
191 Silva et al.
Animals retained approximately 43.30% of nitrogen intake. Microbe-originated amino-acids, synthesized from nitrogen intake, may be used by the animal tissue, especially for protein synthesis (BERCHIELLI et al., 2011).
There was no significant difference (p > 0.05) for nitrogen excretion percentage in urine and milk due to digested nitrogen at different replacement levels of ground corn by crushed and dehydrated whole cassava root in the concentrate. Total digested nitrogen gave an estimated average of 408.03 g, where 19.87% was excreted in the urine and 26.59% nitrogen contributed towards milk protein synthesis.
Conclusion
Results show that different substitution levels of ground corn by crushed and dehydrated manioc roots in the diet of lactating cows grazing on irrigated and fertilized tropical pastures did not affect significantly nitrogen synthesis and microbial protein, efficiency of microbial protein synthesis, concentration of urea nitrogen in urine, blood and milk. No effect was reported in nitrogen balance due to the fact that the manioc´s nutritional performance was similar to that of ground corn, acknowledged as standard energy source in concentrates specifically for these animals.
References
BERCHIELLI, T. T.; PIRES, A. V.; OLIVEIRA, S. G.
Nutrição de ruminantes. 2. ed. Jaboticabal: Funep, 2011.
BESERRA, E. E. A.; VIEIRA, R. J.; SOUZA, J. A. T.; NUNES, J. F. Efeito do nitrogênio ureico no leite sobre a eficiência reprodutiva de vacas da raça girolando. Revista Científica de Produção Animal,v. 11, n. 1, p. 34-45, 2009.
CHEN, X. B.; GOMES, M. J. Estimation of microbial protein supply to sheep and cattle based on urinary excretion of purine derivatives - an overview of technical details. Aberdeen: Rowett Research Institute/International Feed Research Unit, 1992.
CHIZZOTTI, M. L.; VALADARES FILHO, S. C.; VALADARES, R. F. D.; CHIZZOTTI, F. H. M.; MARCONDES, M. I.; FONSECA, M. A. Consumo, digestibilidade e excreção de uréia e derivados de purinas em vacas de diferentes níveis de produção de leite.
Revista Brasileira de Zootecnia, v. 36, n. 1, p. 138-146, 2007.
DANES, M. A. C.; CHAGAS, L. J.; PEDROSO, A. M; SANTOS, F. A. Effect of protein supplementation on milk production and metabolism of dairy grazing tropical grass. Journal of Dairy Science, v. 96, n. 1, p. 407-419, 2013.
DERESZ, F. Produção de leite de vacas mestiças Holandês x Zebu em pastagem de capim-elefante, manejada em sistema rotativo com e sem suplementação durante a época das chuvas. Revista Brasileira de Zootecnia, v. 30, n. 1, p. 197-204, 2001.
DETMANN, E.; PAULINO, M. F.; ZERVOUDAKIS, J. T.; VALADARES FILHO, S. C.; EUCLYDES, R. F.; LANA, R. P.; QUEIROZ, D. S. Cromo e indicadores internos na determinação do consumo de novilhos mestiços, suplementados, a pasto. Revista Brasileira de Zootecnia, v. 30, n. 5, p. 1600-1609, 2001.
DETMANN, E.; SOUZA, M. A.; VALADARES FILHO, S. C.; QUEIROZ, A. C.; BERCHIELLI, T. T.; SALIBA, E. O. S.; CABRAL, L. S.; PINA, D. S.; LADEIRA, M. M.; AZEVEDO, J. A. G. Métodos para análise de alimentos - INCT - Ciência Animal. Visconde do Rio Branco: Suprema, 2012.
FREITAS, E. V.; LIRA, M. A.; DUBEUX JÚNIOR, J. C. B.; SANTOS, M. V. F.; MELLO, A. C.L.; TABOSA, J. N.; FARIAS, I. Características produtivas e qualitativas de clones de capim-elevante (Pennisetum purpureum Shum.) avaliados sob pastejo na zona da mata de Pernambuco. Acta Scientiarum. Animal Sciences, v. 26, n. 2, p. 251-257. 2004.
LICITRA, G.; HERNANDEZ, T. M.; VAN SOEST, P. J. Standardization of procedures for nitrogen fractionation of ruminant feeds. Animal Feed Science and Technology, v. 57, n. 4, p. 347-358, 1996.
LIMA, M. L. P.; BERCHIELLI, T. T.; LEME, P. R.; NOGUEIRA, J. R.; PINHEIRO, M. G. Concentração de nitrogênio uréico plasmático (NUP) e produção de leite de vacas mestiças mantidas em gramíneas tropicais sob pastejo rotacionado. Revista Brasileira de Zootecnia, v. 33, n. 6, p. 1616-1626, 2004.
MENDONÇA, S. S.; PEREIRA, M. L. A.; ASSIS, A. J.; AGUIAR, L. V.; CARVALHO, G. G. P. Estimação da produção de proteína microbiana em ruminantes baseada nas excreções de derivados de purinas. Revista Portuguesa de Ciências Veterinárias, v. 101, n. 559-560, p. 181-186, 2006. NRC-National Research Council. Nutrient requirements of dairy cattle. 7th ed. Washington, D.C.: National Academy Press, 2001.
PAIXÃO, M. L.; VALARARES, S. C.; M. I.; VALADARES, R. F. D.; PAULINO, M. F.; MARCONDES, M. I.; FONSECA, M. A.; SILVA, P. A.; PINA, D. S. Ureia em dietas para bovinos: consumo, digestibilidade dos nutrientes, ganho de peso, características de carcaça e produção microbiana. Revista Brasileira de Zootecnia, v. 35, n. 6, p. 2451-2460, 2006.
PEREIRA, E. S.; ARRUDA, A. M. V.; MIRANDA, L. F.; MIZUBUTI, I. Y.;MUNIZ, E. B.; PINTO, A. P. Importância da inter-relação carboidrato e proteína em dietas de ruminantes. Semina: Ciências Agrárias, v. 26, n. 1, p. 125-134, 2005.
192 Silva et al.
PIMENTEL, P. G.; REIS, R. B.; LEITE, L. A.; CAMPOS, W. E.; NEIVA, J. M. N.; SATURNINO, H. M.; COELHO, S. G. Parâmetros de fermentação ruminal e concentração de derivados de purina de vacas em lactação alimentadas com castanha de caju. Arquivo Brasileiro de Medicina Veterinária e Zootecnia, v. 64, n. 4, p. 959-966, 2012.
RANGEL, A. H. N.; CAMPOS, J. M. S.; VALADARES FILHO, S. C.; BRITO, A. F.; BRAGA, Z. C. A. C. Produção, composição do leite e concentração de nitrogênio uréico no soro de vacas alimentadas com cana-de-açúcar corrigida. Caatinga, v. 21, n. 4, p. 6-11, 2008. RENNÓ, L. N.; VALADARES, R. F. D; LEÃO, M. I.; VALADARES FILHO, S. C.; SILVA, J. F. C.; CECON, P. R.; DIAS, H. L. C.; COSTA, M. A. L.; OLIVEIRA, R. V. Estimativa da produção de proteína microbiana pelos derivados de purinas na urina em novilhos. Revista Brasileira de Zootecnia, v. 29, n. 4, p. 1223-1234, 2000. SAS-Statistical Analysis System. User’s guide. Version9.1. Cary: SAS, 2004.
SILVA, D. J.; QUEIROZ, A. C. Análise de alimentos: métodos químicos e biológicos. 3. ed. Viçosa: UFV, 2006. SINGH, M.; SHARMA, K.; DUTTA, N.; SINGH, P.; VERMA, A. K.; MEHRA, U. R. Estimation of rumen microbial protein supply using urinary purine derivatives excretion in crossbred calves fed at different levels of feed intake. Asian-Australasian. Journal of Animal Sciences,v. 20, n. 10, p. 1567-1574, 2007.
SNIFFEN, C. J.; O’CONNOR, J. D.; VAN SOEST, P. J.; FOX, D. G.; RUSSELL, J. B. A net carbohydrate and protein system for evaluating cattle diets: II. Carbohydrate and protein availability. Journal of Animal Science, v. 70, n. 11, p. 3562-3577, 1992.
Received on October 23, 2013. Accepted on November 19, 2013.
License information: This is an open-access article distributed under the terms of the Creative Commons Attribution License, which permits unrestricted use, distribution, and reproduction in any medium, provided the original work is properly cited.