ABSTRACT: Animals on pasture generally show higher feed efficiency as a result of the use of antibiotics. This study evaluated the effect of the antimicrobials salinomycin and/or virginiamycin on production and the ruminal parameters of supplemented dairy cows grazing on Panicum maxi-mum cv. Tanzania. Twelve Holstein/Zebu multiparous cows were used, distributed in three Latin squares, one for the evaluation of ruminal parameters, and the others for production param-eters. Cows on pasture were fed 50 % of their estimated intake with corn silage and concentrate supplements containing salinomycin, virginiamycin or a combination of additives, in doses of 120 and 150 mg kg−1, respectively. There were no differences in milk production and composition, energy and nitrogen balance, dry matter digestibility and feeding behavior. However, salinomycin and virginiamycin each reduced pasture and total dry matter intake by about 14 % and 10 %, with a consequent improvement in feed efficiency.
Keywords: Panicum maximum, digestibility, feeding behavior, ionophores, nitrogen balance
Introduction
Salinomycin, a polyester antibiotic ionophore produced by Streptomyces albus, has been effective in increasing the production of cattle on high-grain diets (Merchen and Berger, 1985) or on pasture (Bagley et al., 1988). The mechanism of action is related to the transport of high-affinity cations into the cell. This impairs the normal flux of ions through the cell membrane, and reduces the growth rates of susceptible microorganisms as a result of energy loss from the cell.
Produced during fermentation of Streptomyces virginiae, virginiamycin is an antibiotic belonging to the class of streptogramins. Composed of two factors, M and S, with synergistic functions, virginiamycin can be linked specifically and irreversibly to ribosomal units. This inhibits peptide formation, with a consequent reduction in growth (bacteriostasis effect) or even death of bacteria (bactericidal effect) (Boon and Dewart, 1974).
Gram-negative microorganisms are generally resistant to ionophore and non-ionophore antibiotics, because their outer membrane is impermeable to many macromolecules. The increase of gram-negative bacteria in the rumen improves energy and protein status, due to the change in the ruminal fermentation pattern, which increases propionate production and reduces methane and deamination of amino acids (McGuffey et al., 2001). In dairy herds, reduction of non-esterified fatty acids, ketones and β-hydroxybutyrate, and increases in the availability of glucose and amino acids associated with these antibiotics have resulted in lower body-fat mobilization, and higher milk production, milk-protein content and feed efficiency (Erasmus et al., 2008).
Animals on pasture or fed with higher proportions of forage generally show poor responses to the use of antibiotics (Clayton et al., 1999). However, the use of combinations of antibiotics has increased feed efficiency and milk production, together with the reduction of
metabolic problems associated with the use of body reserves (Erasmus et al., 2008).
The small number of experiments which use either salinomycin or virginiamycin, and also a combination of these antibiotics, suggested that useful information could be gained from an evaluation of the effects of these treatments on the physiological and production parameters of dairy cattle supplemented on pasture.
Materials and Methods
The experiment was conducted from February through April 2010 in Santo Antônio do Leverger, in the state of Mato Grosso, Brazil, at 141 m altitude, 15º51'56" S and 56º04'36" W. The climate was Cwa of Köppen, tropical, with two distinct seasons, a rainy summer (Oct through Mar) and a dry winter (Apr through Sep). The mean annual temperature and annual rainfall are 24 °C and 1,300 mm, respectively.
Twelve Holstein/Zebu multiparous dairy cows, after the peak of lactation, were used in three 4 × 4 Latin Square-design experiments, grouped according to the volume of milk production. The first group consisted of rumen-cannulated cows to evaluate nutritional parameters. These cows were producing 9 kg d−1 of milkand averaged 354 ± 35 kg Body Weight (BW). The other two evaluated production parameters. These cows weighed on average 460 ± 23 and 514 ± 32 kg BW and were producing 13 and 15 kg d−1 of milk, respectively. The cows were adapted to each trial over an 11-day period. During this period, the cows were fed twice daily (06h30 and 15h30) with a total of 3 kg of the same supplement.
The experiment consisted of four experimental periods of 21 days each; the first 14 days were used for diet adaptation and the following seven for data collection. Animals kept on pasture were fed simultaneously at 7h00 and 15h30, after milking, with 1Federal University of Viçosa − Dept. Animal Science, Av.
P.H. Rolfs, s/n − 36570-000 – Viçosa, MG – Brazil. 2Federal University of Mato Grosso − Dept. Basics Sciences and Animal Production, Av. Fernando Corrêa da Costa, 2367 − 78060-900 – Cuiabá, MT – Brazil.
*Corresponding author <[email protected]>
Edited by: Gerson Barreto Mourão
Salinomycin and virginiamycin for lactating cows supplemented on pasture
Isis Scatolin de Oliveira1*, Daniel de Paula Sousa2, Augusto Cesar de Queiroz1, Bruna Gomes Macedo2, Camila Garcia Neves2, Isabela Eloisa Bianchi2, Ronyatta Weich Teobaldo2
corn silage and concentrate supplement in individual feeders. Animals producing more than 10 kg d−1 of milkwere fed 2.0 kg of concentrate supplement and an additional 1.0 kg per 2.5 kg d−1 of milkproduced above the 10-kg level. The amount offered comprised 50 % of calculated daily intake according to the estimated dry matter intake (DMI) (NRC, 2001):
DMI (kg d−1) = (0.372 × FCM + 0.0968 × BW0.75) *(1- e(−0.192×(WL+3.67))), where FCM= 4 % Fat-corrected milk production (kg d−1); BW = body weight (kg) and WL = weeks of lactation.
The treatments consisted of additives, as follows: i) Control diet (C); ii) salinomycin 120 mg kg−1 of concentrate supplement (S); iii) virginiamycin 150 mg kg−1 of concentrate supplement (V); and iv) salinomycin and virginiamycin 120 and 150 mg kg−1 of supplement (SV).
The experimental area consisted of 12 plots of Tanzania grass (Panicum maximum. Jacq. cv. Tanzania); each plot had an area of 2,500 m2 and was managed rotationally. Forage availability was estimated when the animals entered each paddock, by measuring the sward height at 20 points. Only paddocks with a mean initial sward height of 75 cm were used. The cows were removed when the sward height was reduced to approximately 40 cm. During the experimental period, the pasture was fertilized with 88 kg ha-1 of nitrogen and 88 kg ha-1of potassium.
Hand-plucked samples were collected simulating the grazing action. The forage, feed offered and residues were weighed and sampled daily in the last seven days of each period. Forage samples were cut at ground level, in an area defined by quadrats measuring 0.5 × 0.5 m, homogenized and divided to determine fractions of green and dry leaf (leaf blade), green and dry stem (stem + sheath), and forage mass availability (kg DM ha−1) in each experimental paddock (Table 1).
Forage intake and food digestibility were estimated using external and internal markers. Fifteen grams d−1 of chromium oxide (Cr
2O3), administered orally to each cow from day 8 through 15 of each experimental period, was used as an external marker to estimate the fecal excretion of individual animals. Fecal samples were
collected directly from the rectum (approximately 200 g), on day 14 through 16 of the experimental period, at the following times: day 14 (17h00), 15 (11h00) and 16 (06h00).
The total digestible nutrients (TDN) and digestible (DE), metabolizable (ME) and net energy of lactation (NEL) were calculated according to the models proposed by NRC (2001). TDN g kg−1 = digestible crude protein (CP) + digestible neutral detergent fiber (NDF) + digestible non-fibrous carbohydrates (NFC) + (2.25 × digestible ether extract (EE)). DE Mcal kg−1 was estimated by multiplying the concentration of each digestible nutrient and its heat of combustion. ME Mcal kg−1 for experimental diets with less than 3 % of ether extract was ME (Mcal kg−1) = (1.01 × DE) – 0.45. NE
L for experimental diets with less than 3 % of ether extract was NEL (Mcal kg−1) = 0.703 × ME – 0.19.
Forage intake was estimated with indigestible NDF, using the following model proposed by Detmann et al. (2001). Forage (DMI) = [(FE × MC) – MCS] MCF−1, where: FE = fecal excretion (kg d−1); MC = marker content in feces (kg kg−1); MCS = marker content in the supplement (kg d−1); MCF = marker content in the forage (kg kg−1).
Samples of forage, ingredients, supplements, residues and feces were pre-dried in a forced-air oven at 60 ± 5 °C for 72 h, ground, and sifted through a sieve with a 1 mm mesh size. Each sample was analyzed for dry matter (DM), organic matter (OM), ash, CP, and EE, as described by AOAC (2005) (Table 2). The
Table 1− Morphological components of Tanzania-grass.
Period
Means
1 2 3 4
--- t DM ha–1
---Leaf 3.50 3.59 2.78 2.02 2.97
Stem 2.72 2.62 2.70 1.92 2.49
Senescent 6.53 4.41 3.95 3.34 4.56
Total 12.75 10.62 9.43 7.28 10.02
%
---Leaf 27.47 33.78 29.46 27.81 29.63
Stem 21.33 24.66 28.63 26.39 25.25
Senescent 51.20 41.56 41.88 45.84 45.12 Sward Height (cm) 83.90 83.06 77.99 55.47 75.11
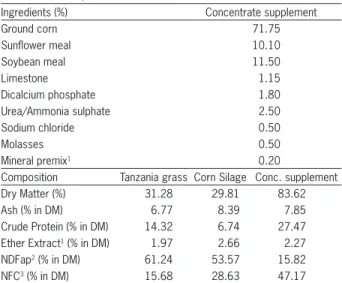
Table 2 − Proportion of ingredient of concentrate supplements and chemical composition of feeds.
Ingredients (%) Concentrate supplement
Ground corn 71.75
Sunflower meal 10.10
Soybean meal 11.50
Limestone 1.15
Dicalcium phosphate 1.80
Urea/Ammonia sulphate 2.50
Sodium chloride 0.50
Molasses 0.50
Mineral premix1 0.20
Composition Tanzania grass Corn Silage Conc. supplement
Dry Matter (%) 31.28 29.81 83.62
Ash (% in DM) 6.77 8.39 7.85
Crude Protein (% in DM) 14.32 6.74 27.47 Ether Extract1 (% in DM) 1.97 2.66 2.27
NDFap2 (% in DM) 61.24 53.57 15.82
NFC3 (% in DM) 15.68 28.63 47.17
1Mineral premix composition: 105 g kg−1 of Calcium; 7,500 mg kg−1 of Magnesium; 230 g kg−1 of sulfur; 330 mg kg−1 of cobalt; 2000 mg kg−1 of Cupper; 155 g kg−1 of Iodine; 2,800 mg kg−1 of Magnesium; 220 mg kg−1 of Selenium; 6800 mg kg−1 of Zinc; Control treatment – no antibiotics; S – 120 mg kg−1 of salinomycin; V – 150 mg kg−1 of virginiamycin; SV - 120 mg kg−1 of salinomycin and 150 mg kg−1 of virginiamycin; 2NDF
Yijkl = µ + Ai(l) + Pj(l) + Tk + Ql + TQkl + eijkl,
where: Yijkl = observation of cow i in period j subject to supplementation level k, in Latin square l; µ = overall effect of the mean; Ai(l) = effect of animal i in Latin square l, where i = 1, 2, 3, 4; Pj(l) = effect of period j in Latin square l, with j = 1, 2, 3, 4; Tk = effect of supplementation level k, where k = 1, 2, 3, 4; Ql = effect of Latin square l, where l = 1, 2; TQkl = interaction effect between treatment k × Latin square l; eijkl = random error associated with each observation ijkl. eijkl ~ NID (0. σ2). In the presence of a significant treatment effect, means were compared using Tukey’s test, considering α =5 % and 10 % for tendency of error type I.
Results and Discussion
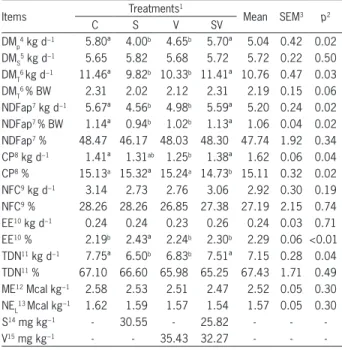
The intake of supplements was not different (p > 0.05) between the experimental diets (5.72 kg d−1), and was close to what was offered (6 kg d−1). Total DMI of cows receiving the control diet averaged 11.46 kg d−1, slightly lower than the level predicted by NRC (2001), about 12.03 kg d−1. Administration of salinomycin or virginiamycin reduced (p = 0.03) DMI by about 14 % and 10 %, respectively, as the nutrients NDFap and TDN. Thus, the use of antibiotics reduced pasture intake and, at the same time, fiber intake, below the values suggested by Mertens (1987). According to this author, fiber intake is usually limited by rumen fill when NDF intake reaches approximately 1.2 ± 0.1 % of BW (Table 3).
Ipharraguerre and Clark (2003) observed that 8 out of 12 studies on monensin for lactating cows found no differences in DMI. Their findings demonstrate that ionophore responses may be related to dose and stage of lactation. In early lactation, the addition of ionophores was able to reduce losses of body reserves and increase available energy and animal performance without changing DMI. However, in the mid- and late stages of lactation, as well as in the case of beef cattle, this was able to decrease DMI due to the lower energy requirement (Erasmus et al., 2008).
Although most studies with virginiamycin have been conducted on beef animals in feedlots, some points can be related to dairy cows. Rogers et al. (1995) analyzed seven experiments on dose response for virginiamycin and found an improvement in feed efficiency associated with the mean daily increase in weight gain. None of these studies found a reduction in DMI. However, four experiments found a numerical decrease in DMI, which contributed in part to the improvement in feed efficiency. Furthermore, no increase in FE was observed in response to doses above 19 mg kg−1 DM, as observed in this study (Table 3). Salinas-Chavira et al. (2009) reported no differences in the average daily gain or DMI for confined Holstein steer calves supplemented with three levels of virginiamycin (0, 16, or 22.5 mg kg–1).
contents of NDF were determined by using α amylase without sodium sulfite added, and corrected (NDFap), discounting ash and neutral detergent-insoluble protein (Mertens, 2002; Licitra et al., 1996). Due to the presence of urea, NFC was calculated as proposed by Hall (2000): NFC = 100 - (CP % - CP % derived from urea + urea %) + NDF % + EE % + Ash %.
Cows were milked twice daily at 06h00 and 15h00. Milk production was recorded through a milking device, from day 15 through 18 of each experimental period. On days 17 and 18, proportional morning and evening milk samples of approximately 100 mL were collected and packed in plastic bottles with preservative. The content of fat, protein and lactose were analyzed by infrared spectrophotometry (IDF, 1996). 3.5 % fat-corrected milk production (FCM) was estimated (Sklan et al., 1992) by the following equation: FCM in kg d−1 = (0.432 × kg milk) + (16.216 × kg milk fat).
Feed efficiency (FE) was calculated as fat-corrected milk production per total dry matter intake and energy efficiency (EEf) as Mcal of net energy of lactation excreted on milk per Mcal of net energy of lactation intake. Energy balance (EB, Mcal d−1) was calculated by subtracting the NEL consumed from the required amounts of net energy for maintenance and lactation. Net energy of maintenance (NEM;Mcal d−1) was calculated as 0.080x BW0.75 and net energy of lactation (NEL; Mcal d−1) = (0.0929 × % fat + 0.0547x % CP + 0.0395 × % lactose) × milk production (kg d−1) (NRC, 2001).
Animals were weighed every 21 days in each experimental period, after the morning milking. Blood samples were collected on day 21, and centrifuged to separate the serum. Urea was determined in deproteinized milk and serum using commercial kits (Labtest®). Urea was converted to blood urea nitrogen by multiplying the observed values by 0.4667, which gives the total nitrogen in the urea.
Urine spot samples were collected on day 21 of each period and stored at -20 °C for total nitrogen analysis. The nitrogen balance was obtained from the difference between nitrogen intake and nitrogen excreted in feces, urine and milk.
Ruminal fluid was collected through the ruminal cannula on day 20, to measure pH and ammonia concentration before (0) and 2, 4, 6 and 8 h after the beginning of feeding in the morning. Rumen fluid pH was immediately determined with the use of a digital potentiometer. At each sampling, a 50-mL aliquot of the ruminal fluid from each animal was mixed with 1 mL of 50 % sulfuric acid and stored at -5 °C for ammonia analyses.
The feeding behavior was assessed on day 19, for 24 h, by visual observation. Every ten minutes were recorded activities of grazing, ruminating and idle were recorded.
Few studies conducted with a combination of two antibiotics have found similar results. Nuñez et al. (2013) observed a reduction in DMI with virginiamycin (15 mg kg−1) in the diet containing salinomycin (13 mg kg−1), which contributed to greater FE. On the other hand, Silva et al. (2004) obtained differences in mean daily gain with Nellore steers fed 77 % concentrate diet, supplemented with salinomycin, virginiamycin, or a combination of the two. However, steers receiving both salinomycin and virginiamycin showed higher DMI compared with those supplemented with the isolated additives.
The production of milk and FCM did not differ (p
> 0.05) between treatments (Table 4). Generally, higher yields have been obtained with the use of antibiotics for early-lactation animals. This could be attributed mainly to a decrease in the ratio of acetic to propionic acid, improvement in energy efficiency, and lower mobilization of body reserves (Clayton et al., 1999; Erasmus et al., 2008; Ipharraguerre and Clark, 2003).
Low-production cows such as those used in this experiment, producing less than 13 kg d−1 of milk, in the mid-lactation, may show a limited milk response to the use of antimicrobials. Cows in the mid- and late stage of lactation did not change milk production with the use of ionophores (Gandra et al., 2010). However, Gandra et al. (2010) did find increases in FE,to reductions in DMI.
Table 3 − Dry matter and nutrients intake and nutrient composition considering whole diet daily intake.
Items Treatments
1
Mean SEM3 p2
C S V SV
DMp
4 kg d−1 5.80ª 4.00b 4.65b 5.70ª 5.04 0.42 0.02 DMS
5 kg d−1 5.65 5.82 5.68 5.72 5.72 0.22 0.50 DMT
6 kg d−1 11.46ª 9.82b 10.33b 11.41ª 10.76 0.47 0.03 DMT
6 % BW 2.31 2.02 2.12 2.31 2.19 0.15 0.06 NDFap7 kg d−1 5.67ª 4.56b 4.98b 5.59ª 5.20 0.24 0.02 NDFap7 % BW 1.14ª 0.94b 1.02b 1.13ª 1.06 0.04 0.02 NDFap7 % 48.47 46.17 48.03 48.30 47.74 1.92 0.34 CP8 kg d−1 1.41ª 1.31ab 1.25b 1.38ª 1.62 0.06 0.04 CP8 % 15.13a 15.32ª 15.24a 14.73b 15.11 0.32 0.02 NFC9 kg d−1 3.14 2.73 2.76 3.06 2.92 0.30 0.19 NFC9 % 28.26 28.26 26.85 27.38 27.19 2.15 0.74 EE10 kg d−1 0.24 0.24 0.23 0.26 0.24 0.03 0.71 EE10 % 2.19b 2.43ª 2.24b 2.30b 2.29 0.06 <0.01 TDN11 kg d−1 7.75ª 6.50b 6.83b 7.51ª 7.15 0.28 0.04 TDN11 % 67.10 66.60 65.98 65.25 67.43 1.71 0.49 ME12 Mcal kg−1 2.58 2.53 2.51 2.47 2.52 0.05 0.30 NEL
13 Mcal kg−1 1.62 1.59 1.57 1.54 1.57 0.05 0.30
S14 mg kg−1 - 30.55 - 25.82 - -
-V15 mg kg−1 - - 35.43 32.27 - -
-1Control (C), salinomycin (S), virginiamycin (V), and salinomycin and virginiamycin (SV); 2means followed by different letters in the line statistically differ by Tukey’s test; 3SEM: standard error of the mean; 4DMI
p = DM intake of the pasture; 5DMI
S = DM intake of silage and concentrate; 6DMI
T = total DM intake; 7NDFap = neutral detergent fiber corrected for ash and protein; 8CP = crude protein; 9NFC = non-fibrous carbohydrates; 10EE = ether extract; 11TDN = total digestible nutrients; 12ME = metabolizable energy; 13NE
L = net energy of lactation; 14S = salinomycin(content per kg of DM intake); 15V = virginiamycin (content per kg of DM intake).
Table 4 − Milk production and composition, feed efficiency and nitrogen and energy balance of experimental diets.
Items Treatments
1
Means SEM3 p2
C S V SV
Milk kg d−1 12.62 12.42 11.82 12.24 12.28 0.65 0.23 FCM4 12.40 12.44 11.81 11.99 12.16 0.75 0.56 Fat% 3.42 3.53 3.56 3.41 3.48 0.33 0.94 Fat kg d−1 0.43 0.44 0.41 0.41 0.42 0.05 0.89 Protein% 3.04 3.01 3.04 3.05 3.03 0.10 0.70 Protein kg d−1 0.38a 0.37ab 0.35b 0.37ab 0.37 0.01 0.03 Lactose % 4.13 4.10 4.05 4.15 4.11 0.12 0.57 Lactose kg d−1 0.52 0.51 0.48 0.51 0.51 0.03 0.34 MUN5 mg dL−1 9.24 9.63 9.76 8.91 9.39 2.01 0.72 NEL
6 Mcal kg−1 0.65 0.65 0.66 0.65 0.65 0.04 0.98 NEL
6 Mcal d−1 8.11 8.08 7.68 7.86 7.93 0.45 0.50 FE7 1.08b 1.27a 1.14ab 1.05b 1.14 0.07 0.04 EEf
8 0.49b 0.55a 0.49b 0.51b 0.51 0.03 0.04 EB9 Mcal d−1 0.53 0.31 0.94 0.57 0.59 1.76 0.91 NB10 g d−1 83.86 87.31 97.23 90.95 89.84 38.11 0.97 1Control (C), salinomycin (S), virginiamycin (V), and salinomycin and virginiamycin (SV); 2means followed by different letters in the line statistically differ by Tukey’s test; 3SEM: standard error of the mean; 4FCM = 3.5 % fat corrected milk production; 5MUN = milk urea nitrogen; 6NEL = net energy of lactation excreted in milk; 7FE = feed efficiency (FCM/DMI); 8EE
f = energy efficiency (Mcal of Net energy of lactation excreted in milk/ Mcal of net energy of lactation intake); 9EB = energy net balance; 10NB = nitrogen balance.
In the present study, FE was about 18 % higher with salinomycin, compared to the control treatment.
The small amplitude or even absence of responses in DM and nutrient intake with the use of virginiamycin alone or in combination with salinomycin did not contribute to an improvement in feed and energy efficiency. Providing corn silage and concentrate supplement to low-producing cows in mid- to late lactation limited the response in increasing milk or milk composition production with the use of antibiotics. Virginiamycin used alone tended (p < 0.10) to increase FE by 6 %.
The present experimental diets led to a positive energy and nitrogen balance (Table 4). This indicates that energy and protein requirements were satisfied, and the low milk production was related to the productivity of cows and the stage of lactation. Body-weight changes were positive for all animals, averaging 89, 327, 369 and 61 g d−1, respectively, for the control, salinomycin, virginiamycin, and salinomycin with virginiamycin treatments. Measurements of body-weight change help to evaluate the real benefit of additive use, which increases FE without animal weight loss.
expected. However, even cows receiving the control diet showed low levels of both components (9.24 mg dL−1 and 3 %).
Milk urea nitrogen is a valuable tool for monitoring dietary protein (Hof et al., 1997). Levels below 10 mg dL−1 with less than 3.2 % of MP, as observed in this study, may indicate that the diet contained low levels of crude protein and rumen-degradable protein (RDP).
Animals were supplemented with corn silage and a supplement concentrate with high energy content that requires higher CP and RDP diets. The commercial concentrate with 220 g kg−1 CP used here may have not met the animals’ RDP requirements, which probably influenced the MUN and MP levels and the lack of antibiotic effects.
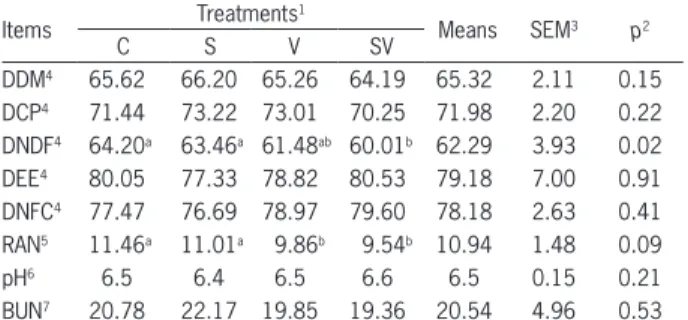
The inclusion of antimicrobials did not affect DM and nutrient digestibility (p > 0.05) of the experimental diets, except for NDF digestibility (Table 5). The effect of virginiamycin on DM digestibility has rarely been investigated (Salinas-Chavira et al., 2009). These authors observed an improvement in DM digestibility in swine, which was attributed to an increase in intestinal feed retention and a reduction in harmful bacteria (Ravindran et al., 1984).
Ionophores could improve fiber digestibility, mainly because they reduce feed intake and consequently affect the passage rate of solids. However, NDF digestibility was lower (p = 0.02) when the combined antibiotics were used, compared to the control diet (C), or to salinomycin alone (S). Lower fiber digestibility in this case may be related to the tendency for ammonia reduction with the use of virginiamycin.
Rumen ammonia nitrogen levels (RAN) were similar (p > 0.05) in the experimental diets, above 8 mg dL−1 - the minimum needed to maximize fiber degradation. A reduction of ruminal ammonia and blood urea nitrogen (BUN) with antibiotics would be expected, due to the reduction in amino acid deamination.
Although not significant (p > 0.05), the addition of virginiamycin decreased RAN by 14 % and reduced it to below 8 mg dL−1 for a long period during the day (Figure 1). Moreover, a 9 % BUN reduction was observed, compared to the control diet. In this study, mean levels of BUN were 20.54 mg dL−1, i.e., approximately at the limit of 19-20 mg dL−1 at which dietary nitrogen losses could occur in dairy cows (Oliveira et al., 2001).
No differences were observed (p > 0.05) in rumi-nal pH between diets (Table 5). The pH of high-forage diets did not change with the addition of antimicrobials (Clayton et al., 1999). Grazing, ruminating and iddle times did not differ (p > 0.05) between experimental diets (Table 6). Other parameters such as pasture selec-tion and bite size influenced the intake rates, as salino-mycin or virginiasalino-mycin reduced pasture intake without affecting grazing time.
Grazing time reflects the ease of forage access and removal. The time spent grazing varies between 359 and 711 min d−1 (Krysl and Hess, 1993), and grazing times longer than 480-540 min d−1 probably indicate limited conditions for forage intake (Hodgson, 1990). In this study, the mean grazing time was 328 min d−1, as a result of good quality forage (Table 2), pasture availability (Table 1) and the provision of part of the diet in feeders.
The addition of salinomycin or virginiamycin for mid-lactation dairy cows improved FE, because it reduced DMI without affecting milk production and milk composition.
Figure 1− Ruminal Ammonia Nitrogen (RAN) before 0, and at 2, 4, 6 and 8 h after feeding in control (C), salinomycin (S), virginiamycin (V), and salinomycin and virginiamycin (SV). Bars show the standard error of mean.
Table 6 − Feeding behavior of lactating dairy cows (min d−1).
Variables Treatments
1
Means SEM3 p2
C S V SV
Grazing 295 316 324 301 328 42 0.12
Rumination 539 537 559 567 550 27 0.33
Iddle 549 529 496 501 519 38 0.13
1Control (C), salinomycin (S), virginiamycin (V), and salinomycin and virginiamycin (SV); 2means followed by different letters in the line statistically differ by Tukey’s test; 3SEM: standard error of the mean.
Table 5 − Values of dry matter digestibility, pH, ammonia nitrogen and blood urea.
Items Treatments
1
Means SEM3 p2
C S V SV
DDM4 65.62 66.20 65.26 64.19 65.32 2.11 0.15 DCP4 71.44 73.22 73.01 70.25 71.98 2.20 0.22 DNDF4 64.20a 63.46a 61.48ab 60.01b 62.29 3.93 0.02 DEE4 80.05 77.33 78.82 80.53 79.18 7.00 0.91 DNFC4 77.47 76.69 78.97 79.60 78.18 2.63 0.41 RAN5 11.46a 11.01a 9.86b 9.54b 10.94 1.48 0.09
pH6 6.5 6.4 6.5 6.6 6.5 0.15 0.21
References
Association of Official Analytical Chemists [AOAC]. 2005. Official Methods Of Analysis. 18ed. AOAC, Gaithersburg, MD, USA. Bagley, C.P.; Feazel, J.I.; Morrison, D.G.; Lucas, D.M. 1988. Effects
of Salinomycin on Ruminal characteristics and performance of grazing beef steers. Journal of Animal Science 66: 792-797. Boon, B.; Dewart, R. 1974. Methods for identification and assay of
virginiamycin in animal feeds. Analyst 99: 19-25.
Clayton, E.H.; Lean, I.J.; Rowe, J.B.; Cox, J.W. 1999. Effects of feeding virginiamycin and sodium bicarbonate to grazing lactating dairy cows. Journal of Dairy Science82: 1545-1554. Detmann, E.; Paulino, M.F.; Zervoudakisi, J.T.; Valadares Filho,
S.C.; Euclydes, R.F.; Lana, R.P.; Queiroz, D.S. 2001. Chromium and internal markers in intake determination by crossbred steers, supplemented at pasture. Brazilian Journal of Animal Science 30: 1600-1609 (in Portuguese, with abstract in English). Duffield, T.F.; Rabiee, A.R.; Lean, I.J. 2008. A meta-analysis of the
impact of monensin in lactating dairy cattle. Part 2. Production effects. Journal of Dairy Science 91:1347-1360.
Erasmus, L.J.; Muya, A.C.; Erasmus, A.S.; Coertze, B.R.F.; Catto, B.D.G. 2008. Effect of virginiamycin and monensin supplementation on performance of multiparous Holstein cows. Livestock Science 119: 107-115.
Gandra, J.R.; Rennó, F.P.; Freitas Júnior, J.E.; Santos, M.V.; Silva, L.F.P.; Araújo, A.P.C. 2010. Productive performance and milk protein fraction composition of dairy cows supplemented with sodium monensin. Brazilian Journal of Animal Science 39: 1810-1817 (in Portuguese, with abstract in English).
Hall, M.B. 2000. Calculation of Non-Structural Carbohydrate Content of Feeds That Contain Non-Protein Nitrogen. University of Florida, Gainesville, FL, USA. (Bulletin, 339 A-25).
Hodgson, J. 1990. Grazing Management: Science into Practice. Longman, Essex, UK.
Hof, G.; Vervoorn, M.D.; Lenaers, P.J.; Tamminga, S. 1997. Milk urea nitrogen as a tool to monitor the protein nutrition of dairy cows.Journal of Dairy Science 80: 3333-3340.
International Dairy Federation [IDF]. 1996. Whole milk - determination of milk fat, protein and lactose content: guide for the operation of mid-infrared instruments. IDF, Brussels: IDF, Belgium.
Ipharraguerre, I.R.; Clark, J.H. 2003.Usefulness of ionophores for lactating dairy cows: a review. Animal Feed Science and Technology 106: 39-57.
Krysl, L.J.; Hess, B.W. 1993. Influence of supplementation on behavior of grazing cattle. Journal of Animal Science 71: 2546-2555.
Licitra, G.; Hernandez, T.M.; Soest, P.J. van. 1996. Standardization of procedures for nitrogen fractionation of ruminant feeds. Animal Feed Science and Technology 57: 347-358.
McGuffey, R.K.; Richardson, L.F.; Wilkinson, J.I.D. 2001. Ionophores for dairy cattle: current status and future outlook. Journal of Dairy Science 84 Suppl.: E194-E203.
Merchen, N.R.; Berger, L.L. 1985. Effect of salinomycin level on nutrient digestibility and ruminal characteristics of sheep and feedlot performance of cattle. Journal of Animal Science 60: 1338-1346.
Mertens, D.R. 2002. Gravimetric determination of amylase-treated neutral detergent fiber in feeds with refluxing in beakers or crucibles: collaborative study. Journal of AOAC International85: 1217-1240.
Mertens, D.R. 1987. Predicting intake and digestibility using mathematical models of ruminal function. Journal of Animal Science 64: 1548-1558.
National Research Council [NRC]. 2001. Nutrient Requirements of Dairy Cattle. 7ed. National Academies Press, Washington, DC, USA.
Nuñez, A.J.C.; Caetano, M.; Berndt, A.; Demarchi, J.J.A.A.; Leme, P.R.; Lanna, D.P.D. 2013. Combined use of ionophore and virginiamycin for finishing Nellore steers fed high concentrate diets. Scientia Agricola 70: 229-236.
Oliveira, A.S.; Valadares, R.F.D.; Valadares Filho, S.C.; Cecon, P.R.; Rennó, L.N.; Queiroz, A.C.; Chizzotti, M.L. 2001. Microbial protein production, purine derivatives and urea excretion estimate in lactating dairy cows fed isoprotein diets with different non protein nitrogen compounds levels. Brazilian Journal of Animal Science 30: 1621-1629 (in Portuguese, with abstract in English).
Ravindran, V.; Kronegay, E.T.; Webb Jr, K.E. 1984. Effects of fiber and virginiamycin on nutrient absorption, nutrient retention, and rate of passage in growing swine. Journal of Animal Science 59: 400-408.
Rogers, J.A.; Branine, M.E.; Miller C.R.; Wray, M.I.; Bartle, S.J.; Preston, R.L.; Gill, D.R.; Pritchard, R.H.; Stilborn, R.P.; Bechtol, D.T. 1995. Effect of dietary virginiamycin on performance and liver abscess incidence in feedlot cattle. Journal of Animal Science 73: 9-20.
Salinas-Chavira, J.; Lenin, J.; Ponce, E.; Sanchez, U.; Torrentera, N.; Zinn, R.A. 2009. Comparative effects of virginiamycin supplementation on characteristics of growth-performance, dietary energetics, and digestion of calf-fed Holstein steers. Journal of Animal Science 87: 4101-4108.
Silva, S.L.; Almeida, R.; Schwahofer, D.; Leme, P.R.; Lanna, D.P.D. 2004. Effects of salinomycin and virginiamycin on performance and carcass traits of feedlot steers. Journal of Animal Science 82: 41-42.