Acta Scientiarum
http://www.uem.br/acta ISSN printed: 1806-2636 ISSN on-line: 1807-8672
Doi: 10.4025/actascianimsci.v38i1.29150
Protected fat and variable level of protein
in diets of crossbreed
cows in early lactation
Alcy Heleno de Souza Júnior, Rogério de Paula Lana, César Roberto Viana Teixeira*, Mateus Pies Gionbelli, Cristina Mattos Veloso and Luciana Navajas Rennó
Departamento de Zootecnia, Universidade Federal de Viçosa, Av. Peter Henry Rolfs, s/n.º, 36570-900, Viçosa, Minas Gerais, Brazil. *Author for correspondence. E-mail: [email protected]
ABSTRACT. Current study evaluated the inclusion of protected fat and different levels of crude protein (CP) in the diet of crossbreed cows in early lactation. Twelve cows were distributed in a 4 x 4 factorial design, with four treatments (12 or 16% CP, with or without MEGALAC-E®). Statistical analyzes with
ANOVA and Pearson’s linear correlation procedures were performed. Protected fat did not affect intake of dry matter (DM) and organic matter (OM) (p > 0.05). Increased CP raised consumption of CP and EE and decreased the non-fiber carbohydrates (NFC; p <0.05). Protected fat increased (p <0.05) the digestibility of DM, OM, CP and ashes in the lower protein content. CP increase raised the level of blood and urinary urea (p < 0.05). There was no difference (p > 0.05) on milk yield and composition due to protected fat or CP rates. Since the inclusion of protected fat and higher content of CP (16%) in the diet did not benefit the production and composition of milk in crossbreed cows, diets with 12% CP without the inclusion of protected fat are recommended.
Keywords: concentrate, dietary protein, digestibility, intake, lipid supplementation, milk yield.
Gordura protegida e nível variável de proteína em dietas para vacas mestiças no terço
inicial da lactação
RESUMO. O objetivo desse estudo foi avaliar a inclusão de gordura protegida e de diferentes níveis de PB, na dieta para vacas mestiças, no início da lactação. Foram utilizadas 12 vacas, distribuídas em quadrados latinos 4 x 4 e quatro tratamentos (12 ou 16% de PB, com ou sem MEGALAC-E®). Análises estatísticas
foram realizadas utilizando Anova e correlações lineares de Pearson. A gordura protegida não influenciou o consumo de MS e MO (p > 0,05). O aumento de PB elevou o consumo de PB e EE e diminuiu o de carboidratos não fibrosos (CNF; P<0,05). A gordura protegida aumentou (p < 0,05) a digestibilidade da MS, MO, PB e cinzas no menor teor de proteína. O aumento de PB elevou os níveis de ureia sanguínea e urinária (p < 0,05). Não houve diferença (p > 0,05) na produção e composição do leite em função da gordura protegida ou do teor de PB. A inclusão de gordura protegida e o maior teor de PB (16%) na dieta não resultaram em benefícios na produção e composição do leite de vacas mestiças, portanto recomenda-se utilizar dietas contendo 12% de PB, sem a inclusão de gordura protegida.
Palavras-chave: concentrado, proteína dietética, digestibilidade, consumo, suplementação lipídica, produção de leite.
Introduction
Brazil has the biggest dairy livestock herd in the world and ranks fifth in milk production, with 31 billion liters/year, second only to Russia (32 billions), China (34 billions), United States (91 billions) and India (129 billions) Anuário da pecuária brasileira (ANUALPEC, 2013). Dairy agribusiness is highly relevant in Brazilian economy and highly promising in estimates for production and productivity growth due to higher indexes than those featured in recent years (Amorim, Torres, Moraes, Silva Filho, & Guimarães, 2007).
Lipids are energy sources with available high energy concentrations featuring high percentages of fatty acids with 2.25 times more energy than carbohydrates (NRC, 2001). Lipid supplements are used in diets for lactation cows to increase milk production and reduce body mobilization (Silva et al., 2007).
As a rule, nutrition factors in the feed of dairy cow fail to restore essential fatty acids secreted into the milk. In fact, due to high bio-hydrogenation in the rumen, only 15-25 % of the polyunsaturated fatty acids in conventional feed reach the intestine and are absorbed. Further, the addition of high lipid rates in the diet may have an inhibitory effect on ruminal fermentation, mainly through fiber degradation (NRC, 2007; Santos, Bilby, Thatcher, Staples, & Silvestre, 2008).
Protected fat (MEGALAC-E®) has the best concentration of fatty acids. Since it is protected by calcium salts, it is neither subjected to microorganisms nor damaged by ruminal fermentation in normal pH conditions. However, it dissociates completely in the acid conditions of the abomasum, with high absorption in the intestine (Sartori & Mollo, 2007). In fact, it is an alternative to minimize NEB in cows during the post-partum period.
Similarly, since lactating cows have a greater protein demand for milk production, frequently this requirement is not attended to due to a low DM ingestion by cows in early lactation (Kalscheur, Vandersall, Erdman, Kohn, & Russek-Cohen, 1999). In fact, increase in the protein rate of diets raises the intake and consumption of CP even with a restricted DM consumption.
Current assay evaluates the inclusion of protected fat and two different protein levels in the diet of cross-breed cows in early lactation on the consumption and digestibility of nutrients, production and physical and chemical composition of milk.
Material and methods
The experiment was conducted on the Fazenda Vargem Rica, in the municipality of Tabuleiro, Minas Gerias State, Brazil, between October and December. Twelve primiparous cross-breed (Holstein x Zebu) cows in early lactation were used. The cows, with average initial weight 462 kg and a potential production of approximately 6,000 kg of milk, mean 18 kg of milk day-1, were distributed in three 4 x 4 factorial designs. Treatments comprised 12% CP and 14% MEGALAC-E® in total ether extract (EE) of concentrate (Treatment 1), 12% CP without MEGALAC-E® (Treatment 2); 16% CP and 14% MEGALAC-E® in total percentage of EE (Treatment 3) and 16% CP without MEGALAC-E® (Treatment 4). Further, 1% urea+ammonium sulfate at a proportion of 9:1, based on natural matter, was added in all treatments. The animals were fed on disintegrated elephant grass (Pennisetum
purpureum sp. Cv Napier), at a proportion of 70:30
(roughage:concentrate) as roughage source.
Assay comprised four 17-day periods, with the first ten days for adaptation and the rest to evaluate consumption, apparent digestibility, production, milk composition and concentration of urea in blood and urine. The animals were kept in individual tie-stall pens, with feed ad libitum, renewed twice a day, at 7.00 a.m and 16.00 p.m hours.
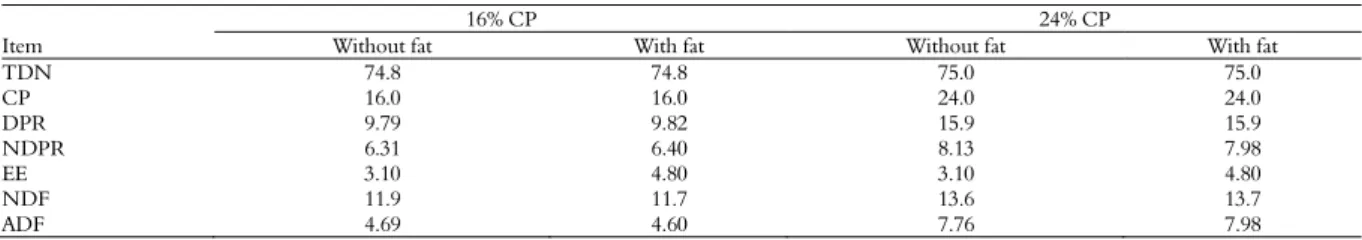
Concentrate of diets comprised corn meal, soy bran, cottonseed bran, wheat bran and mineral mixture. Iso-protein diets T1 and T2 (12% CP) and T3 and T4 (16% CP) were prepared to attend to energy requirements, according to NRC (2001). Tables 1, 2 and 3 show the chemical composition of concentrates, roughage and total diets, respectively.
Table 1. Composition of concentrates in dry matter percentage (%DM).
Item
16% CP 24% CP
Without fat With fat Without fat With fat
TDN 74.8 74.8 75.0 75.0
CP 16.0 16.0 24.0 24.0
DPR 9.79 9.82 15.9 15.9
NDPR 6.31 6.40 8.13 7.98
EE 3.10 4.80 3.10 4.80
NDF 11.9 11.7 13.6 13.7
ADF 4.69 4.60 7.76 7.98
TDN – total digestible nutrients; CP – crude protein; DPR – degradable protein in the rumen; NDPR – non-degradable protein in the rumen; EE – ether extract; FDN – neutral detergent fiber; FDA – acid detergent fiber.
Table 2. Composition of Pennisetum purpureum sp. Cv Napier in dry matter percentage (%DM).
Item 1 st Period 2 nd Period 3 rd Period 4 th Period
CP 5.12 4.65 4.12 3.70
EE 1.20 1.18 1.15 1.16
NDFap 61.52 63.78 61.02 63.92 NFCap 25.28 24.69 26.85 24.84
Supplementation of dairy cows during lactation 109
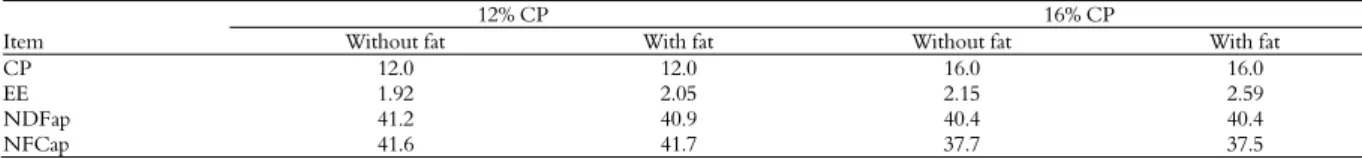
Table 3. Composition of experimental diets according to rates of crude protein (CP) and addition of supplement protected fat in percentage of dry matter (%DM).
Item
12% CP 16% CP
Without fat With fat Without fat With fat
CP 12.0 12.0 16.0 16.0
EE 1.92 2.05 2.15 2.59
NDFap 41.2 40.9 40.4 40.4
NFCap 41.6 41.7 37.7 37.5
CP – crude protein; EE –ether extract; NDFap – neutral detergent fiber corrected for ashes and proteins; NFCap – non fibrous carbohydrates corrected for ashes and protein = 100-%CP-%EE-%Cz-%NDFap.
Weight of feed provided and leftover in each treatment were taken to estimate intake. Sampling of diet and leftovers was performed during morning feed along the experimental period
Feces were collected directly from the rectus at 16, 14, 12, 10 and 8.00 hours on the 13 and 17th day of each experimental period. Lignin was the internal index for estimates in fecal production. Urine was collected by spot method, or rather, a single collection at 11.00 a.m hours on the 16th day of each period. Urine samples were filtered in a triple gauze filter and divided into two samples per animal, at each period: one sub-sample with concentrated urine and the other with 10 mL urine diluted in 40 mL sulfuric acid 0.036 N. Blood was collected at 11.00 hours on the 17th day in each experimental period.
The cows were mechanically milked twice a day and milk production reported. Milk samples were collected on the 15th day of each period during the morning and afternoon milking. A compound sample of approximately 300 mL was prepared to analyze rates of crude protein, fat, lactose, total dry extract and defatted dry extract.
Milk was analyzed at the laboratory of Milk and Quality Analysis of the Embrapa Gado de Leite in Juiz de For a, Minas Gerais State, Brazil, by infrared spectrometry (Bentley 2000 Infrared Milk Analyzer, Bentley Instruments)
The production of corrected milk (PCM) for 3.5% fat was estimated following Sklan, Ashkenazi, Braun, Devorin and Tabori (1992) with the following equation: PCM = (0.432 + 0.1625 x % milk fat) x milk production in kg day-1.
Samples of daily food compound provided and leftovers samples of each animal underwent chemical analyses according to method by Detmann, Souza and Valadares (2012).
At the end of the experiment, blood plasma was thawed at room temperature and analyzed to determine urea, following modified diacetyl method, with picrate and acidifier. Plasma N-urea concentration was obtained by multiplying the urea concentration in the plasma by 0.466, corresponding the N rates in the urea. Samples of urine were analyzed similarly.
Statistical analyses were done by ANOVA to determine the main effects and the effects of interaction. Data were analyzed according to the statistical model below:
Yijklm = μ + Pi + Mj + PMij + A/QLk + PEl + Eijklm, where Yijklm is the experimental unit m, at the lth period, kth animal within the latin square, jth level of MEGALAC-E® and ith protein; μ, general average; Pi = effect of protein level i; i = 1 and 2; Mj = effect of level of MEGALAC-E® j; j = 1 and 2; PM
ij =effect of the interaction between protein levels and MEGALAC-E®; A QL
k-1 = effect of animal within the latin square k; k = 1, 2 and 3; PEl =effect of period l; l = 1, 2, 3 and 4; Eijk random error associated to each observation; ~ NID (0, σ2). Pearson’s linear correlations were performed among the variables evaluated.
Results and discussion
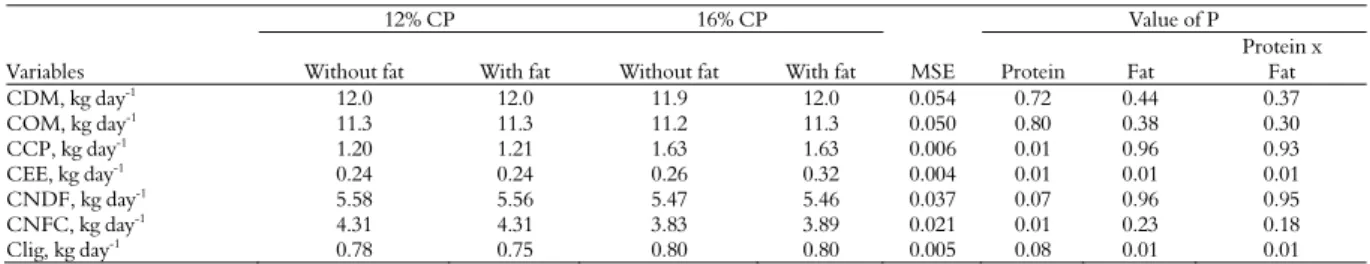
Treatments had no effect on consumption of dry matter (DM) and organic matter (OM) (p > 0.05; Table 4). Protein in the diet increased CP and EE consumption and decreased the consumption of non-fibrous carbohydrates (p < 0.05). Protected fat and protein level interacted and EE consumption increased in the treatment with 16% CP and a reduction of lignin intake in treatment with 12% CP (p < 0.05). The effect of protein level on consumption and of protected fat on EE consumption was expected even though in this case it merely occurred at a higher protein level. Research by Pereira et al. (2005) and Cordeiro et al. (2007) revealed that consumption of DM increased linearly with a rise in CP in the diet of dairy cows during early lactation. The above did not occur in current assay.
Rabiee et al. (2012) conducted a meta-analysis based on 59 studies on the effect of lipid supplementation in Holstein cows where consumption in DM decreased with lipid supplementation. In current study, consumption of DM was not affected, corroborating results by Weisbjerg et al. (2013) and Alstrup et al. (2015).
Table 4. Consumption of diet components according to crude protein (CP) rate and protected fat supplementation.
Variables
12% CP 16% CP Value of P
Without fat With fat Without fat With fat MSE Protein Fat
Protein x Fat
CDM, kg day-1 12.0 12.0 11.9 12.0 0.054 0.72 0.44 0.37
COM, kg day-1 11.3 11.3 11.2 11.3 0.050 0.80 0.38 0.30
CCP, kg day-1
1.20 1.21 1.63 1.63 0.006 0.01 0.96 0.93
CEE, kg day-1 0.24 0.24 0.26 0.32 0.004 0.01 0.01 0.01
CNDF, kg day-1 5.58 5.56 5.47 5.46 0.037 0.07 0.96 0.95
CNFC, kg day-1 4.31 4.31 3.83 3.89 0.021 0.01 0.23 0.18
Clig, kg day-1 0.78 0.75 0.80 0.80 0.005 0.08 0.01 0.01
CDM – Consumption of dry matter; COM – Consumption of organic matter; CCP – Consumption of crude protein; CEE – Consumption of ether extract; CMDF – Consumption of neutral detergent fiber; CNFC- Consumption of non-fibrous carbohydrates; Clig – Consumption of lignin; MSE – mean standard error; P – statistical probability.
Table 5. Coefficients of digestibility, availability of ashes and total digestible nutrients of diets according to crude protein (CP) rate and supplemented protected fat addition.
Variables
12% CP 16% CP Value of P
Without fat With fat Without fat With fat MSE Protein Fat Protein x Fat
CDDM, % 62.30 66.00 61.80 60.03 0.014 0.91 0.03 0.04
CDOM, % 62.00 66.80 60.00 59.80 0.010 0.67 0.05 0.05
CDCP, % 65.10 72.40 79.60 73.00 0.011 0.01 0.01 0.01
CDEE, % 70.20 75.90 77.00 82.04 0.015 0.11 0.53 0.70
CDNDFap , % 64.80 68.00 62.60 61.00 0.023 0.62 0.11 0.11
CDNFCap, % 63.00 66.00 60.00 58.20 0.037 0.01 0.42 0.44
AVashes, % 46.80 50.20 55.10 52.30 0.017 0.01 0.02 0.02
TDN, % 63.75 67.52 64.37 62.85 0.010 0.73 0.07 0.08
CDDM – Coefficient of digestibility of dry matter; CDOM – Coefficient of digestibility of organic matter; CDCP – Coefficient of digestibility of crude protein; CDEE – Coefficient of digestibility of ether extract; CDNDFap – Coefficient of digestibility of neutral detergent fiber corrected for ashes and protein; CDNFCap – Coefficient of digestibility of non-fibrous carbohydrates corrected for ashes and protein; AVashes – Availability of ashes; TDN – Total digestible nutrients = (%CP x CDCP x 0.01) + (2.25 x %EE x CDEE x 0.01) + (%NDFap x CDNDFap x 0.01) + (%NFCap x CDNFCap x 0.01); MSE – mean standard error; P – statistical probability.
The above result was corroborated by Pereira et al. (2005) who reported that the intake of nitrogen compounds was important to microbial requirements, with an increase in food uptake. The above was due to the fact that soy, cotton seed and wheat bran in great amounts of the diets with high protein rates had a higher degradability of protein and availability of ashes and less application of non-fibrous carbohydrates when compared to other diet ingredients.
Interaction occurred between protected fat and protein level in the diet (p < 0.05), with an increase in DM, OM and CP digestibility and availability of ashes in the lowest protein rate and an opposite effect in the highest protein rate (Table 5). However, treatments did not affect the rate of total digestible nutrients of the diets (p > 0.05; Table 5).
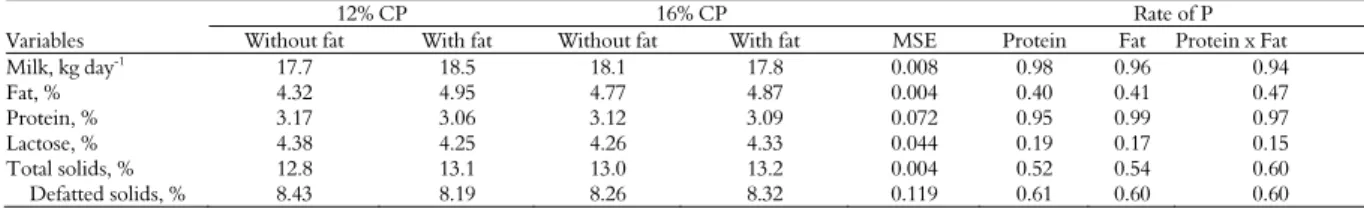
There was no significant difference in treatments (p > 0.05) on milk production and composition (Table 6), corroborating results in DM consumption (Table 4) and TDN of diets (Table 5). However, contrastingly to results in current study, Ghoreishi, Zamiri, Rowghani and Hejazi (2007) reported that the use of protected fat affected positively the animals’ body condition, fertility rate and milk production. Further Santos et al. (2009) reported improvement in food efficiency due to higher metabolizable energy rates in lipids when compared to carbohydrates and protein.
Fat is the most variable milk component due to diet and normally indicates changes in the process of ruminal fermentation (Santos et al. 2012). Valadares,
Broderick, Valadares and Clayton (2000) reported decrease in milk fat rates when the cows were fed on diets with high NFC rates which increased the ruminal propionate, lowered the ratio acetate:propionate and ruminal pH. Significant variations were not reported with regard to milk fat rates in current analysis.
Blood degree is another factor related to milk composition in cross-breed animals. Nellore cows have an increase in fat and protein rates as gene fractions of Holstein strain decrease (Teixeira et al., 2015). In current analysis, fat percentage averaged 4.73%, but mean fat percentage in the milk of pure Holstein cows was 3.66% (Aikman, Reynolds, Beever, 2007).
Protein increase in the diet raised the levels of blood and urine urea (p < 0.05), and corroborated results by Valadares, Broderick, Valadares and Clayton (1999). Protected fat did not affect the variables (Table 7). According to Broderick & Clayton (1997), the concentrations of urea nitrogen rates in the blood higher than 19 mg dL-1 are the limit for diet nitrogen loss. In fact, the concentrate above this limit would indicate inefficiency in the use of diet protein by dairy cows. Current analysis shows that diets with 16% CP have higher rates. According to Broderick & Clayton (1997), these diets are inefficient and characterize CP loss.
Supplementation of dairy cows during lactation 111
Table 6. Milk production and composition according to crude protein (CP) rate in the diet and supplemented protected fat.
Variables
12% CP 16% CP Rate of P
Without fat With fat Without fat With fat MSE Protein Fat Protein x Fat
Milk, kg day-1 17.7 18.5 18.1 17.8 0.008 0.98 0.96 0.94
Fat, % 4.32 4.95 4.77 4.87 0.004 0.40 0.41 0.47
Protein, % 3.17 3.06 3.12 3.09 0.072 0.95 0.99 0.97
Lactose, % 4.38 4.25 4.26 4.33 0.044 0.19 0.17 0.15
Total solids, % 12.8 13.1 13.0 13.2 0.004 0.52 0.54 0.60
Defatted solids, % 8.43 8.19 8.26 8.32 0.119 0.61 0.60 0.60
MSE – mean standard error; P – statistical probability.
Table 7. Urine and blood parameters according to rates of crude protein (CP) and supplements of protected fat.
Variables
12% CP 16% CP Value of P
Without fat With fat Without fat With fat MSE Protein Fat Protein x Fat
Blood urea, N-urea mg dL-1 15.9 14.0 28.4 27.4 0.006 0.01 0.14 0.23
Urinary Urea, mM 672 702 1791 1764 0.488 0.01 0.83 0.81
MSE – mean standard error; P – statistical probability.
Table 8. Pearson’s linear co-relation among variable evaluated in the experiment.
Item
CB %
Mega- lac
IDM Kg d-1
ICP Kg d-1
CEE Kg d-1
PV kg
Milke Kg d-1
Fat %
Protein %
Lactose %
TS %
DS %
TDN %
Diet R$ kg-1
Blood urea. mg dL-1 Megalac 0,01
IDM, kg d-1
0,06 0,12
ICP, kg d-1 0,99 0,02 0,16
CEE, kg d-1 0,70 0,36 0,15 0,68
LW, kg 0,22 -0,08 0,09 0,24 0,20
Milk, kg d-1 -0,02 0,04 0,15 0,01 -0,01 0,22 Fat, % 0,04 0,08 -0,10 -0,01 0,25 -0,27 -0,10 Protein, % -0,02 -0,12 -0,03 -0,02 -0,01 0,27 -0,42 -0,11 Lactose, % -0,04 -0,06 0,22 -0,01 -0,10 0,22 -0,27 -0,34 0,54
TS, % 0,04 0,06 -0,09 -0,01 0,25 -0,22 -0,19 0,98 0,07 -0,17
DS, % -0,02 -0,10 0,05 -0,02 -0,03 0,25 -0,44 -0,14 0,90 0,84 0,06 TDN, % -0,34 0,10 -0,38 -0,36 -0,31 0,09 0,13 -0,22 0,14 0,01 -0,20 0,08
Diet, R$ kg-1 0,79 0,45 0,08 0,78 0,86 0,22 -0,01 0,02 -0,01 0,01 0,03 0,01 -0,20 Blood urea. Mg dL-1 0,94 -0,11 0,04 0,93 0,62 0,18 0,05 0,10 -0,02 -0,02 0,10 -0,01 -0,32 0,70 Urinary urea. mM 0,96 0,01 0,10 0,96 0,62 0,19 -0,02 -0,01 0,01 0,02 -0,01 0,02 -0,33 0,72 0,90
CP– crude protein; Megalac – trade mark of protected fat; IDM – intake of dry matter; ICP – intake of crude protein; CEE – intake of ether extract; PV – live weight; ST – total solids; DS – defatted solids; NDT – total digestible nutrients; Blood Urea. – blood urea; Urinary urea. – urinary urea.
Diet cost positively related to levels of blood (r = 0.70) and urinary (r = 0.72) urea, positively co-related (r = 0.90). Co-relationship in the first case are indirectly due to an increase in diet costs to increase protein rates in diets using soy, cottonseed and wheat bran which, in turn, increases the blood and urinary concentrations of nitrogen.
Protein level in the diet is co-related to CP (r = 0.99) and EE (r = 0.70) intake, diet costs (r = 0.79) and blood (r = 0.94) and urinary (r = 0.96) urea levels. All co-relationships were expected.
EE intake was positively co-related with CP intake (r = 0.68) and both were positively co-related with ration costs (r = 0.86; r = 0.78) and with levels of blood (r = 0.62; r = 0.93) and urinary (r = 0.62; r = 0.96) urea levels.
There was a positive co-relationship between total solids and fat rates in milk (r = 0.98), which is the most variable component in milk when diets are modified. In the case of defatted solids, there was a positive co-relationship with protein (r = 0.90) and lactose (r = 0.84) rates, as expected, due to being the main constituents.
Conclusion
The inclusion of protected fat and highest protein rate (16%) in the diet failed to benefit milk production and composition in cross-breed dairy cows, with a mean production of 18 kg milk day-1. Diets with 12% crude protein in total dry matter without including protected fat are recommended for the type of animal under analysis.
References
Aikman, P. C., Reynolds, C. K., & Beever, D. E. (2007). Diet digestibility, rate of passage, and eating and rumination behavior of Jersey and Holstein cows.
Journal of Dairy Science, 91(3), 1103-1114.
Amorim. L. S., Torres, C. A. A., Moraes, E. A., Silva Filho, J. M., & Guimarães, J. D. (2007). Perfil metabólico de touros da raça Nelore (Bos Taurus
indicus) tratados com somatotropina bovina
recombinante (r-bst). Arquivo Brasileiro de Medicina
Veterinária e Zootecnia, 59(2), 434-442.
Anuário da Pecuária Brasileira (Anualpec). (2013). Anuário
da pecuária brasileira. São Paulo: FNP Consultoria &
Alstrup, L., Nielsen, M. O., Lund, P., Sehested, J., Larsen,
M. K., & Weisbjerg, M. R. (2015). Milk yield, feed efficiency and metabolic profiles in Jersey and Holstein cows assigned to different fat supplementation strategies. Livestock Science, 178(1), 165-176.
Broderick, G. A., & Clayton, M. K. (1997). A statistical evaluation of animal and nutritional factors influencing concentrations of milk urea nitrogen.
Journal of Dairy Science, 80(11), 2964-2971.
Cordeiro, C. F. A., Pereira, M. L. A., Mendonça, S. S., Almeida, P. J. P., Aguiar, L. V., & Figueiredo, M. P. (2007). Consumo e digestibilidade total dos nutrientes e produção e composição do leite de vacas alimentadas com teores crescentes de proteína bruta na dieta contendo cana-de-açúcar e concentrados. Revista
Brasileira de Zootecnia, 36(6), 2118-2126.
Detmann, E., Souza, M. A., & Valadares, S. C., Filho. (2012). Métodos para análise de alimentos. Visconde do Rio Branco: Suprema.
Ghoreishi, S. M., Zamiri, M. J., Rowghani, E., & Hejazi, H. (2007). Effect of a calcium soap of fatty acids on reproductive characteristics and lactation performance of fat-tailed sheep. Pakistan Journal of Biological Sciences, 10(14), 2389-2395.
Kalscheur, K. F., Vandersall, J. H., Erdman, R. A., Kohn, R. A., & Russek-Cohen, E. (1999). Effects of dietary crude protein concentration and degradability on milk production responses of early, mid, and late lactation dairy cows. Journal of Dairy Science, 82(3), 545-554. National Research Council (NRC). (2001). Nutrient
requirements of dairy cattle (7th ed., p. 381). Washington,
D.C.: National Academy Press.
National Research Council (NRC). (2007). Nutrients
requirements of sheep (6th ed., p. 362). Washington,
D.C.: National Academies Press.
Pereira, M. L. A., Valadares Filho, S. C., Valadares, R. F. D., Campos, J. M. S., Leão, M. I., Pereira, C. A. R., .... Mendonça, S. S. (2005). Consumo, digestibilidade aparente total, produção e composição do leite em vacas no terço inicial da lactação alimentadas com níveis crescentes de proteína bruta no concentrado.
Revista Brasileira de Zootecnia, 34(3), 1029-1039.
Rabiee, A. R., Breinhild, K., Scott, W., Golder, H. M., Block, E., & Lean, I. J. (2012). Effect of fat additions to diets of dairy cattle on milk production and components: a meta-analysis and meta-regression.
Journal of Dairy Science, 95(6), 3225-3247.
Santos, J. E. P., Bilby, T. R., Thatcher, W. W., Staples, C. R., & Silvestre, F. T. (2008). Long chain fatty acids of diet as factors influencing reproduction in cattle.
Reproduction in Domestic Animals, 43(2), 23-30.
Santos, G. M. G., Silva, K. C. F., Casimiro, T. R., Costa, M.C.,Mori,R.M.,Mizubuti, L. Y.,...Seneda,M. M. (2009). Reproductive performance of ewes mated in the spring when given nutritional supplements to enhance energy levels. Animal Reproduction, 6(2), 422-427.
Santos, S. A., Valadares, S. C. Filho., Detmann, E., Valadares, R. F. D., Ruas, J. R. M., Prados, L. F., .... Mariz, L. D. S. (2012). Intake, digestibility and nitrogen use efficiency in crossbred F1 Holstein Zebu grazing cows. Revista Brasileira de Zootecnia, 41(4), 1025-1034.
Sartori, R. & Mollo, M. R. (2007). Influência da ingestão alimentar na fisiologia reprodutiva da fêmea bovina.
Revista Brasileira de Reprodução Animal, 31(2), 197-204.
Silva, M. M. C., Rodrigues, M. T., Branco, R. H., Rodrigues, C. A. F., Sarmento, J. L. R., Queiroz, A. C., & Silva, S. P. (2007). Suplementação de lipídios em dietas para cabras em lactação: consumo e eficiência de utilização de nutrientes. Revista Brasileira
de Zootecnia, 36(1), 257-267.
Sklan, D., Ashkenazi, R., Braun, A., Devorin, A., & Tabori, K. (1992). Fatty acids, calcium soaps of fatty acids and cottonseeds fed to high yielding cows.
Journal of Dairy Science, 75(9), 2463-2472.
Teixeira, C. R. V., Lana, R. P., Rennó, L. N., Veloso, C. M., Carvalho, J. C., & Menezes, A. A. (2015). Urea and salt as supplementary diet for crossbreed milk cows. Acta Scientiarum. Animal Sciences, 37(3), 281-287. Valadares, R. F. D., Broderick, G. A., Valadares, S. C.
Filho., & Clayton, M. K. (1999). Effect of replacing alfalfa silage with high moisture corn on ruminal protein synthesis estimated from excretion of total purine derivatives. Journal of Dairy Science, 82(11), 2686-2696.
Valadares, S. C. Filho., Broderick, G. A., Valadares, R. F. D., & Clayton, M. K. (2000). Effect of replacing alfalfa silage with high moisture corn on nutrient utilization and milk production. Journal of Dairy Science, 83(1), 106-114.
Weisbjerg, M. R., Larsen, M. K., Hymøller, L., Thorhauge, M., Kidmose, U., Nielsen, J. H., & Andersen, J. B. (2013). Milk production and composition in Danish Holstein, Danish Red, and Danish Jersey cows supplemented with saturated or unsaturated fat. Livestock Science, 155(1), 60-70.
Received on September 9, 2015. Accepted on October 14, 2015.