Application of succinylated sugarcane bagasse as adsorbent to remove methylene
blue and gentian violet from aqueous solutions
e
Kinetic and equilibrium studies
Karla Aparecida Guimarães Gusmão
a, Leandro Vinícius Alves Gurgel
b,
Tânia Márcia Sacramento Melo
a, Laurent Frédéric Gil
a,*aDepartamento de Química, ICEB, Campus Morro do Cruzeiro, Universidade Federal de Ouro Preto, 35400-000 Ouro Preto, MG, Brazil
bGrupo de Físico-química orgânica, Departamento de Físico-química, Instituto de Química de São Carlos, Universidade de São Paulo, Av. Trabalhador São Carlense 400,
Caixa Postal 780, 13560-970 São Carlos, Brazil
a r t i c l e
i n f o
Article history:
Received 7 March 2011 Received in revised form 31 August 2011
Accepted 9 September 2011 Available online 16 September 2011
Keywords:
Adsorption Adsorption kinetics Cationic dye Methylene blue Gentian violet
Succinylated sugarcane bagasse
a b s t r a c t
In a previous work, succinylated sugarcane bagasse (SCB 2) was prepared from sugarcane bagasse (B) using succinic anhydride as modifying agent. In this work the adsorption of cationic dyes onto SCB 2 from aqueous solutions was investigated. Methylene blue, MB, and gentian violet, GV, were selected as adsorbates. The capacity of SCB 2 to adsorb MB and GV from aqueous single dye solutions was evaluated at different contact times, pH, and initial adsorbent concentration. According to the obtained results, the adsorption processes could be described by the pseudo-second-order kinetic model. Adsorption isotherms were wellfitted by Langmuir model. Maximum adsorption capacities for MB and GV onto SCB 2 were found to be 478.5 and 1273.2 mg/g, respectively.
Ó2011 Elsevier Ltd. All rights reserved.
1. Introduction
The removal of dyes from wastewater is a matter of great interest in thefield of water pollution. Wastewaters from industries like dyestuffs, tannery, textiles, paper and plastics, contain various kinds of synthetic dyes[1,2]. There are more than 100,000 commercially available dyes and more than 7 105 metric tons of dyes are produced worldwide annually [3]. Recent studies indicate that approximately 12% of synthetic dyes are lost during manufacturing and processing operations and that 20% of the resultant color enters the environment through effluents from industrial wastewater treatment plants[4]. Wastewaters from these industries are highly colored and the release of these effluents in natural waters produces serious damage to the environment. Dyes are organic compounds with a chemical complex structure that are stable to light, heat, oxidizing agents and resistant to aerobic digestion[5,6]. Beyond the visual pollution[7], the contamination of natural waters with dyes produces modification in biological cycles affecting mainly photo-synthesis process. Many dyes are also toxic and even carcinogenic
affecting aquatic living organisms[8]. Studies showed that azo dyes and their sub-products may be carcinogenic and/or mutagenic [9e11]. In this current work, the two studied dyes are the cationic
dyes, methylene blue (MB) and gentian violet (GV). MB is the most commonly used substance for dying naturalfibers as cotton or silk. It can cause eye burns by direct contact and nausea, vomiting, profuse sweating, mental confusion and methemoglobinemia by ingestion[12]. GV is used to dye paper as a component of black inks for printing, ball-point pens and ink-jet printers and has a numerous medicinal application. It is harmful by inhalation, ingestion, through skin contact and has also been found to cause cancer and severe eye irritation in human beings[13]. Therefore, the treatment of effluent containing such dyes is of interest due to its harmful impacts on receiving waters.
Among the various chemical treatment techniques available, the most commonly used in the removal of contaminants from waste-water are reverse osmosis, ion exchange, adsorption and precipi-tation[14]. Due to these environmental reasons, new technologies for degradation and/or immobilization of dyes in wastewaters have been developed. Various techniques for the removal of dyes from
wastewaters have also been employed [1,15]. Among these
methods, adsorption is one of the most effective methods[14,16] and the main adsorbent used for this purpose is activated carbon. *Corresponding author. Tel.:þ55 31 3559 1717; fax:þ55 31 3551 1707.
E-mail address:[email protected](L.F. Gil).
Contents lists available atSciVerse ScienceDirect
Dyes and Pigments
j o u r n a l h o m e p a g e : w w w . e l s e v i e r . c o m / l o c a t e / d y e p i g
However, activated carbon presents several disadvantages[17]. It is quite expensive, non-selective and ineffective against disperse and vat dyes [18]. This has led many researchers to look for more economic and effective adsorbents as potential substitutes for activated carbon. Within this goal, natural materials like wood, peat, chitin, industrial, agricultural and domestic wastes and/or by-products such as shells of almond and hazelnut, orange peel, sawdust, corncob, rice husk or sugarcane bagasse have been largely studied to adsorb synthetic dyes[2,15]. In most cases, these mate-rials have been used as adsorbents without any chemical modifi -cation. In addition, the chemical modification can introduce functionality to these solid supports, increasing their adsorption capacity and efficiency. A few chemically modified lignocellulosic materials have also been used as dye adsorbents[19].
Sugarcane bagasse is an excellent solid support because it is inexpensive in comparison to other solid supports such as cellulose pulp, epoxy resins, chitosan, and synthetic polymers. Besides, owing to the increase of bioethanol production in countries such as Brazil, tons and tons of sugarcane bagasse have been produced. According to the last official survey from the Brazilian National Company of SupplyeCONAB, an agency from the Brazilian Ministry of
Agri-culture, the national production of sugarcane in 2009/2010 season was 558 million tons and represents the largest recorded produc-tion since records began. On average, 250 kg of sugarcane bagasse containing 50% moisture are produced by ton of sugarcane. In the industries of sugar and ethanol, bagasse has been burned to produce steam and energy for the process; nevertheless, the leftovers are still significant. The remaining bagasse still continues to be a menace to the environment and a more suitable and economic utilization may be the production of cellulosic ethanol for auto-motive fuel and green polyethylene as well as resins for the treat-ment of wastewater effluents. The composition of sugarcane bagasse is 40e50% cellulose, 25e30% hemicelluloses, and 20e25%
lignin[20].
In our previous works[20,21], succinylated sugarcane bagasse, SCB 2, was prepared from sugarcane bagasse, B, using succinic anhydride as derivatizing agent. In the adsorption studies, SCB 2 exhibited maximum adsorption capacities for Cu2þ, Cd2þ, Pb2þand Zn2þions of 185.2, 212.8, 416.7 and 125.0 mg/g, respectively. SCB 2 has negative charges due to the presence of carboxylate functions that are released after the modification with succinic anhydride and
treatment with sodium bicarbonate solution. These charges are able to interact with cationic dyes, removing them from aqueous solutions by adsorption process.
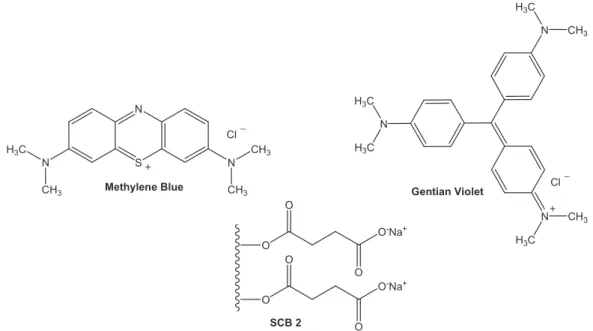
In the present work, the removal of the cationic dyes, methylene blue, MB, and gentian violet, GV, from aqueous single dye solutions using SCB 2 (Fig. 1), was studied. The adsorption studies were carried out using different contact times, pH, and initial dye concentration. The results were evaluated by three kinetic models and three adsorption models.
2. Materials and methods
2.1. Materials
Sugarcane bagasse was collected from an alcohol industry at Ouro Preto, Minas Gerais, Brazil. Succinic anhydride and pyridine were purchased from VETEC (Brazil). Cationic dyes, GV [C.I.: 42555, chemical formula: C25H30N3Cl,
lmax
: 584 nm] and MB [C.I.: 52030, chemical formula: C16H18N3OS,lmax
: 661 nm] were purchased from SYNTH (Brazil) and used without further purification.2.2. Sugarcane bagasse preparation
Sugarcane bagasse wasfirst dried under sunlight. Thefiber and pith fractions were broken into small pieces and subsequently dried at 90C in an oven for 24 h. Sugarcane bagasse was reduced to powder by milling with tungsten ring mill. The powder was sieved in a four-sieve system (10, 60, 100 and 200 mesh). The fraction from 100 to 200 mesh was collected and washed with distilled water under constant stirring at 60e70 C for elimination of residual
sugars, separated by singlefiltration, washed with EtOH 95%, and dried at 90C in an oven. Finally, it was washed again in a Soxhlet apparatus with hexane-ethanol (1:1) for 4 h to eliminate extrac-tives and lignin extracted from milling process. It was dried at 90C in an oven and stored in desiccator.
2.3. Synthesis of SCB 2
SCB 2 was prepared and characterized according to the method-ology described by Gurgel et al.[20]. Sugarcane bagasse (5 g), succinic anhydride (15 g) and dry distilled pyridine (50 mL) were added to
S N
N
H3C
CH3
N
CH3
CH3
+
Cl _
Methylene Blue
N
N
H3C
CH3
H3C
H3C
N
H3C
CH3
+ Cl
_
Gentian Violet
O-Na+
O O
O
O-Na+
O O
O
SCB 2
a round-bottomflask equipped with a reflux condenser. The mixture was heated at pyridine reflux for 24 h. At the end of the succinylation, modified bagasse was separated byfiltration using a sintered glass funnel, washed with a solution of acetic acid in methylene chloride (1 mol/L), ethanol (95%), distilled water, saturated sodium bicarbonate solution, distilled water and then with acetone.
2.4. Adsorption experiments
A series of adsorption experiments of MB and GV onto SCB 2 were carried out. The parameters investigated include pH of the adsorption medium, contact time and adsorption capacity. All experiments were carried out at 25C. The obtained data were employed to develop equilibrium and kinetic mathematic models.
2.4.1. Kinetic study of MB and GV adsorption onto SCB 2
Experiments with each dye and SCB 2 were performed to determine the adsorption equilibrium time. The time interval used was from 10 to 1440 min. Samples of 20 mg of SCB 2 were placed into 250-mL Erlenmeyerflasks containing 100.0 mL of dye solution at known concentrations (200 mg/L for MB and 450 mg/L for GV) under constant stirring. The experiments were made without pH correction. The pH of the solutions containing SCB 2, MB and/or GV was measured and found to be between 7.0 and 8.0. The adsorbent was separated from dye solution by centrifugation (ExcelsaÒ
II mod. 206 BL) at 3600 rpm for 20 min. The residual dye concentration was measured by collecting the supernatant and measuring the concentration of MB and GV after sorption using a UVeVIS
spec-trophotometer (BIOSPECTRO, SP220) at an absorbance wavelength of 661 and 584 nm, respectively. The dyes concentration was calculated from a calibration curve of absorbance versus dye concentration. The adsorption amount at time t, qt (mg/g), was calculated by:
qt ¼ ð
Ci CtÞ V
w (1)
whereCiandCt(mg/L) are the liquid-phase concentration of dye at
initial and any time, respectively,V(L) is the volume of the solution, andw(g) is the weight of adsorbent used.
2.4.2. Effect of pH on MB and GV adsorption onto SCB 2
The effect of pH on MB and GV adsorption was studied over the pH range from 2 to 10. The pH was adjusted by adding few drops of NaOH and/or HCl solutions at 0.01e1.0 mol/L. In this study, 100.0 mL of dye
solution of known concentration (200 mg/L for MB and 450 mg/L for GV) at different pH values was stirred with 20 mg of SCB 2. The stirring time was 6 h and 20 h for MB and GV, respectively. The dye concentration was determined as described earlier.
2.4.3. Adsorption isotherms for MB and GV
The experiments were performed for each dye and SCB 2 to determine adsorption isotherms. Samples from 15 to 40 mg and from 25 to 60 mg of SCB 2 were employed in the adsorption experiments for MB and VC, respectively. The samples were placed into 250-mL Erlenmeyerflasks containing 100.0 mL of dye solution at known concentration (150 mg/L for MB and 400 mg/L for GV) under constant stirring. Each experiment was performed at pH of the greatest dye adsorption, 8.0 for both dyes, during the time necessary to achieve the equilibrium. The equilibrium times used in these experiments were obtained from the kinetic study and found to be 360 min for MB and 1200 min for GV, respectively. The adsorption amount at equilibrium,qe(mg/g), was calculated by:
qe ¼ ðCi CeVÞ
w (2)
whereCiandCe(mg/L) are the liquid-phase concentration of dye at
initial and equilibrium, respectively, V (L) is the volume of the solution, andw(g) is the weight of adsorbent used.
2.5. Determination of zero charge point
The pH of zero charge point, pHPZC, for SCB 2 was determined using the mass titration method described by Noh and Schwarz [22]. Solutions of 0.01 mol/L NaNO3with pH values of 3, 6, and 11 were prepared using 0.1 mol/L HNO3and 0.1 mol/L NaOH. In this method, 100.0 mL of the prepared solution with different initial pH was added to each 250-mL Erlenmeyerflasks containing samples of SCB 2 in order to give solid to liquid ratios of 0.05, 0.1, 0.5, 1, 5 and 10%. The equilibrium pH was measured after 24 h of shaking.
3. Results and discussion
3.1. Synthesis and characterization of SCB 2
The succinylation reaction allowed the introduction of chelating functional groups in to sugarcane bagasse by esterification. The weight gain and concentration of carboxylate functions per gram of modified bagasse were found to be 80.5% and 6.0 mmol/g. SCB 2 was also characterized by FTIR spectroscopy. The most important changes that can be noticed is the arising of a band at 2925 cm 1, corresponding to asymmetric stretching of CH2due to introduction of the succinyl group, at 1577 cm 1corresponding to asymmetric and symmetric stretching owing to the presence of carboxylate functions (eCOO Naþ), and at 1743 cm 1corresponding to
asym-metric and symasym-metric stretching of ester groups (eCeOeC]O)
owing to the introduction of succinyl group by esterification[20].
3.2. Adsorption rate
Adsorption rate was investigated by measuring the amount of adsorbed dye at different contact times and pH values.
3.2.1. Effect of contact time
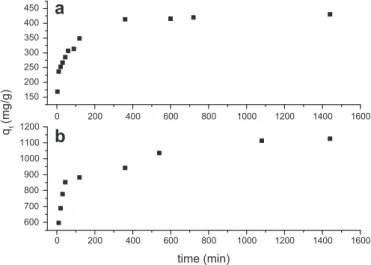
The effect of contact time on the adsorption of MB and GV onto SCB 2 for afixed initial dye concentration, 200 mg/L for MB and 450 mg/L for GV, and pH 7.0e8.0 at 25 C is shown in Fig. 2.
Noteworthy is the fact that dye uptake is rapid for thefirst 100 min and thereafter it proceeds at a slower rate and finally attains saturation. At this point, the amount of adsorbed dye reached
600 700 800 900 1000 1100 1200
0 200 400 600 800 1000 1200 1400 1600
0 200 400 600 800 1000 1200 1400 1600 150
200 250 300 350 400 450
a
b
time (min) qt
(mg/g)
a dynamic equilibrium state with the amount of dye in solution [23]. The time required to achieve the equilibrium state was called equilibrium time. The amount of adsorbed dye at the equilibrium time shows the maximum dye adsorption under the experimental conditions. The uptake of dye onto SCB 2 is fast at the initial stages, and thereafter, it becomes slower close to the equilibrium. It can be explained by the fact that a large number of vacant surface sites are available for adsorption during the initial stage, and after a period of time, the remaining vacant surface sites are difficult to be occupied due to repulsive forces between the solute molecules on the solid and bulk phases[24]. As can be seen fromFig. 2, equi-librium times of 6 h and 20 h were found for MB and GV, respec-tively. The result for MB adsorption is similar to those obtained by Hamdaoui [25], who found equilibrium times of 5 h for the adsorption of MB onto cedar sawdust.
In comparison to most of the published reports in the literature, equilibrium times are lower than those presented in this work. On the other hand, the concentrations of dyes employed in those papers are lower than those employed in this work. At low dye concentrations, the vacant surface sites adsorb the dye more rapidly. One explanation for this observation may be the fact that at low concentration almost all dye molecules are adsorbed very quickly on the outer surface. Further increases in the initial dye concentration led to fast saturation of adsorbent surface, and thus, most of the dye adsorption took place slowly inside the pores by intra-particle diffusion. Steric repulsion between molecules of the solute can also minimize adsorption process[23,26].
3.2.2. Effect of pH
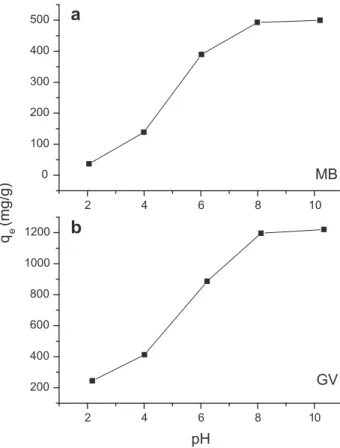
The pH is one of most important parameters for adsorption control. Adsorption of MB and GV onto SCB 2 as function of pH is shown inFig. 3. The adsorption of both dyes increases when the pH was increased and reached a maximum at approximately pH values
of 8.0 for the MB and GV. This result can be explained by consid-ering the cationic nature of the dyes. Low pH values between 2 and 5 were unfavorable for MB and GV adsorption by SCB 2 because of the presence of an excess of hydronium (H3Oþ) ions that competes with dye cations for the adsorption sites. At acidic pH values, the number of negatively charged adsorbent sites (eCOO ) decreased
and apparently did not favor the adsorption of positively charged dye cations [27]. For pH values higher than pHPZC for SCB 2 (pHPZC¼5.26) the number of negatively charged adsorbent sites increases[28], and consequently higher amounts of MB and GV are adsorbed by SCB 2. This observation makes it possible to conclude that the adsorption mechanism is based on electrostatic interac-tions between the negatively surface charged adsorbent and posi-tively charged MB and GV dyes[26,29].
A similar tendency was noticed by Uddin et al. [30] for the adsorption of MB onto tea waste at optimum pH of 8.0, and Royer et al.[28]for the adsorption of MB onto Brazilian pine-fruit shell and carbonized forms at an optimum pH of 8.5.
Based on the obtained results for the adsorption of MB and GV onto SCB 2 as a function of contact time and pH, a contact time of 6 h and 20 h, and a pH of 8.0 for MB and GV were chosen to perform the studies as a function of initial dye concentration and build adsorption isotherms.
3.2.3. Adsorption isotherms
Adsorption isotherms describe how adsorbates interact with adsorbents and are important in optimizing the use of an adsorbent in a real adsorption processes. Various isotherm models are avail-able in the literature. Three of the most widely used isotherms were chosen to evaluate the equilibrium results: Langmuir, Freundlich and Temkin isotherms.
Langmuir adsorption isotherm theory [31,32] is based on five assumptions: (1) adsorption is limited to the formation of a mono-layer, or the number of adsorbed species does not exceed the total surface sites; (2) the energy of adsorption is independent, on the other hands, all surface sites have the same energy or equal affinity for the adsorbate; (3) both solute and solvent have equal molar surface areas; (4) both surface and bulk phases exhibit ideal behavior, e.g. no soluteesolute or soluteesolvent interaction in either phase; and (5) it
assumes that all sites are initially free and does not consider any reverse reaction of a displaced ion, such as protons with the site. Eq.(3)is a linearized and rearranged form of the general form of Langmuir equation[29,33].
Ce
qe ¼
1
Qmaxbþ
Ce
Qmax (3)
whereqe(mg/g) is the equilibrium adsorption capacity,Qmax(mg/g)
is the maximum amount of the dye per unit weight of the SCB 2 to form a complete monolayer coverage on the surface bound at high equilibrium dye concentrationCe(mg/L) andb(L/mg) is the
Lang-muir constant related to the affinity of binding sites.Qmax
repre-sents the practical limiting adsorption capacity when the surface is fully covered with dye, assisting in the comparison of adsorption performance, andbindicates the bond energy of the adsorption reaction between dye and material.
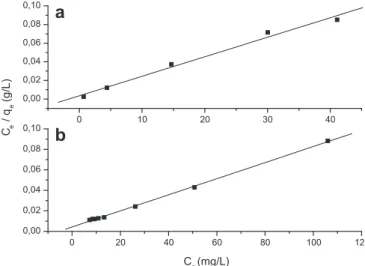
A linearized plot ofCe/qeversusCewas obtained from the model
and is shown inFig. 4.Qmaxandbwere computed from the slopes and
intercepts of the straight lines.Table 1lists the calculated results. One of the essential characteristics of the Langmuir isotherm can be expressed by a separation factor,RL; which is defined as
RL ¼
1 1þ ðbCiÞ
(4)
whereCiis the initial concentration of dye (mg/L). The value ofRL indicates whether an isotherm is irreversible (RL¼0), favorable
2 4 6 8 10
200 400 600 800 1000 1200
2 4 6 8 10
0 100 200 300 400 500
MB
a
b
GV
pH
q
e(mg/g)
(0<RL<1), linear (RL¼1), or unfavorable (RL>1). The obtained values ofRLwere found to be 0.0112 and 0.0122 for MB and GV, respectively. TheseRLvalues showed that the adsorption of both dyes on SCB 2 is favorable.
Freundlich isotherm [34]is an adsorption model for a single solute system. Freundlich model is based on an empirical equation of the distribution of solute between the solid phase and aqueous phase at equilibrium. It is not restricted to the formation of a monolayer in comparison with Langmuir theory. It also assu-mes that the adsorbate concentration increases so too does the concentration of adsorbate on the adsorbent surface. Theoretically, using this expression, an infinite adsorption amount can occur. Freundlich isotherm can be expressed in its linear form as shown below:
lnqe ¼ lnKþ1nlnCe (5)
whereK(mg/g (L/mg)1/n) andnare the Freundlich constants. The term 1/nindicates the intensity of adsorption, in other words, the effectiveness of adsorption. Thus, when 1/n is less than unity, the adsorption is favorable. Values ofKandnare calculated from the intercept and slope of the plot of lnqeversus lnCeand are listed
inTable 1.
Tempkin and Pyzhev[35]considered the effects of some indirect adsorbate/adsorbate interactions on adsorption isotherms and suggested that because of these interactions the heat of adsorption of all the molecules in the layer would decrease linearly with coverage. Tempkin isotherm has generally been used in the line-arized and rearranged form as shown by Eq.(6):
qe ¼ BlnAþBlnCe (6)
whereAis an equilibrium constant of binding corresponding to the maximum energy of binding (mg/L) and the constantBis related to the heat of adsorption. A plot of qe versus ln Ce enables the
determination of the isotherm constantsAandB. Values ofAandB
as obtained are shown inTable 1.
The obtained results for MB and GV adsorption onto SCB 2 for each model are presented inTable 1. The correlation coefficients,R2, were used to compare the three isotherm models. As can be seen fromTable 1, Langmuir model showed a higher correlation coeffi -cient than Freundlich and Tempkin models. Similar results were reported for the adsorption of MB onto cedar sawdust[25]and tea waste[30]and for the adsorption of VC onto hardwood sawdust [36]. TheQmaxof the SCB 2 for MB and GV using Langmuir model
were found to be 478.5 and 1273.2 mg/g, respectively (Table 1). Removal of cationic dyes from aqueous solutions by various modified adsorbents has been performed by a number of research groups in the world. Some recently reported results for adsorbents prepared from agricultural wastes are shown in Table 2 and compared with SCB 2. The most important parameter to compare the adsorption performance is the LangmuirQmaxvalue, since it is
a measure of maximum adsorption capacity of an adsorbent. The value ofQmaxfor MB adsorption obtained from the present study is
larger than those from most of previous works. It has been found that only two adsorbents presented better adsorption efficiency than MB in the literature. For GV adsorption onto SCB 2, the ob-tained value was 1273.2 mg/g, and it is very higher in comparison
with other adsorbents as can be seen from Table 2. These
outstanding sorption capacities for GV and MB adsorption place SCB 2 as one of the best adsorbents for basic dyes removal from aqueous solutions.
3.3. Adsorption kinetics
Kinetic models are used to determine the rate of the adsorption process and how this rate controls the equilibrium time. The adsorption of a solute as a dye by a solid support in aqueous solution is a phenomenon whose kinetics is often complex. The mechanism of adsorption depends on the physical and/or chemical characteristics of the adsorbent, as well as on the mass-transport process. In order to investigate the mechanism of dye adsorption onto SCB 2, three kinetic models were studied: pseudo-first-order, pseudo-second-order and Elovich. These models are the most used to describe dye and other pollutants adsorption such as heavy metals onto solid adsorbents[38].
0 20 40 60 80 100 120 0,00
0,02 0,04 0,06 0,08
0,10 0 10 20 30 40
0,00 0,02 0,04 0,06 0,08 0,10
C / qee
(g/L)
C
a
b
e (mg/L)
Fig. 4.Langmuir plots for the adsorption of (a) MB and (b) GV onto SCB 2.
Table 1
Isotherm parameters for the adsorption of MB and GV onto SCB 2.
Langmuir Freundlich Tempkin
MB GV MB GV MB GV
Qmax(mg/g) 478.5 1273.2 K(mg/g) 301.1 483.3 A(mg/L) 1115.18 5.22
b(L/mg) 0.587 0.184 n 9.708 4.578 B 42.36 204.76
R2 0.9996 0.9998 R2 0.9842 0.9036 R2 0.9622 0.8630
Table 2
Comparison of maximum adsorption capacities for MB and GV taken-up.
Adsorbent Dye Qmax(mg/g) Source
Succinylated sugarcane bagasse SCB 2 MB 478.47 This work
Brazilian pine-fruit shell MB 252 [28]
Carbonaceous Brazilian pine-fruit shell MB 529 [28]
Tea waste MB 85.16 [30]
Activated carbon MB 588 [37]
Citric acid esterifying wheat straw MB 312.50 [19] Succinylated sugarcane bagasse SCB 2 GV 1273.16 This work Citric acid esterifying wheat straw GV 227.27 [19]
Hardwood sawdust GV 341 [36]
Sunflower seed hulls GV 92.59 [23]
The pseudo-first-order kinetic model of Lagergren[39]is more suitable for lower concentrations of solute and its linear form is
logðqe qtÞ ¼ logqe
k1
2:303t (7)
where qt (mg/g) is the amount of adsorbate adsorbed at time t
(min);qe(mg/g) is the adsorption capacity in the equilibrium;k1 (min 1) is the rate constant of pseudo-first-order model.
The values ofk1andqefor the adsorption of MB and GV onto SCB
2 were determined from the plot of log (qe qt) versust. The
ob-tained straight line yieldsk1as the slope and lnqeas the intercept.
The pseudo-second-order model of Ho and McKay[40]based on adsorption capacity can be represented in the linear form as follows
t
qt ¼
1
k2q2
e
þ 1
qet (8)
whereqe(mg/g) andqt(mg/g) are the solute amounts adsorbed per
unit mass of adsorbent at equilibrium time and at timet(min) and
k2is the pseudo-second-order rate constant (g mg 1min 1). The equilibrium constants of pseudo-second-order model,k2andqecan
be obtained from the slope and intercept of the plot oft/qtversust
(Fig. 5).
Elovich model suggests that the chemisorption, i.e. a chemical reaction, is probably the mechanism that controls the rate of adsorption[41]. This model can be applied with success in liquid solution and the linear form of the Elovich equation is:
qt ¼ 1
b
lnðab
Þ þ 1b
lnt (9)where
a
(mg/g h) is the initial sorption rate andb
(g/mg) is the desorption constant.The values
a
andb
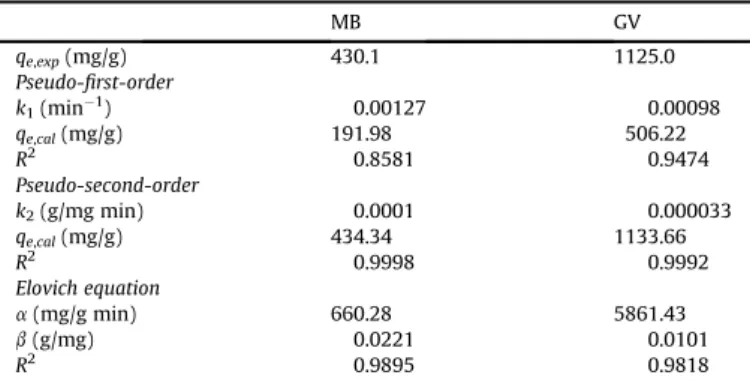
can be calculated from the slope and inter-cept of the plot ofqtversus lntthat yields a straight line.As can be seen fromTable 3, the values ofR2are closer to unit for pseudo-second-order model than pseudo-first-order model and Elovich model. Thus, the pseudo-second-order model can describe the both dyes adsorption by SCB 2. Furthermore, values of qe,cal
calculated from pseudo-second-order model were in good agree-ment with experiagree-mental values,qe,exp, than those calculated from
pseudo-first-order model. Adsorption phenomenon followed the pseudo-second-order model during all period of adsorption and thus supports the model presupposition that the adsorption is
controlled by a chemical process, i.e. chemisorption[41]. Values of
R2for Elovich model were lower than pseudo-second-order model and thus indicate that Elovich model cannot be adequate to describe the kinetic of adsorption of MB and GV onto SCB 2. Similar results were found for the adsorption of MB and GV onto sepiolit [38]and for the adsorption of MB onto hazelnut Shell[42].
3.4. Adsorption mechanism
The adsorption mechanism for dyes removal by adsorption using an adsorbent material can be assumed as involving three steps in which bulk diffusion is considered to be instantaneous,i.e.
migration of the dye from the bulk of the solution to the surface of the adsorbent, is ignored:
(1) Diffusion of dye through the boundary layer to the surface of the adsorbent;
(2) Intra-particle diffusion: Dye transfer from the exterior surface of the adsorbent to the interior pores of the particle through a pore diffusion or intra-particle diffusion mechanism; (3) Adsorption of dye in an active site on the surface of material via
ion exchange, complexation and/or chelation.
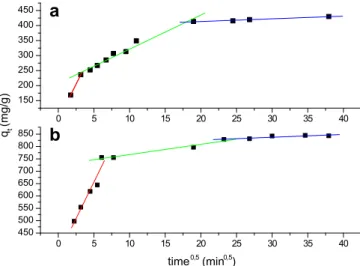
In many cases, there is a possibility that intra-particle diffusion will be the rate-limiting step, which is normally determined using the equation proposed by Weber and Morris[43]:
qt ¼ kidt0:5þCi (10)
whereqt(mg/g) is the adsorbed amount at timetandkid(mg/g h0.5)
is the intra-particle rate constant. According to Eq.(10), a plot ofqt
versust0.5should be a straight line with a slopekidand interceptCi
when adsorption mechanism follows the intra-particle diffusion process. Values ofCigive an idea of the thickness of the boundary
layer. The larger the intercept, the greater will be the boundary layer effect. Values ofkidand interceptCiare presented inTable 4.
If the line passes through the origin, the rate-limiting process is then due only to the intra-particle diffusion. Fig. 6 shows the straight lines of the plot ofqt versust0.5with multi-linearity for
both dyes using SCB 2 as adsorbent. This behavior indicates
-200 0 200 400 600 800 1000 1200 1400 1600 0,0
0,2 0,4 0,6 0,8 1,0 1,2 1,4
t/q (min/g mg)
time (min)
-200 0 200 400 600 800 1000 1200 1400 1600 -0,8
0,0 0,8 1,6 2,4 3,2 4,0
a
b
Fig. 5.Pseudo-second-order kinetic plot for adsorption of (a) MB and (b) GV onto SCB 2.
Table 3
Kinetic parameters for the adsorption of MB and GV onto SCB 2.
MB GV
qe,exp(mg/g) 430.1 1125.0
Pseudo-first-order
k1(min1) 0.00127 0.00098
qe,cal(mg/g) 191.98 506.22
R2 0.8581 0.9474
Pseudo-second-order
k2(g/mg min) 0.0001 0.000033
qe,cal(mg/g) 434.34 1133.66
R2 0.9998 0.9992
Elovich equation
a(mg/g min) 660.28 5861.43
b(g/mg) 0.0221 0.0101
R2 0.9895 0.9818
Table 4
Adsorption mechanism by intra-particle diffusion model.
MB GV
Step 1 Step 2 Step 3 Step 1 Step 2 Step 3
kid(mg/g h0.5) 47.53 11.36 0.90 73.19 10.41 6.381
Ci(mg/g) 86.25 207.92 395.52 365.57 771.66 890.96
that adsorption processes involve more than one single kinetic stage[28].
Thefirst linear portion (sharpest portion) was attributed tofilm diffusion, i.e. transport of dye particles from limit layer to adsorbent surfaces and corresponds to the faster stage of adsorption. The second linear portion corresponds to the gradual adsorption stage where the intra-particle diffusion is the rate-limiting. The third linear portion can be considered as the final equilibrium stage where intra-particle diffusion begins to slow down because of the extremely low dye concentration in the solution and the dye particles occupied all the active sites of SCB 2 adsorbent.
The different adsorption rates noticed showed that the adsorption of both dyes onto SCB 2 was initially fast and decreases with time.
4. Conclusions
Succinylated sugarcane bagasse (SCB 2) prepared from sugar-cane bagasse, an important agricultural waste, after only one chemical modification step showed to be very efficient for removing MB and GV from aqueous solutions by adsorption. Equilibrium adsorption times were found to be 6 h and 20 h for MB and GV, respectively and optimum pH for both dyes removal was found to be equal to 8.0. The results of equilibrium adsorption were evaluated by three adsorption models and experimental datafitted very well to the Langmuir model. Maximum adsorption capacities for removal of MB and GV were found to be 478.5 and 1273.2 mg/g, respectively. This value ofQmaxfor MB adsorption is larger than
those in most of the reports published in the literature. For GV, maximum adsorption capacity was found to be 1273.2 mg/g and it is higher than other adsorbents capacities reported at present moment in the literature. Three kinetic models were used to model the kinetics of adsorption. The adsorption process was well described by pseudo-second-order model, however the intra-particle diffusion model yielded three linear regions, which sug-gested that the adsorption can be also described by multiple sorption rates. SCB 2 exhibited remarkable adsorption capacities for removal of GV and MB from aqueous single solutions.
Acknowledgments
The authors are grateful to Universidade Federal de Ouro Preto, FAPEMIG, CNPq and CAPES. Authors would also like to thank
Dr. Jason G. Taylor (UFOP) for insightful discussion and for reviewing the manuscript for its English usage.
References
[1] Forgacs E, Cserhati T, Oros G. Removal of synthetic dyes from wastewaters: a review. Environment International 2004;30:953e71.
[2] Gupta VK, Carrott PJM, Carrott Ribeiro, Suhas MML. Low-cost adsorbents: growing approach to wastewater treatmentea review. Critical Reviews in Environmental Science and Technology 2009;39:783e842.
[3] Pearce CI, Lloyd JR, Guthrie JT. The removal of colour from textile wastewater using whole bacterial cells: a review. Dyes and Pigments 2003;58:179e96. [4] Essawy AA, Ali AEH, Abdel-Mottaleb MSA. Application of novel
copolymer-TiO2 membranes for some textile dyes adsorptive removal from aqueous solution and photocatalytic decolorization. Journal of Hazardous Materials 2008;157:547e52.
[5] Sun QY, Yang LZ. The adsorption of basic dyes from aqueous solution on modified peat-resin particle. Water Research 2003;37:1535e44.
[6] Gupta VK, Mittal A, Krishnan L, Gajbe V. Adsorption kinetics and column operations for the removal and recovery of malachite green from wastewater using bottom ash. Separation and Purification Technology 2004;40:87e96. [7] Gupta VK, Mittal A, Jain R, Mathur M, Sikarwar S. Adsorption of Safranin-T
from wastewater using waste materialse activated carbon and activated rice husks. Journal of Colloid and Interface Science 2006;303:80e6. [8] O’Neill C, Hawkes FR, Hawkes DL, Lourenco ND, Pinheiro HM, Delee W. Colour
in textile effluentsesources, measurement, discharge consents and simula-tion: a review. Journal of Chemical Technology and Biotechnology 1999;74: 1009e18.
[9] Kunz A, Peralta-Zamora P, Moraes SG, Durán N. Novas tendências no trata-mento de efluentes texteis. Química Nova 2002;25:78e82.
[10] Gupta VK, Jain R, Varshney S. Removal of reactofix golden yellow 3 RFN from aqueous solution using wheat husk e an agricultural waste. Journal of Hazardous Materials 2007;142:443e8.
[11] Mittal A, Mittal J, Malviya A, Gupta VK. Removal and recovery of chrysoidine Y from aqueous solutions by waste materials. Journal of Colloid and Interface Science 2010;344:497e507.
[12] Rafatullah M, Sulaiman O, Hashim R, Ahmad A. Adsorption of methylene blue on low-cost adsorbents: a review. Journal of Hazardous Materials 2010;177: 70e80.
[13] Ahmad R. Studies on adsorption of crystal violet dye from aqueous solution onto coniferous pinus bark powder (CPBP). Journal of Hazardous Materials 2009;171:767e73.
[14] Gupta VK, Suhas, Ali I, Saini VK. Removal of rhodamine B, fast green, and methylene blue from wastewater using red mud, an aluminum industry waste. Industrial and Engineering Chemistry Research 2004;43:1740e7. [15] Gupta VK, Suhas. Application of low-cost adsorbents for dye removal e
a review. Journal of Environmental Management 2009;90:2313e42. [16] Dabrowski A. Adsorptionefrom theory to practice. Advances in Colloid and
Interface Science 2001;93:135e224.
[17] Babel S, Kurniawan TA. Low-cost adsorbents for heavy metals uptake from contaminated water: a review. Journal of Hazardous Materials 2003;97: 219e43.
[18] Crini G. Non-conventional low-cost adsorbents for dye removal: a review. Bioresource Technology 2006;97:1061e85.
[19] Gong RM, Zhu SX, Zhang DM, Chen J, Ni SJ, Guan R. Adsorption behavior of cationic dyes on citric acid esterifying wheat straw: kinetic and thermody-namic profile. Desalination 2008;230:220e8.
[20] Gurgel LVA, Freitas RP, Gil LF. Adsorption of Cu(II), Cd(II), and Pb(II) from aqueous single metal solutions by sugarcane bagasse and mercerized sugar-cane bagasse chemically modified with succinic anhydride. Carbohydrate Polymers 2008;74:922e9.
[21] Pereira FV, Gurgel LVA, Aquino SF, Gil LF. Removal of Zn2þfrom electroplating wastewater using modified wood sawdust and sugarcane bagasse. Journal of Environmental Engineering 2009;135:341e50.
[22] Noh JS, Schwarz JA. Effect of HNO3treatment on the surface-acidity of acti-vated carbons. Carbon 1990;28:675e82.
[23] Hameed BH. Equilibrium and kinetic studies of methyl violet sorption by agricultural waste. Journal of Hazardous Materials 2008;154:204e12. [24] Mall ID, Srivastava VC, Kumar GVA, Mishra IM. Characterization and
utiliza-tion of mesoporous fertilizer plant waste carbon for adsorptive removal of dyes from aqueous solution. Colloids and Surfaces A: Physicochemical and Engineering Aspects 2006;278:175e87.
[25] Hamdaoui O. Batch study of liquid-phase adsorption of methylene blue using cedar sawdust and crushed brick. Journal of Hazardous Materials 2006;135: 264e73.
[26] Hameed BH, El-Khaiary MI. Removal of basic dye from aqueous medium using a novel agricultural waste material: pumpkin seed hull. Journal of Hazardous Materials 2008;155:601e9.
[27] Garg VK, Kumar R, Gupta R. Removal of malachite green dye from aqueous solution by adsorption using agro-industry waste: a case study ofProsopis cineraria. Dyes and Pigments 2004;62(1):1e10.
[28] Royer B, Cardoso NF, Lima EC, Vaghetti JCP, Simon NM, Calvete T, et al. Applications of Brazilian pine-fruit shell in natural and carbonized forms as 0 5 10 15 20 25 30 35 40
450 500 550 600 650 700 750 800 850
time 0,5 (min0,5
)
0 5 10 15 20 25 30 35 40 150
200 250 300 350 400 450
a
b
qt
(mg/g)
adsorbents to removal of methylene blue from aqueous solutionsekinetic and equilibrium study. Journal of Hazardous Materials 2009;164:1213e22. [29] Mohanty K, Naidu JT, Meikap BC, Biswas MN. Removal of crystal violet from
wastewater by activated carbons prepared from rice husk. Industrial and Engineering Chemistry Research 2006;45:5165e71.
[30] Uddin MT, Islam MA, Mahmud S, Rukanuzzaman M. Adsorptive removal of methylene blue by tea waste. Journal of Hazardous Materials 2009;164: 53e60.
[31] Langmuir I. The adsorption of gases on plane surfaces of glass, mica and platinum. Journal of Colloid and Interface Science 1918;57:1361e403. [32] Rosen MJ. Surfactants and interfacial phenomena. 2nd ed. New York: John
Wiley and Sons; 1989.
[33] Ho YS, Chiu WT, Wang CC. Regression analysis for the sorption isotherms of basic dyes on sugarcane dust. Bioresource Technology 2005;96:1285e91. [34] Freundlich H. Adsorption in solution. Zeitschrift für Physikalische Chemie
1906;57:385e470.
[35] Tempkin MJ, Pyzhev V. Acta Physiochimica URSS 1940;12:217e22. [36] Chakraborty S, De S, DasGupta S, Basu JK. Adsorption study for the
removal of a basic dye: experimental and modeling. Chemosphere 2005; 58:1079e86.
[37] El Qada EN, Allen SJ, Walker GA. Adsorption of basic dyes from aqueous solution onto activated carbons. Chemical Engineering Journal 2008;135: 174e84.
[38] Dogan M, Ozdemir Y, Alkan M. Adsorption kinetics and mechanism of cationic methyl violet and methylene blue dyes onto sepiolite. Dyes and Pigments 2007;75:701e13.
[39] Lagergren S. Zur Theorie der sogenannten adsorption gelöster stoffe, Kungliga Svenska Vetenskapsakademiens. Handlingar 1898;24(4):1e39.
[40] Ho YS, McKay G. Kinetic models for the sorption of dye from aqueous solution by wood. Process Safety and Environmental Protection 1998;76:183e91. [41] Crini G, Badot PM. Application of chitosan, a natural aminopolysaccharide, for
dye removal from aqueous solutions by adsorption processes using batch studies: a review of recent literature. Progress in Polymer Science 2008;33: 399e447.
[42] Sanchez-Martin J, Gonzalez-Velasco M, Beltran-Heredia J, Gragera-Carvajal J, Salguero-Fernandez J. Novel tannin-based adsorbent in removing cationic dye (methylene blue) from aqueous solution. Kinetics and equilibrium studies. Journal of Hazardous Materials 2010;174:9e16.